Market Overview
| Study Period | 2020 - 2031 |
|---|---|
| Forecast Data Period | 2026 - 2031 |
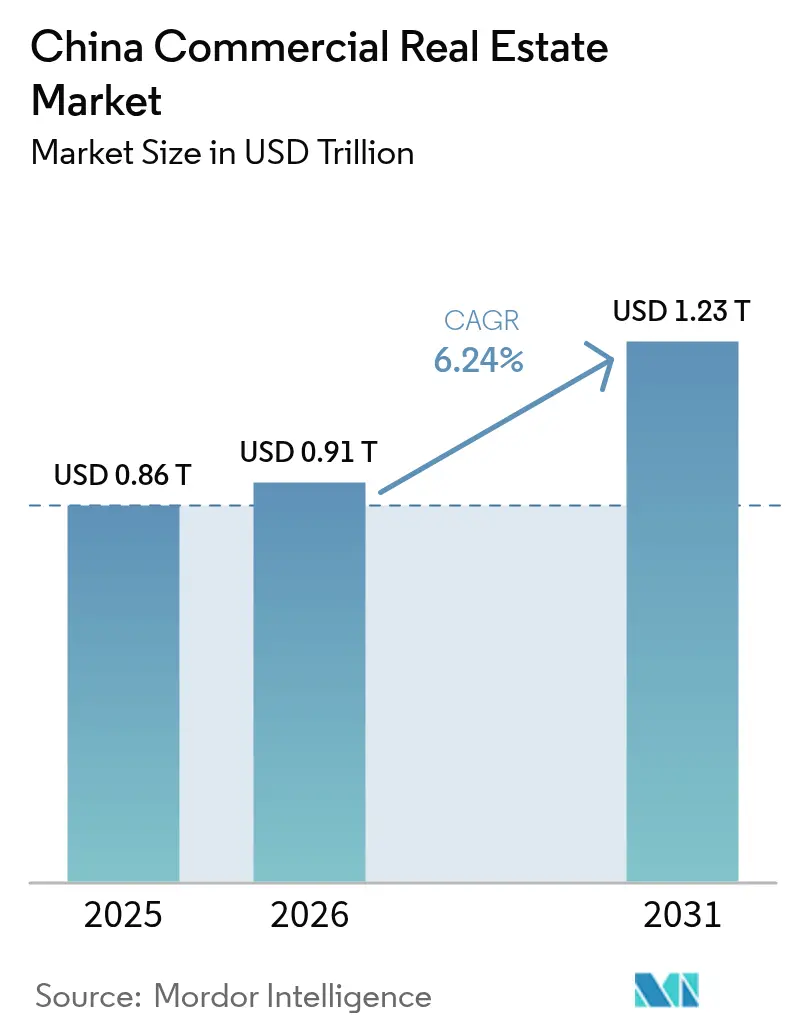
| Base Year Market Size (2025) | USD 0.86 Trillion |
| Market Size (2026) | USD 0.91 Trillion |
| Market Size (2031) | USD 1.23 Trillion |
| Growth Rate (2026 - 2031) | 6.24% CAGR |
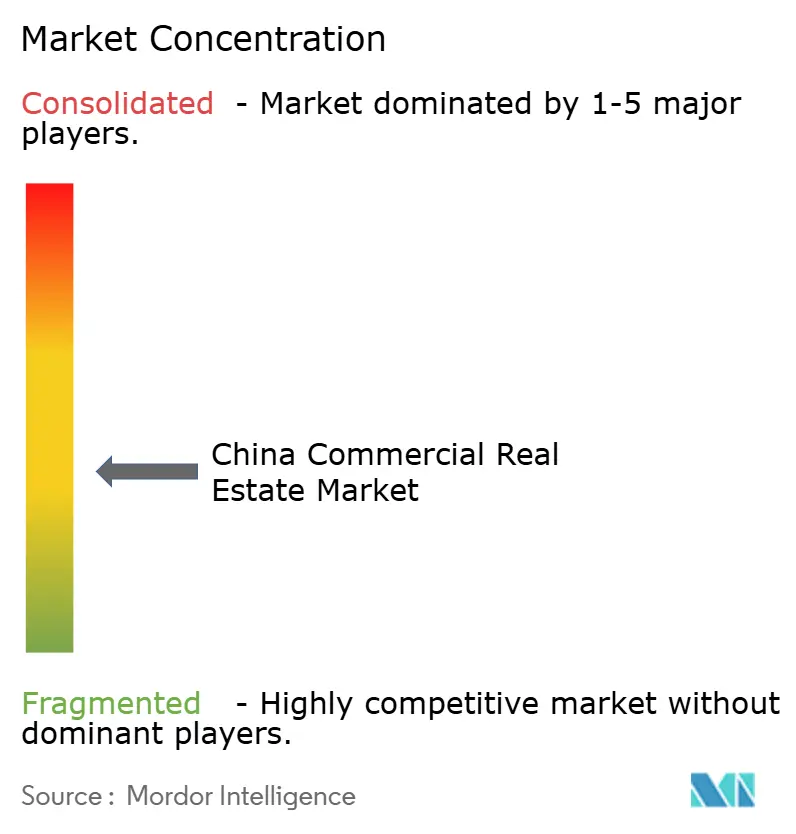
| Market Concentration | Medium |
Major Players *Disclaimer: Major Players sorted in no particular order Image © Mordor Intelligence. Reuse requires attribution under CC BY 4.0. | |
China Commercial Real Estate Market Analysis by Mordor Intelligence
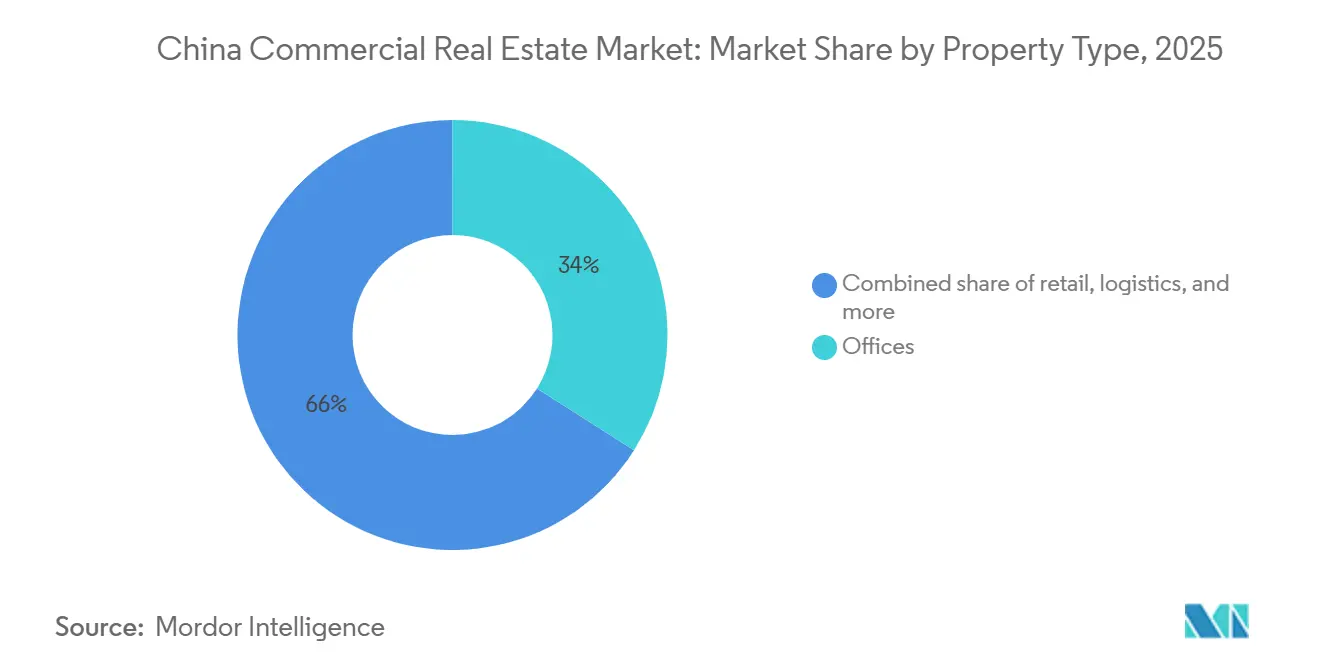
The China commercial real estate market size expanded from USD 855.26 billion in 2025 to USD 909.22 billion in 2026 and is projected to reach USD 1,234.6 billion by 2031, advancing at a 6.31% CAGR between 2026 and 2031. This growth arc stems from a decisive turn toward income-generating assets and high-throughput logistics facilities as developers confront elevated refinancing costs and soft office absorption[1]CBRE, “China Office Market Outlook 2025,” CBRE.com. Omnichannel retail platforms, mandatory on-site renewable-energy rules, and an enlarged C-REIT pipeline are together redefining capital deployment priorities. While offices still commanded 34% of value in 2025, distribution centers are capturing the incremental square footage, aided by 24-hour e-commerce fulfillment timelines. Rental operations, although just 38% of the 2025 deal value, are gaining favor as institutional capital prizes predictable yields over volatile pre-sales inflows.
Key Report Takeaways
- By property type, offices controlled 34% of the China commercial real estate market share in 2025, whereas logistics facilities are forecast to expand at a 7.72% CAGR through 2031.
- By business model, the sales route accounted for 62% of China commercial real estate market size in 2025, while rental portfolios are projected to grow at a 6.98% CAGR to 2031.
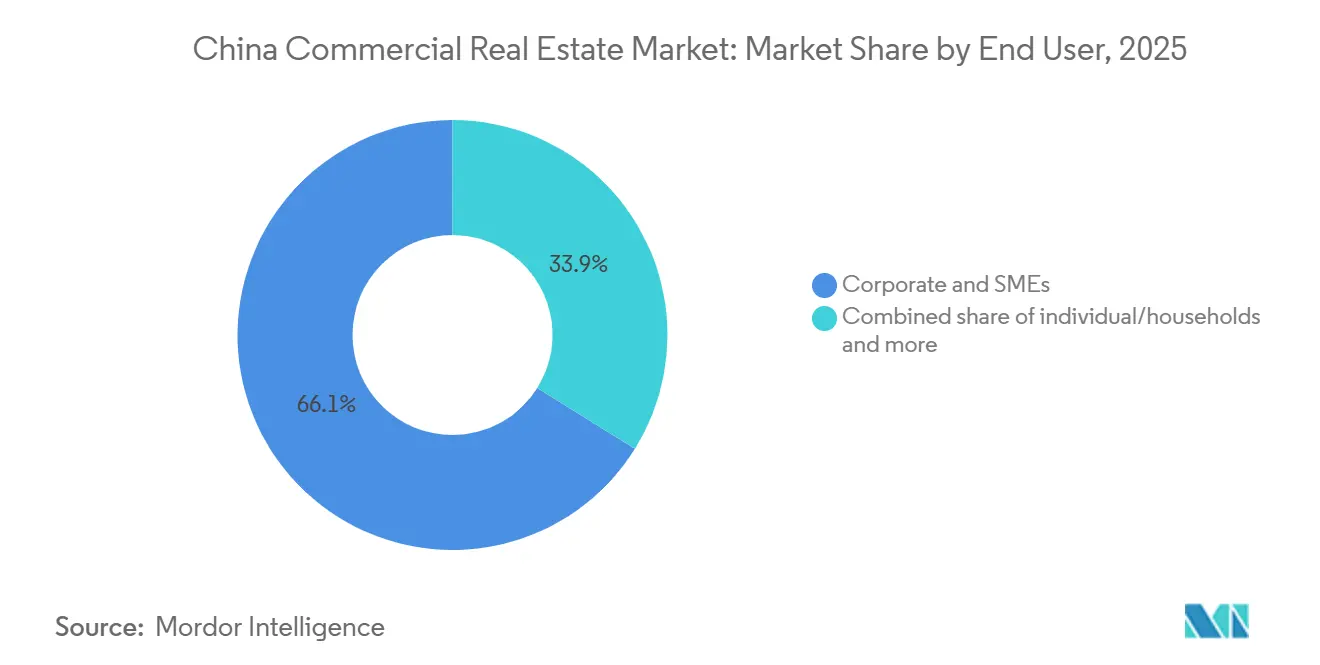
- By end-user, corporates and SMEs held 66.12% of 2025 demand, yet individual and household participation is advancing at a 6.73% CAGR over 2026-2031.
- By city, Shanghai led with a 22% stake in 2025; Chengdu is the fastest mover, climbing at a 7.24% CAGR through 2031.
Note: Market size and forecast figures in this report are generated using Mordor Intelligence’s proprietary estimation framework, updated with the latest available data and insights as of 2026.
China Commercial Real Estate Market Trends and Insights
Drivers Impact Analysis*
| Driver | % Impact on CAGR Forecast | Geographic Relevance | Impact Timeline |
|---|---|---|---|
| Resilient logistics demand from omni-channel retail & on-shoring | +1.2% | National clusters in Yangtze River Delta, Pearl River Delta, Chengdu-Chongqing | Medium term (2-4 years) |
| Expanded C-REIT pipeline widening exit options | +0.9% | Shanghai, Beijing, Shenzhen, Guangzhou | Short term (≤ 2 years) |
| Data-center & AI edge-node land-banking | +0.8% | Key coastal and inland tech hubs | Long term (≥ 4 years) |
| State-backed urban-renewal grants for Grade-A office retrofits | +0.7% | Major Tier-1 and Tier-1.5 cities | Medium term (2-4 years) |
| Mandatory on-site PV & storage lowering opex | +0.5% | Provinces with strong solar resources | Medium term (2-4 years) |
| Tokenized fractional ownership unlocking retail capital | +0.3% | Core Tier-1 cities, expanding to Tier-2 | Long term (≥ 4 years) |
| Source: Mordor Intelligence | |||
Resilient Logistics Demand From Omni-Channel Retail & On-Shoring
E-commerce platforms shortening delivery windows are driving robust warehouse leasing, even as traditional mall footfall plateaus. GLP signed 7.8 million m² of leases in Q2 2025, a 16% uptick, while keeping portfolio occupancy at 87%. Multinationals' reshoring distribution nodes to hedge geopolitical risk have amplified absorption around port-adjacent and inland rail hubs. Developers respond by pairing automated sortation belts with cold-chain bays, an amenity mix that earns 15-20% rent premiums. Cross-border parcel volumes in lower-tier cities further reinforce demand for regional fulfillment hubs. Together, these themes sustain a logistics pipeline that outpaces all other asset classes.
Expanded C-REIT Pipeline Widening Exit Options For Developers
The December 2025 decision to let Grade-A offices, malls, and four-star hotels enter the C-REIT universe unlocked CNY 207 billion (USD 29.6 billion) of fresh equity across 77 trusts[2]CSRC, “C-REIT Expansion Notice 2025,” CSRC.gov.cn. Seasoned sponsors now enjoy a liquid path out of construction risk, reducing dependence on offshore bonds capped by higher spreads. GLP disbursed USD 171 million in 2024 dividends from its listed vehicles, underscoring the attractiveness of near-100% payout ratios. Eligibility hurdles, three-year operating record, 90% occupancy, and investment-grade leverage concentrate benefits on large players, accelerating industry consolidation. Private-placement REITs pricing at 5-6% yields, versus 3-4% for public peers, reveal a two-tier appetite that mirrors sponsor credit profiles.
State-Backed Urban-Renewal Grants For Grade-A Office Retrofits
The Ministry of Finance earmarked CNY 133.2 billion (USD 19.0 billion) in 2025 for office-block refurbishments in vacancy-prone districts[3]Ministry of Finance China, “Urban Renewal Funding 2025,” mof.gov.cn. Grants offset big-ticket upgrades such as façade recladding, smart HVAC, and wellness amenities tied to LEED Gold or China 3-Star benchmarks. Twenty pilot cities tapped packages ranging from CNY 800 million (USD 114 million) to CNY 1.2 billion (USD 171 million), with funds funneled toward towers erected before 2010 that lag today’s tenant requirements. The subsidies prolong asset life, lift rent resilience, and narrow payback periods, encouraging landlords to decarbonize outdated stock instead of offloading at distressed prices.
Data-Center & AI Edge-Node Land-Banking In Tier-1 And 1.5 Cities
Shanghai ranks seventh worldwide in operational megawatts, while Beijing sits second as hyperscalers and fintech giants race to secure sub-10-millisecond latency. KPMG forecasts Asia-Pacific power demand for server farms to jump 165% by 2030. Developers thus pre-lock utility connections and dual-feed lines, a move that can shave 12-18 months off commissioning. Inland cities such as Guiyang offer 30-40% cheaper land and electricity yet remain tied to coastal edges through the “East Data West Computing” backbone, creating a barbell strategy of core node and remote rack capacity.
Restraints Impact Analysis*
| Restraint | % Impact on CAGR Forecast | Geographic Relevance | Impact Timeline |
|---|---|---|---|
| Structural oversupply of legacy office stock post-hybrid shift | -1.1% | Core Tier-1 and select Tier-2 CBDs | Short term (≤ 2 years) |
| Elevated borrowing costs & offshore refinancing hurdles | -0.9% | National; acute for USD debt issuers | Short term (≤ 2 years) |
| Vacancy pressure in lower-tier malls amid consumption polarization | -0.6% | Tier-3 and outer Tier-2 retail nodes | Medium term (2-4 years) |
| Grid-capacity caps delaying power-intensive redevelopments | -0.4% | Coastal metros and select industrial parks | Medium term (2-4 years) |
| Source: Mordor Intelligence | |||
Structural Oversupply Of Legacy Office Stock Post-Hybrid Shift
Shenzhen’s vacancy touched 29% in Q3 2025 as work-from-anywhere policies compressed per-capita footprints and prompted lease non-renewals. Shanghai posted 23.6%, while Beijing steadied near 16.9%. Incentives such as 6-12 months rent-free and turnkey fit-outs protect occupancy but erode landlord margins. Roughly 72 million m² of CBD stock, much of it built before 2015, lacks the smart-building functions tenants now treat as a baseline. Owners unable to fund upgrades experience value write-downs, pushing distress-sale inventory into the pipeline and dragging overall pricing.
Elevated Borrowing Costs & Offshore Refinancing Hurdles
Chinese banks’ net interest margin slipped to 1.42% in mid-2025, curbing new CRE credit. Fitch flagged rising default risk in securitized pools as overseas investors demand wider spreads. Developers facing USD maturities choose onshore loans at steeper local rates or tap private REITs yielding 5-6%, a premium to listed alternatives. The divergence amplifies refinancing stress for mid-tier sponsors and accelerates M&A as well-capitalized peers acquire discounted pipelines.
*Our forecasts treat driver/restraint impacts as directional, not additive. The impact forecasts reflect baseline growth, mix effects, and variable interactions.
Segment Analysis
By Property Type: Logistics Outpaces Office Amid Fulfillment Shift
Logistics captured 7.8 million m² of fresh leases in 2025 and is forecast at a 7.72% CAGR to 2031, the fastest among property categories. Offices, though still holding a 34% China commercial real estate market share in 2025, wrestle with hybrid-driven downsizing and persistent vacancy above 25% in Shenzhen and Shanghai. Retail vacancy plateaued near 10% across prime centers, but secondary malls lag, reinforcing a bifurcated outlook. Other segments, data centers, life-science labs, and mixed-use campuses- remain small yet draw outsized capital due to sticky leases and inflation-linked rent ladders.
Build-to-suit contracts limit speculative risk for warehouses: GLP posted 87% occupancy across 29 million m² in 2024, highlighting robust demand. Office landlords accelerate wellness retrofits and flexible space tie-ups, yet 9.9% rent erosion in 2025 underlines oversupply pressure. Retail owners embrace omnichannel nodes and themed experiences; Bain estimates O2O penetration hit 50% in 2024. Data-center operators such as GDS and Keppel bundle renewable power and edge racks, narrowing the divide between property and digital infrastructure.


By Business Model: Rental Gains As Developers Seek Stable Yield
Sales transactions still dominated with 62% of the 2025 value, but rental inventories advanced at a 6.98% CAGR outlook, reflecting a structural tilt toward annuity cash flows. The China commercial real estate market size, attributable to rental assets, benefits from C-REIT liquidity and green-finance incentives that compress funding costs. GLP’s near-100% REIT payout illustrated the appeal of predictable distributions, channeling USD 171 million to unitholders in 2024.
Sales remain strong in logistics, where lease-up visibility is high, yet developers recalibrate exit plans to roll stabilized assets into trusts. Longfor booked USD 1.4 billion rental revenue in 2024, up 14.8%, while margin widened thanks to operating leverage. China Resources Land reported USD 2.7 billion from malls the same year at 95% occupancy. Grants that defray retrofit capex further sweeten equity yields for landlords, tipping the scale toward hold-and-harvest strategies.
By End-User: Corporates Dominate, Yet Individuals Accelerate
Corporates and SMEs absorbed 66.12% of the 2025 floor take-up, anchored by head-office leases, anchor retail tenancies, and third-party logistics contracts. Individual participation, however, is poised to climb 6.73% annually as tokenized slices and C-REIT units lower entry thresholds. Government and NGO demand stays stable but low-growth, tied to long-lease administrative suites. The Chinese commercial real estate industry thus watches a gradual democratization of ownership, especially in Shanghai and Shenzhen, where retail investors diversify beyond residential speculation.
Corporate footprints are nonetheless shrinking on a per-employee basis, spurring shorter leases and flight-to-quality relocations. SMEs prefer coworking passes; operators like Kr Space extend into Tier-2 cities where conventional tenancy remains costly. Institutional tenants prioritize ESG ratings, propelling landlords with green credentials to the top of request-for-proposal lists. This tri-vector pull reshapes stacking plans and elevates service components such as proptech analytics and indoor-air quality tracking.
Geography Analysis
Shanghai’s premier role derives from clustered financial-services tenants, China commercial real estate market size leadership, and a logistics grid that funnels imports inland. Despite office softness, the city’s warehouses reached 90% occupancy within 12 months of completion at GLP’s Northwest hub. Several landmark towers are queueing for C-REIT listing in 2026, promising liquidity and re-rating for owners. Data-center operators also prize Shanghai for latency-sensitive finance workloads, reinforcing power-dense development around Waigaoqiao.
Beijing steadied at 16.9% office vacancy owing to policy-driven tenant inflows from fintech and AI labs. The capital ranks second globally in data-center megawatts, attracting hyperscalers that secure dual-grid feeds early. Shenzhen, conversely, saw 29% vacancy in Q3 2025 as suburban pipeline deliveries outpaced net absorption; landlords deploy rent-free carrots to slow churn. Guangzhou gains from Pearl River Delta export cycles, with port-proximate sheds achieving above-market rent escalators.
Chengdu tops growth charts at 7.24% CAGR by leveraging lower land prices and abundant renewable power for data halls. Government grants funnelled into inland logistics corridors amplify its draw. Hangzhou, Wuhan, and Xi’an join a group of second-tier cities receiving retail-upgrade subsidies under the September 2025 program, spurring experiential mall conversions and mixed-use plots. Altogether, region-specific incentives and sectoral pivots are redrawing the geographic balance of investment returns across the China commercial real estate market.
Competitive Landscape
The market remains fragmented, with new floor space delivered by a wide range of developers rather than being concentrated among a few large players. At the same time, consolidation is gradually accelerating as financially strained owners exit the market, creating opportunities for stronger developers to expand their presence. Wanda has increasingly relied on joint venture structures for its recent plaza developments, allowing the company to reduce capital intensity while continuing to generate revenue through development and management fees. In parallel, logistics-focused developers such as GLP and Prologis are differentiating their projects by integrating features like rooftop solar systems and EV charging infrastructure into build-to-suit facilities, helping their offerings stand out in a segment where warehouse layouts are often highly standardized. Additionally, GLP has been expanding into adjacent infrastructure segments, including data centers, where it has recently reported strong growth in related revenues.
Developers rated investment-grade, Longfor, China Resources Land, CapitaLand, enjoy cheaper debt, widening the gulf to mid-tier peers locked out of bond markets. Longfor lifted rental income 14.8% in 2024 to USD 1.4 billion, a testament to its hold-for-yield stance. China Resources Land’s 95% mall occupancy underlines operating-platform strength. Smaller challengers like GDS and Keppel stake claims in hyperscale data campuses and sustainable mixed-use plots, nibbling at incumbents’ edges.
Tech adoption escalates: IoT sensors, AI-driven energy management, and tenant apps cut operating ratios. Mandatory PV and storage for assets over 20,000 m² favor groups with utility-approval expertise, raising entry barriers. The broadened C-REIT regime incentivizes sponsors to seed trusts with stabilized portfolios, altering development cycles toward recurring-income plays. As compliance costs rise, scale and creditworthiness dictate who wins market share in the China commercial real estate market.
China Commercial Real Estate Industry Leaders
Wanda Group
China Resources Land Ltd
Greenland Group
Longfor Group
China Vanke Co.
- *Disclaimer: Major Players sorted in no particular order

Recent Industry Developments
- December 2025: CSRC opened C-REITs to commercial assets, adding USD 29.6 billion in float across 77 trusts.
- September 2025: Ministry of Finance launched retail-revitalization pilots in 50 cities with upgrade subsidies.
- June 2025: GLP recorded a 48% year-on-year leap in data-center revenue during H1 2025.
- March 2025: Longfor posted USD 226.8 billion revenue for 2024, with rental streams climbing 14.8%.


Research Methodology Framework and Report Scope
Market Definitions and Key Coverage
Our study treats China's commercial real estate (CRE) market as all income-generating property, office, retail, logistics, hospitality, data center, life science, and mixed-use assets traded or leased within mainland China, with value expressed in U.S. dollars at transaction date exchange rates.
Scope Exclusion: Residential housing and land bank transactions held only for future development are outside this remit.
Segmentation Overview
- By Property Type
- Offices
- Retail
- Logistics
- Others
- By Business Model
- Sales
- Rental
- By End-user
- Individuals / Households
- Corporates & SMEs
- Others (institutions, governments, NGOs)
- By Cities
- Shanghai
- Beijing
- Shenzhen
- Guangzhou
- Chengdu
- Rest of China
Detailed Research Methodology and Data Validation
Primary Research
Analysts interview institutional investors, lenders, property managers, and occupiers across Tier 1 to emerging inland cities. Discussions test desk assumptions on cap rate shifts, lease tenures, C-REIT pricing, and brown to green retrofit costs, letting us reconcile diverging data and refine discount factors.
Desk Research
We begin by pulling macro signals from sources such as the National Bureau of Statistics, the People's Bank of China financial stability reports, and MOHURD construction starts bulletins; these frame investment flows, vacancy, and price movements. Cross-border trade data from China Customs clarifies logistics footprint growth, while Shanghai and Shenzhen stock exchange filings enrich developer balance sheet analysis. Paid repositories, D&B Hoovers for developer revenue splits and Dow Jones Factiva for transaction news, supply hard to find deal values. The sources named illustrate, not exhaust, the wider set we review.
Market-Sizing & Forecasting
A top down build marries transaction value by property class with city level absorption, then overlays vacancy and average selling price curves to establish the baseline. Select bottom up cross checks, sampled Grade A stock multiplied by prevailing rents and pipeline completions, calibrate totals. Key drivers in the model include GDP growth, office net absorption, warehouse take up, policy induced C-REIT issuances, and prime yield spreads. Multivariate regression projects each driver, generating a future value. Gaps in sub-segment data are bridged by interpolating adjacent year disclosures or weighting peer city analogs vetted with interviewees.
Data Validation & Update Cycle
Outputs undergo variance scans against MSCI professionally managed stock, CBRE quarterly investment tallies, and central bank lending series. Senior analysts review anomalies before sign off. We refresh figures annually and issue interim updates when policy or capital market shocks exceed preset thresholds.
Why Our China Commercial Real Estate Baseline Commands Reliability
Published estimates often differ; choices on scope, exchange rates, and refresh cadence typically explain the gaps.
Key gap drivers here include whether residential build to rent is folded into totals, if estimates cover only professionally managed assets, and the year each firm locks FX rates. Mordor's model aligns segments with actual CRE investor behavior, applies city specific vacancy haircuts, and rolls 12 month RMB averages forward each quarter; practices some peers omit.
Benchmark comparison
| Market Size | Anonymized source | Primary gap driver |
|---|---|---|
| USD 0.86 T (2025) | Mordor Intelligence | - |
| USD 962 B (2024) | Global Consultancy A | Counts only professionally managed portfolios, omits owner occupied assets |
| USD 860 B (2024) | Regional Consultancy B | Uses transaction price database but excludes logistics conversions and data centers |
| USD 217 B (2024) | Industry Analytics C | Reports investment volume, not full asset value; narrower tech centric scope |
These comparisons show that when definitions narrow or value proxies shift, totals swing widely. By anchoring on full income generating stock, rolling quarterly FX, and cross verifying with both desk and field intelligence, Mordor delivers a transparent, repeatable baseline clients can trust.


Key Questions Answered in the Report
How large is the China commercial real estate market in 2026?
The China Commercial Real Estate Market has reached USD 909.22 billion in 2026, up from USD 855.26 billion in 2025.
Which property type is expanding fastest?
Logistics facilities are growing at a 7.72% CAGR through 2031, driven by e-commerce fulfillment timelines.
What is fueling investor interest in rental assets?
The C-REIT rollout and grant-backed retrofit subsidies improve cash yields, encouraging developers to hold stabilized properties.
Why are office vacancies still high in Shenzhen and Shanghai?
Hybrid work reduces space needs, and a large pre-2015 stock lacks the smart features tenants now prioritize.
How does mandatory rooftop solar affect asset values?
On-site PV and storage cut operating costs and help assets qualify for green finance, raising valuation resilience.
Page last updated on:


