
Market Overview
| Study Period | 2020 - 2031 |
|---|---|
| Forecast Data Period | 2026 - 2031 |
| Base Year Market Size (2025) | USD 27.32 Billion |
| Market Size (2026) | USD 28.61 Billion |
| Market Size (2031) | USD 36.06 Billion |
| Growth Rate (2026 - 2031) | 4.74 % |
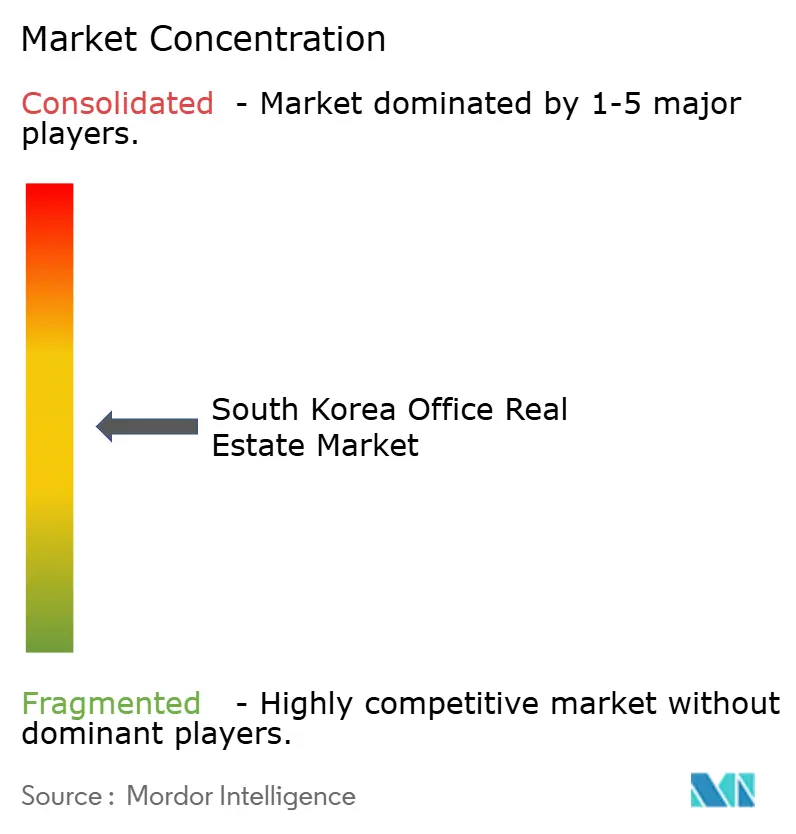
| Market Concentration | Medium |
Major Players *Disclaimer: Major Players sorted in no particular order Image © Mordor Intelligence. Reuse requires attribution under CC BY 4.0. | |
South Korea Office Real Estate Market Analysis by Mordor Intelligence
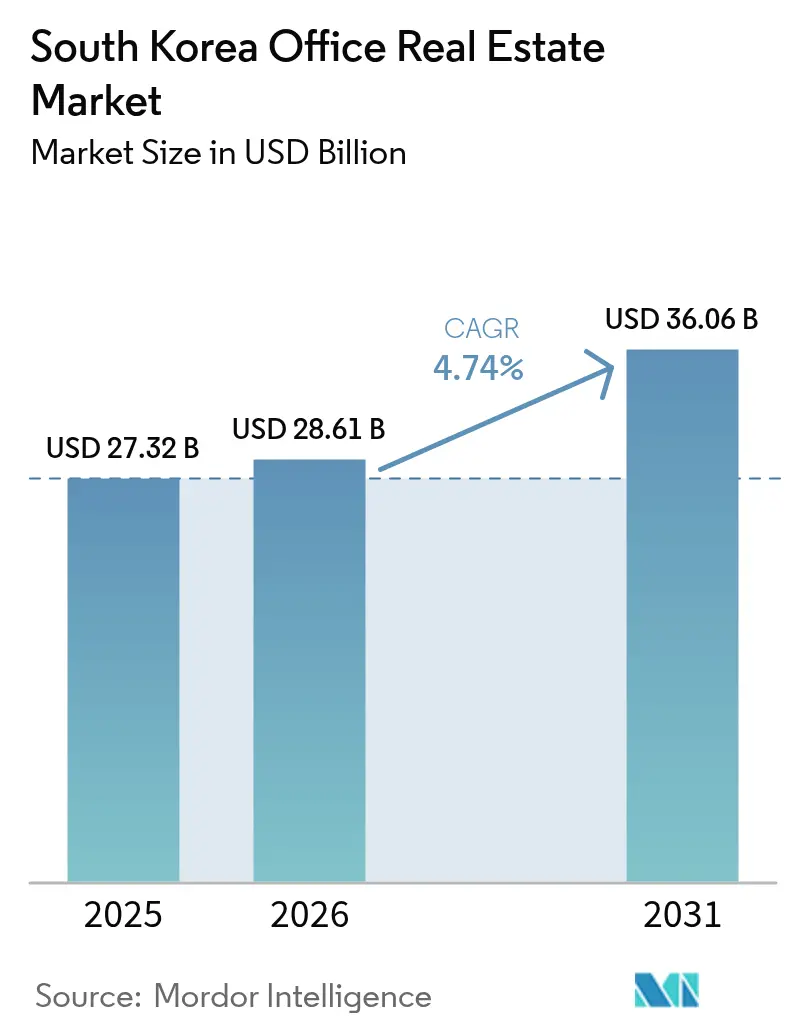
The South Korea office real estate market size was valued at USD 27.32 billion in 2025 and estimated to grow from USD 28.61 billion in 2026 to reach USD 36.06 billion by 2031, at a CAGR of 4.74% during the forecast period (2026-2031). Stable macro‐fundamentals, a deep institutional buyer pool, and rising demand for certified Grade-A assets sustain the up-cycle even as hybrid work reshapes space usage. Seoul’s ambitious riverfront redevelopment, stepped-up retrofit activity tied to the 2030 zero-energy mandate, and a friendlier interest-rate backdrop together reinforce investor confidence. Tenant flight to quality, robust take-up from technology and financial firms, and the early success of satellite hubs such as Magok and Yongsan further broaden the market’s growth base. Liquidity is deepening as domestic REITs scale and foreign capital reallocates from more volatile Asia Pacific locations into South Korea’s transparent, yield-accretive environment.
Key Report Takeaways
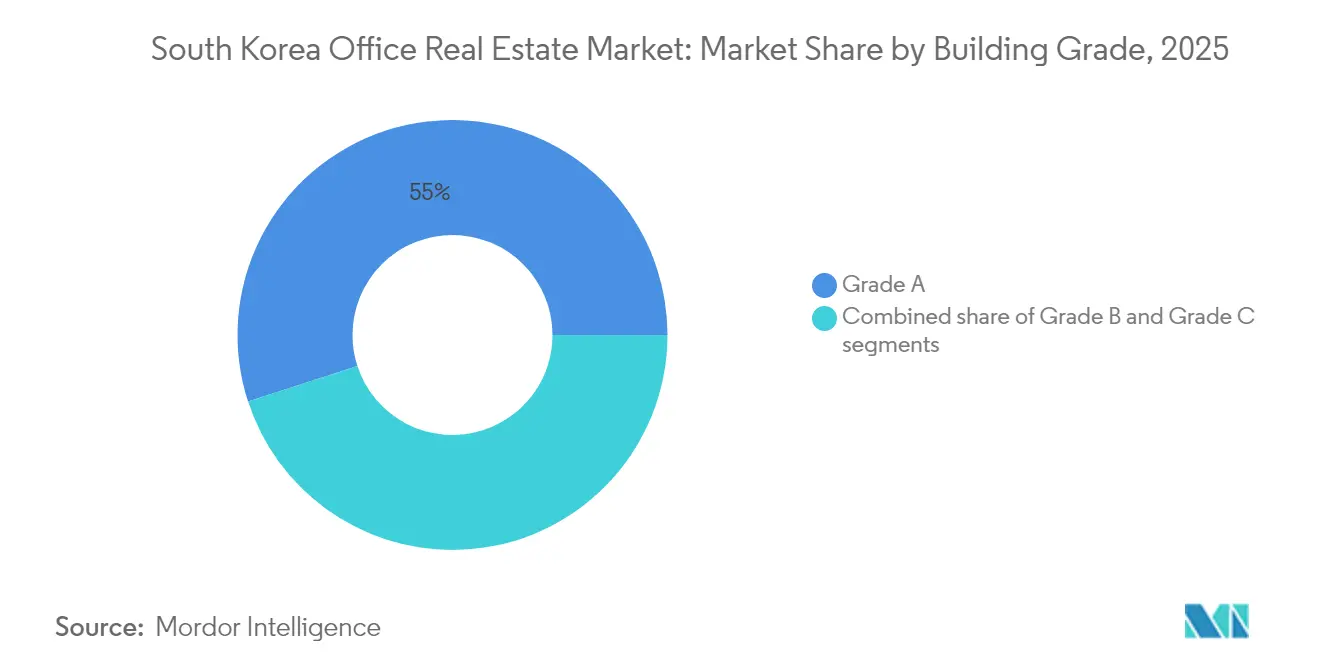
- By building grade, Grade-A properties held 55.01% of South Korea office real estate market share in 2025 and are projected to grow at a 5.18% CAGR to 2031.
- By transaction type, rental activity commanded 76.02% of the South Korea office real estate market size in 2025 and is advancing at a 5.41% CAGR through 2031.
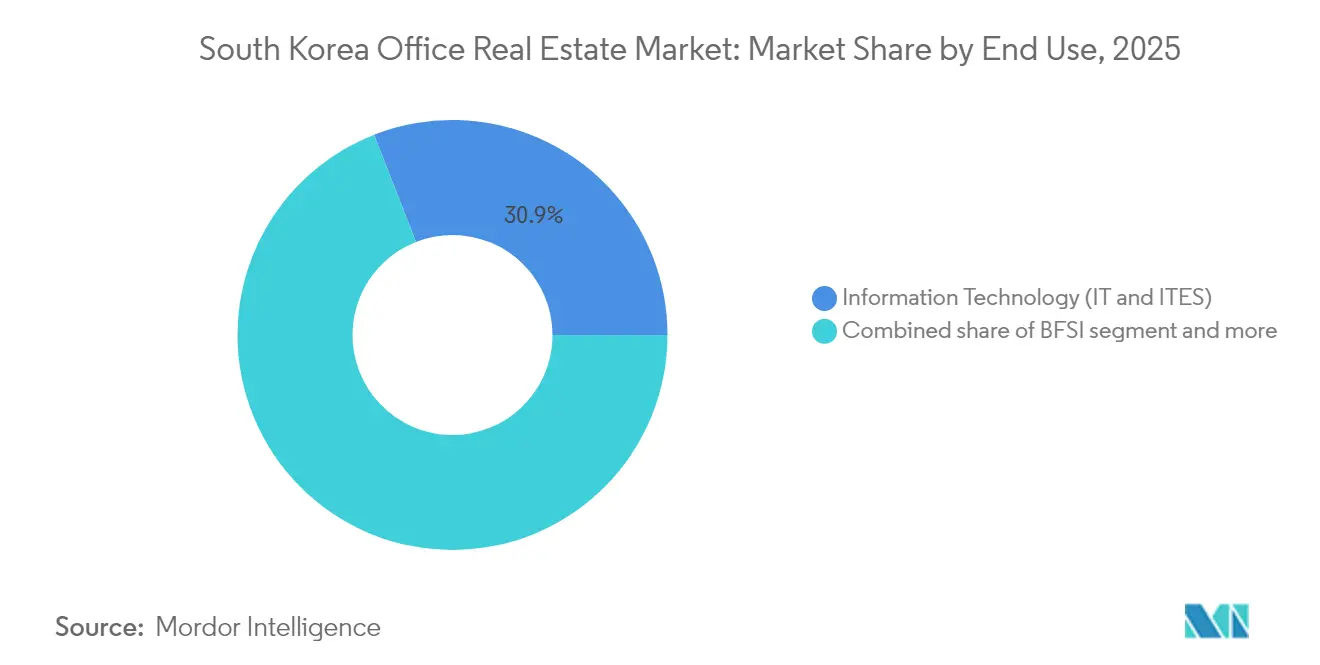
- By end use, Information Technology led with a 30.94% share in 2025, while Business Consulting & Professional Services is the fastest-growing segment at a 5.62% CAGR to 2031.
- By key city, Seoul contributed 55.74% of 2025 revenue; Incheon is set to post the quickest 5.97% CAGR to 2031.
Note: Market size and forecast figures in this report are generated using Mordor Intelligence’s proprietary estimation framework, updated with the latest available data and insights as of 2026.
South Korea Office Real Estate Market Trends and Insights
Drivers Impact Analysis*
| Driver | (~) % Impact on CAGR Forecast | Geographic Relevance | Impact Timeline |
|---|---|---|---|
| Strong tenant preference for certified Grade-A offices supporting rent premiums | +1.2% | Seoul core, Busan CBD, emerging Incheon | Medium term (2-4 years) |
| Increased investment flows from REITs and institutional capital | +1.0% | National, concentrated in Seoul and Busan | Short term (≤ 2 years) |
| Expansion by tech and financial sector firms in core submarkets | +0.9% | Seoul, Daegu tech corridors, Busan financial district | Medium term (2-4 years) |
| Rising occupier demand in emerging hubs like Magok and Yongsan | +0.8% | Seoul metro, spillover to Incheon | Long term (≥ 4 years) |
| Easing interest rates improve development and refinancing activity | +0.7% | National; early gains in Seoul, Incheon, Busan | Short term (≤ 2 years) |
| ESG retrofitting incentives are driving upgrades and leasing momentum | +0.6% | National; priority in Seoul Grade-A buildings | Long term (≥ 4 years) |
| Source: Mordor Intelligence | |||
Strong Tenant Preference for Certified Grade-A Offices Supporting Rent Premiums
As companies align their head-office strategies with employee engagement, a pronounced "flight to quality" is evident in leasing discussions. Class A+/A buildings lifted effective rents 5.2% since 2023, whereas lower-tier products lost 1.2%. Seoul’s prime net effective costs climbed 5.7% year-over-year in Q2 2024, the region’s fastest-growing tally. With 70% of Asia Pacific employers now requiring staff on-site at least three days weekly, firms willingly pay premiums for modern layouts, ESG ratings, and proximity to multimodal transit. Vacancy in best-in-class towers stays structurally low, giving landlords pricing power even during slower macro cycles. Investors, therefore, prioritise Grade-A refurbishments and smart-building upgrades to preserve long-term defensibility[1]Min-seok Kim, “National Office Rent Survey Q4 2024,” Korea Real Estate Board, kureb.or.kr.
Increased Investment Flows from REITs and Institutional Capital
Korean and global institutions are increasingly channeling funds into core and core-plus office spaces, marking a swift capital rotation. Due to stabilizing borrowing costs and transparent regulations, South Korea has emerged as a top-three preferred destination in the APAC region. In a strategic move, Brookfield refinanced IFC Seoul for approximately USD 2 billion, effectively recycling the proceeds while maintaining a stake in Grade-A cash flows. With government incentives now covering up to 75% of qualifying capital expenditures for foreign investors, cross-border deal activity has seen a notable uptick. Furthermore, scalable REIT vehicles are broadening the buyer landscape, offering developers lucrative exits and ensuring pension funds enjoy enhanced liquidity.
Expansion by Tech and Financial Sector Firms in Core Submarkets
Seoul's office real estate market continues to demonstrate resilience, driven by the expansion of key sectors. Technology and finance together generated 44% of Seoul’s 2024 Grade-A net absorption, confirming physical space remains critical for regulation, data security, and agile product teams. Hyundai Motor Group’s USD 3.4 billion Global Business Complex will house 9,200 staff across two 55-storey towers by 2026. Meanwhile, foreign banks leverage Seoul Financial Hub incentives to consolidate regional desks near regulators. These occupiers demand large floorplates, redundant power, and smart-office features, supporting persistent leasing momentum across the South Korean office real estate market.
Rising Occupier Demand in Emerging Hubs Like Magok and Yongsan
Seoul’s urban plan distributes growth beyond the traditional CBD, easing congestion and creating innovation clusters. Magok’s R&D campus and Yongsan’s mixed-use zones together add multiple million square feet of new stock tied to life-science and digital-service ecosystems. Lower land costs, express-rail links, and tax incentives promote pre-leasing, particularly from mid-sized tech firms seeking expansion room. This decentralisation mirrors the satellite-district success stories of Singapore’s Jurong and Tokyo’s Shinagawa. As amenities mature, spillover interest lifts Incheon’s fortunes, supporting the South Korea office real estate market beyond core Seoul.
Restraints Impact Analysis*
| Restraint | (~) % Impact on CAGR Forecast | Geographic Relevance | Impact Timeline |
|---|---|---|---|
| Hybrid work trends reducing space absorption across many submarkets | -1.8% | National, most pronounced in Seoul CBD | Medium term (2-4 years) |
| Elevated construction and material costs delaying project pipelines | -1.1% | National, acute in Seoul and Busan | Short term (≤ 2 years) |
| Stricter financing norms following a rise in loan delinquency rates | -0.9% | National, concentrated in secondary markets | Short term (≤ 2 years) |
| Compliance burdens on aging buildings due to tightening energy codes | -0.7% | National, priority enforcement in Seoul Grade-B/C buildings | Long term (≥ 4 years) |
| Source: Mordor Intelligence | |||
Hybrid Work Trends Reducing Space Absorption Across Many Submarkets
The shift to hybrid work models is fundamentally altering office space requirements across various submarkets. As flexible work schedules become the norm, companies are rethinking their office layouts and reducing their space, even with increasing employee counts. Approximately 60% of businesses are maintaining steady attendance but are reducing the average square footage allocated per employee. Projections indicate that major cities might see a decline of 13%–38% in demand compared to pre-pandemic levels by 2030. This highlights a significant shift towards fewer, yet more premium, office locations. As a result, while secondary submarkets in Seoul grapple with tenant turnover, prime towers are witnessing more stable occupancy. In response, landlords are introducing flexible office suites, wellness areas, and tenant-focused technology to bolster occupancy rates.
Elevated Construction and Material Costs Delaying Project Pipelines
The construction sector in Korea is grappling with significant challenges as rising costs and labor shortages disrupt project pipelines. Global commodity spikes and domestic labour shortages lifted Korean build-cost indices 12% in 2024, complicating pro-forma returns for speculative projects. Developers increasingly seek pre-leasing covenants or joint ventures before breaking ground, lengthening delivery timelines. Supply scarcity buttresses rent growth for existing Grade-A stock but risks widening the gap between old and new sustainability standards. Over time, cost inflation may also deter the timely supply of zero-energy compliant space, challenging national decarbonisation targets unless subsidies or modular solutions expand.
*Our forecasts treat driver/restraint impacts as directional, not additive. The impact forecasts reflect baseline growth, mix effects, and variable interactions.
Segment Analysis
By Building Grade: Tenant Flight to Quality Fuels Premium Stock Outperformance
Grade-A assets accounted for 55.01% of 2025 revenue, underscoring their commanding role in the South Korea office real estate market. With multinational and domestic firms flocking to certified towers, vacancies in this premium segment remain scarce. These sought-after towers boast efficient floorplates, air-filtration systems attuned to pandemic needs, and lively retail spaces nearby. The rent disparity is pronounced: major players command prices 84% higher than their non-prime counterparts. Looking ahead, Grade-A inventory is set to grow at a brisk 5.18% CAGR through 2031, outpacing all other grades. Lenders are also taking note, directing capital towards these lower-risk projects. To bolster performance, landlords are integrating IoT building-management systems and securing WELL certifications, ensuring stable cash flows even as the industry navigates hybrid work shifts.
Conversely, Grade-B and Grade-C stock face rising vacancy as occupiers consolidate portfolios. Many mid-rise structures now advance refurbishment plans in order to secure G-SEED accreditation and remain lease-competitive. Government retrofit subsidies covering up to 30% of energy-efficiency improvements further entice owners to upgrade rather than demolish. The widening bifurcation suggests a two-speed future in which best-in-class towers drive headline rent growth and underpin the South Korea office real estate market size, while under-capitalised legacy buildings risk functional obsolescence unless repositioned.



By Transaction Type: Rentals Consolidate Dominance While Sales Serve Portfolio Rotation
Rental agreements captured 76.02% of 2025 deal value, reflecting occupiers’ desire for financial agility during uncertain economic cycles. Institutional investors actively target long-income assets, swelling dry powder available for sale-and-leaseback opportunities. The rental segment’s 5.41% CAGR through 2031 exceeds ownership growth, ensuring it remains the main engine of the South Korea office real estate market. Robust liquidity also stems from the thriving domestic REIT sector, which completed USD 1.6 billion of public offerings in 2024, channelling capital into landmark towers.
Sales transactions, while smaller, enable capital recycling for heavyweight sponsors. Heavyweight sponsors are recycling capital through smaller sales transactions. This unlocked equity can pivot into higher-yield developments or distressed acquisitions. Liberalized foreign-ownership rules, now eliminating preclearance for share purchases in listed vehicles, have accelerated cross-border capital inflow. Consequently, trades in trophy assets are setting benchmark yields, guiding underwriting in South Korea's office real estate sector. These developments highlight the growing attractiveness and competitiveness of the market.
By End Use: Technology Strength Holds as Professional Services Accelerate
Information Technology retained a 30.94% revenue share in 2025, cementing itself as the market’s anchor demand driver. Cloud-service firms, semiconductor designers and e-commerce enablers all seek secure, resilient premises that integrate high-density connectivity and collaboration zones. Hyundai Motor Group’s two-tower complex exemplifies how advanced manufacturing and software R&D converge within modern urban campuses. The sector’s bounded-workforce growth keeps absolute space demand resilient even amid remote-work policies.
Business Consulting & Professional Services, however, is the fastest climber at a 5.62% CAGR to 2031. ESG reporting mandates, cross-border tax planning and digital-transformation advisory needs fuel headcount expansion within global consultancies. These occupiers often require premium client-facing environments close to transport interchanges, intensifying competition for Grade-A floors. Banking, Financial Services and Insurance companies round out demand, clinging to core Seoul locales for proximity to regulators. Together these knowledge-heavy verticals will continue to shape utilisation patterns and reinforce the prominence of Grade-A stock within the South Korea office real estate market.
Geography Analysis
Seoul’s 55.74% share underscores its role as South Korea’s commercial nerve centre, yet its future growth will hinge on balancing CBD densification with satellite-hub activation. The 550 billion KRW (USD 401 million) rivercity plan adds floating office and leisure space along the Han River, unlocking 925.6 billion KRW (USD 675 million). Net effective rents in prime districts rose 5.7% year-over-year in Q2 2024, reflecting healthy leasing pipelines despite global macro jitters. Institutional buyers remain keen, evidenced by Brookfield and IGIS retaining core Seoul exposure while selectively rotating assets.
Incheon’s 5.97% CAGR trajectory is tied to its strategic airport gateway, free-trade incentives, and substantive infrastructure grid. Multinationals seeking regional distribution nodes view Songdo International Business District favourably, benefiting from LEED-certified towers and smart-city amenities. The city’s competitiveness is further enhanced by cost spreads that sit 30% below comparable Seoul submarkets, widening the appeal for secondary headquarters and shared-service centres. Ongoing subway extensions compress travel times to under thirty minutes, effectively broadening the commuter catchment.
Busan consolidates its position as the nation’s maritime and financial hub, catalysed by the multistage Gadeokdo New Airport project slated for 2031 completion. The airport will support 530,000 new jobs and uplift regional GDP, driving incremental office absorption in the adjoining North Port redevelopment zone. Daegu continues to see steady take-up from electronics suppliers and healthcare players that favour its lower rents and central geography, anchoring balanced provincial demand across the wider South Korea office real estate market.
Regulatory Landscape
Regulation affecting office development and operations is tightening around disclosure and project-cycle oversight. In May 2026, amendments to the Act on the Protection of Commercial Building Lease and its Enforcement Decree took effect, requiring landlords to provide tenants a detailed, 14-category breakdown of management fees. This raises compliance needs for owners and property managers and limits opaque pass-through practices.
On the supply and approvals side, the Act on the Management of Real Estate Development Projects and its Enforcement Decree came fully into effect in November 2025. The change shifts oversight toward structured monitoring from pre-approval stages through delivery. In July 2026, the Ministry of Land, Infrastructure and Transport (MOLIT) presented a redevelopment and mixed-use roadmap that highlights streamlined approval procedures, supporting faster execution in dense Seoul submarkets where office delivery is often tied to complex redevelopment packages.
Value Chain Analysis
The office real estate value chain in South Korea runs from land sourcing and entitlements through development (developers, EPC contractors, architects and engineers), financing (banks, insurers, funds and REIT structures), leasing and brokerage (domestic and global agencies), and ongoing operations (property and facility management, energy services, and retrofit contractors). It culminates in capital-market exits via asset sales or share-deal structures. With Grade-A assets taking 55.01% of 2025 revenue, specifications such as ESG certifications, smart-building systems, and resilient MEP packages increasingly influence design, procurement, and leasing outcomes.
Key frictions sit in construction inputs and financing. Materials such as rebar and concrete have faced recurring cost pressure amid exchange-rate and supply-chain volatility, pushing developers toward advance procurement and longer-term supplier contracts. At the same time, tighter project financing conditions elevate the importance of pre-leasing and institutional partners. Policy tools and structures such as project REITs also shape the chain by encouraging longer-hold development models that align developers, capital providers, and operators around stabilized leasing and asset management rather than quick exits.
Competitive Landscape
The South Korea Office Real Estate Market is moderately concentrated. Competition centres on a handful of diversified domestic chaebol affiliates and global fund managers, yet no single entity dominates nationwide. Samsung C&T leverages vertical integration to secure construction savings and flagship tenant relationships, enabling it to command premium rents in landmark towers. Brookfield continues to recycle capital deftly, as shown in its USD 2 billion IFC Seoul refinancing that unlocked fresh dry powder for opportunistic buys. IGIS Asset Management, with USD 47 billion AUM, is rebalancing after marking down overseas portfolios; its contemplated 25% stake sale could invite new strategic partners and recalibrate risk exposure.
Second-tier managers such as Mirae Asset Global Investments and SK D&D diversify by co-developing mixed-use schemes that blend office, retail, and hospitality, mitigating single-cycle risk. International service providers—CBRE, JLL, Colliers, and Savills—invest in proptech platforms, consulting suites, and sustainability expertise to defend advisory share. JLL’s Falcon AI rollout equips 47,000 employees with generative-AI-powered insights, sharpening bid accuracy and lease-renewal negotiations. Smaller flexible-workspace operators pivot into suburban districts to capture hybrid-work overflow, adding competitive nuance but not yet altering core lease economics.
Regulatory trends favour participants that embed ESG compliance early, as the Korea Sustainability Standards Board will mandate corporate reporting from 2026. Players able to furnish green-lease templates and building-performance datasets win faster with multinational tenants. As retrofit demand scales, joint ventures between asset managers and energy-services companies proliferate, reflecting a broader shift toward outcome-based property management across the South Korea office real estate industry.
South Korea Office Real Estate Industry Leaders
Brookfield Asset Management
IGIS Asset Management
Samsung C&T Corporation
Hines
CBRE
- *Disclaimer: Major Players sorted in no particular order

Market Opportunities and Future Outlook
A clear opportunity set is forming around upgrading and operating premium, tech-enabled buildings that meet tighter disclosure and sustainability demands. Smart-building certification and platform deployment are becoming more visible differentiators, including Samsung Electronics Factorial Seongsu receiving a Gold rating under SmartScore in January 2026 and Samsung C&T signing a smart-building platform MOU with Mastern Investment Management in April 2026 to pilot Bynd across commercial assets. These developments support investment in IoT-enabled building management, energy optimization, and tenant-experience upgrades, particularly for Grade-B and Grade-C stock seeking to defend occupancy through retrofit-led repositioning.
Another opportunity is corporate portfolio rotation and transaction structuring that unlocks liquidity for occupiers and owners through sale-and-leasebacks and share deals. In April 2026, President Lee Jae-myung ordered a review of corporate non-business real estate holdings, prompting large groups to accelerate reclassification and disposal procedures. This policy stance can increase deal flow for institutional buyers and REITs seeking stabilized cash flows. At the same time, Seoul submarket dispersion and emerging hubs such as Magok and Yongsan create space for campus-style product with modern floorplates and sustainability credentials, while MOLIT initiatives that streamline approvals and strengthen project governance support developers executing complex mixed-use and redevelopment pipelines.
Recent Industry Developments
- July 2026: IGIS Asset Management was selected as the preferred bidder for the K-Twin Tower, a prime office complex in Seoul's Gwanghwamun district, with an offer reported at about KRW 1.05 trillion. The move reinforces continued price discovery for trophy assets in core Seoul even as financing remains selective, and it signals where institutional capital is concentrating.
- June 2026: Brookfield Asset Management outlined a longer-term plan to expand its assets under management in South Korea to as much as KRW 30 trillion, prioritizing core infrastructure and real estate. The commitment adds visibility to foreign institutional capital allocation into Korea and supports liquidity for large-format office and mixed-use transactions.
- December 2024: Mirae Asset Global Investments acquired the 26-storey Centropolis Tower B in Jongno-gu from Eugene Asset Management for about USD 540 million. The acquisition expanded Mirae's core Seoul office exposure and underscored investor preference for central, institutionally managed Grade-A assets.


Research Methodology Framework and Report Scope
Market Definition and Coverage
For this study, the market covers the value of office real estate activity in South Korea, tracked through office space that is leased or sold for business use and priced in USD for consistency across time.
Scope exclusions: We exclude residential property, retail malls, logistics warehouses, hotels, and industrial land transactions that are not primarily office use.
Segmentation Overview
- By Building Grade
- Grade A
- Grade B
- Grade C
- By Transaction Type
- Rental
- Sales
- By End Use
- Information Technology (IT & ITES)
- BFSI (Banking, Financial Services and Insurance)
- Business Consulting & Professional Services
- Other Services (Retail, Lifesciences, Energy, Legal)
- By Key Cities
- Seoul
- Busan
- Daegu
- Incheon
- Rest of South Korea
Data Sources, Market Sizing, and Validation
Desk Research
To set the boundaries correctly, we first reviewed public real estate and macro datasets that explain how demand for offices forms and how supply gets added over time. Common inputs came from sources such as the Bank of Korea for rate and credit signals, Statistics Korea (KOSTAT) for employment and business counts, and the Ministry of Land, Infrastructure and Transport for transaction and policy context.
We also used sources like the Korea Real Estate Board for market indicators, the Financial Supervisory Service (DART) for listed developer and REIT disclosures, and the Korea Exchange for REIT and capital market references, and then cross-checked with annual reports, investor decks, and reputable local business press. Where needed, paid databases for company financials, news and financials, and patent databases were referenced to validate ownership changes, development pipelines, and retrofit themes that impact Grade A stock. These desk research sources are illustrative, and many other public documents and datasets were also used for data collection and clarification.
Primary Interviews and Surveys
Primary discussions were used to sanity-check the model where public data is lagging, especially on effective rents, incentive intensity, pre-lease behavior, and the share of demand shifting between Grade A and lower grades. We spoke with a mix of landlords, asset managers, brokers, corporate occupiers, and advisors across Seoul and other major cities so our assumptions reflect on-the-ground leasing and investment behavior.
Distribution of primary research fieldwork respondents
| Company type | Respondent position |
|---|---|
| Top tier: 30% | CXOs: 13% |
| Mid tier: 56% | Functional/Unit leaders: 41% |
| Smaller Players: 14% | Managers: 46% |
Market-Sizing & Forecasting
Market sizing was built using a top-down and bottom-up approach, where national office stock and occupied space signals were reconstructed by city and then translated into value using observed rent levels, vacancy patterns, and sales capitalization references. To keep the totals realistic, selective bottom-up checks were added, such as rolling up sampled building level rent ranges by grade and applying them to known stock bands, followed by channel checks with brokers and landlords.
Key inputs that were tracked (illustrative) include Grade A versus non-Grade A inventory additions, vacancy rates by major business district, effective rent movement including incentives, office employment trends in services-heavy industries, and the pace of large relocations or consolidations that can shift absorption. For forecasting, we mainly used scenario analysis, since interest rates, refinancing pressure, and hybrid work adoption can move demand and pricing in different directions by city. When direct observations were missing for smaller cities, we applied proxy relationships from comparable markets, and then re-tested the outputs with interview feedback before finalizing the series.
Data Validation & Update Cycle
Outputs were validated in layers so that one noisy metric does not dominate the final number. We compared the modeled market value with independent signals such as transaction activity, vacancy direction, and headline versus effective rent spreads, and then investigated any sharp jumps that did not match known supply events or policy changes.
Before sign-off, results go through analyst reviews that re-check the key assumptions, rerun currency conversions, and re-contact a few participants if variance stays high in a city or grade bucket. The report is refreshed annually, and interim updates are made when material events occur, such as rate shocks, major policy announcements, or unusually large office deal cycles. Right before delivery, a final review pass is done so clients receive the latest updated view.
Mordor Intelligence's South Korea Office Real Estate Market Size Compared Against Other Published Estimates
Published market values for office real estate in South Korea can look far apart because the underlying question is often different, even when the titles sound similar. The biggest differences usually come from what is counted (leasing value versus investment transactions), whether the focus is only Seoul or the full country, and how building grades and incentive adjusted rents are treated.
The main gap comes from mixing investment deal volume with market value, where Mordor Intelligence counts the office real estate market through the ongoing leasing and sales value across key cities and office grades instead of treating annual transaction turnover as the market size.
Benchmark comparison
| Source | Market Size | Gaps in Research Methodology |
|---|---|---|
| Mordor Intelligence | USD 27.32 B (2025) | |
| Property Services Bulletin A | USD 9.84 B (2024) | Uses annual office investment transaction volume as the size proxy, which excludes non-traded stock and can swing sharply with a few large deals and interest rate timing. |
| Industry Data Note B | USD 18.10 B (2025) | Limits coverage mainly to prime Seoul districts and applies headline rent assumptions without consistently adjusting for incentives, vacancy, and grade mix outside core submarkets. |
In practical terms, the spread across sources is mostly explained by whether the estimate is measuring a flow of deals in a single year or the broader value connected to occupied stock and pricing across the country. By keeping the inputs tied to stock, vacancy, effective rents, and city coverage, our estimate stays traceable to observable market signals and is easier to replicate when assumptions are updated.


Key Questions Answered in the Report
What is the current size of the South Korea office real estate market?
The market stands at USD 28.61 billion in 2026 and is on track to reach USD 36.06 billion by 2031.
Which building grade captures the largest market share?
Grade-A offices command 55.01% of 2025 revenue, reflecting strong tenant preference for certified premium space.
Which city will grow the fastest through 2031?
Incheon leads with a projected 5.97% CAGR, driven by its airport hub and free-economic-zone status.
How are hybrid work trends affecting demand?
Companies are consolidating into fewer, higher-quality locations, reducing space absorption in secondary submarkets while keeping prime vacancies tight.
What role do REITs play in the sector’s capital flows?
Domestic and cross-border REITs provide deep liquidity, accelerate portfolio recycling and support the rental segment’s 5.41% CAGR outlook.
How significant are ESG regulations for office landlords?
Mandatory zero-energy standards by 2031 and sustainability reporting from 2026 make ESG upgrades crucial for retaining tenants and safeguarding asset values.
Page last updated on:


 Your data is secure and never sold or shared.


