Market Overview
| Study Period | 2017 - 2030 |
|---|---|
| Forecast Data Period | 2025 - 2030 |
| Historical Data Period | 2017 - 2023 |
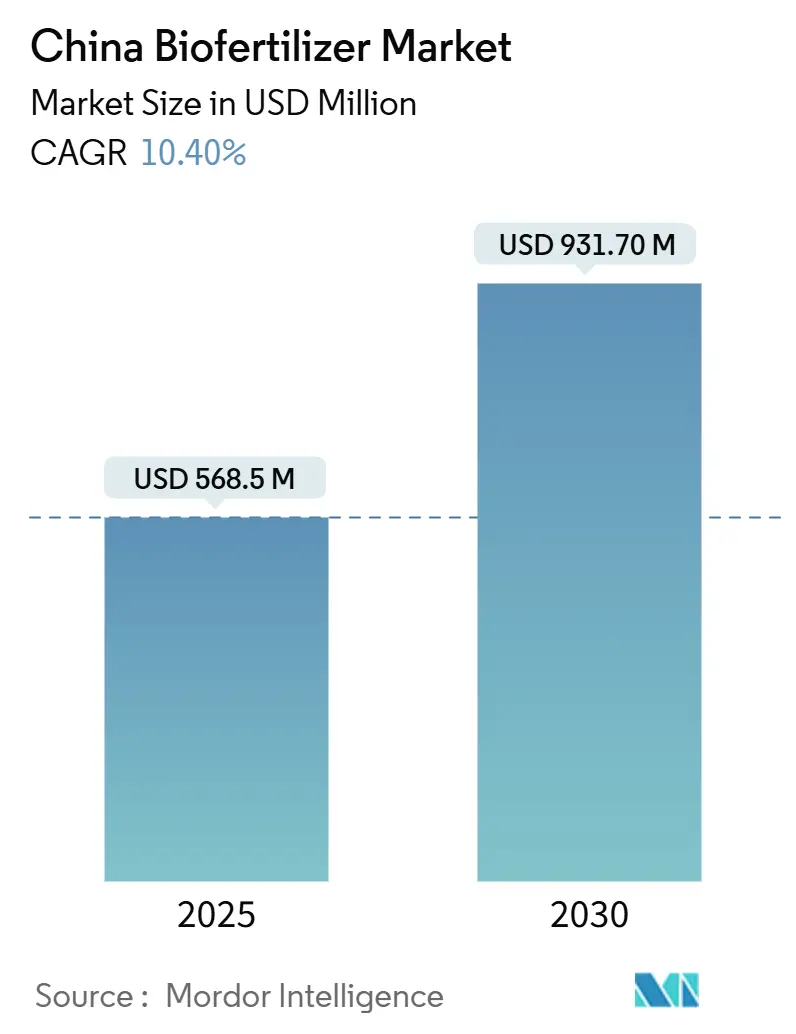
| Market Size (2025) | USD 568.5 Million |
| Market Size (2030) | USD 931.70 Million |
| Growth Rate (2025 - 2030) | 10.40% CAGR |
| Market Concentration | Low |
Major Players *Disclaimer: Major Players sorted in no particular order Image © Mordor Intelligence. Reuse requires attribution under CC BY 4.0. | |
China Biofertilizer Market Analysis by Mordor Intelligence
The China biofertilizer market size stands at USD 568.5 million in 2025 and is forecast to reach USD 931.7 million by 2030 at a 10.4% CAGR, confirming robust momentum in sustainable input adoption. Rapid policy support, expanding organic acreage, and carbon-neutrality targets position biofertilizers as a core pillar of agricultural modernization. Government subsidies narrow the price gap with synthetics, while consumer demand for residue-free food tightens supply-chain specifications. Digital platforms ease rural distribution, and microbial innovation clusters compress product-development cycles. Together, these forces reinforce the growth trajectory for the China biofertilizer market.
Key Report Takeaways
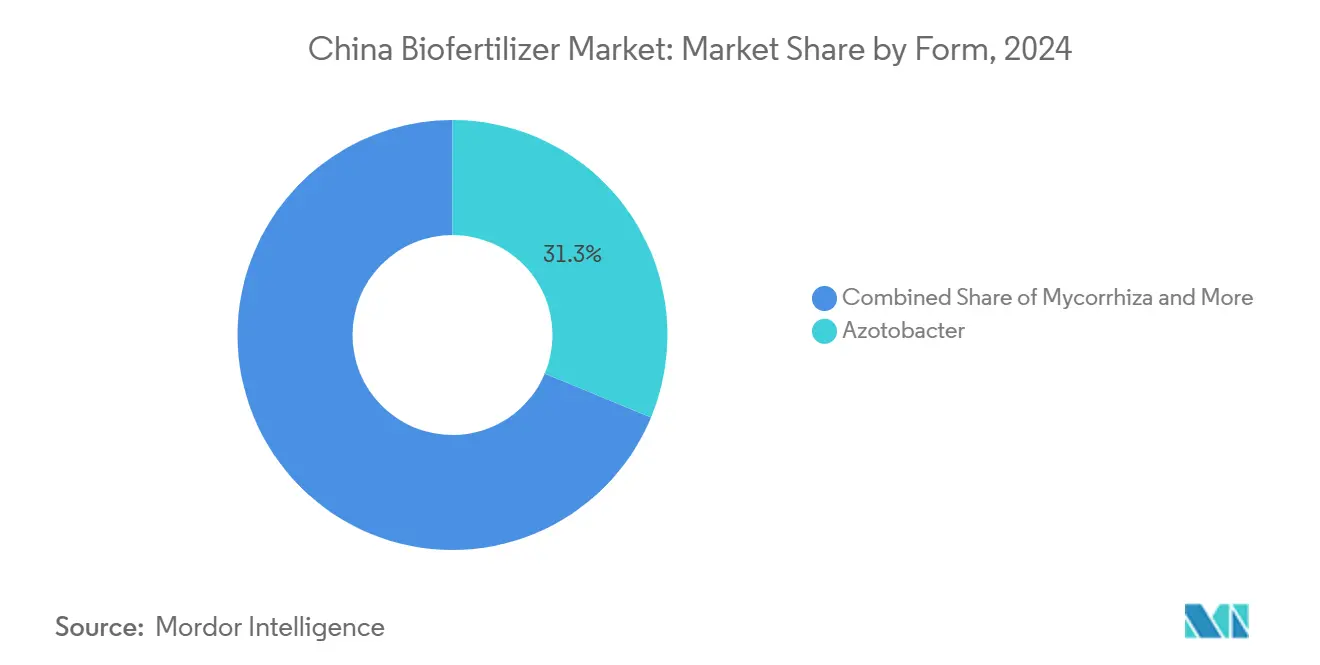
- By form, Azotobacter led with 31.30% of the China biofertilizer market share in 2024, while Rhizobium posted the highest projected growth at an 11.70% CAGR through 2030.
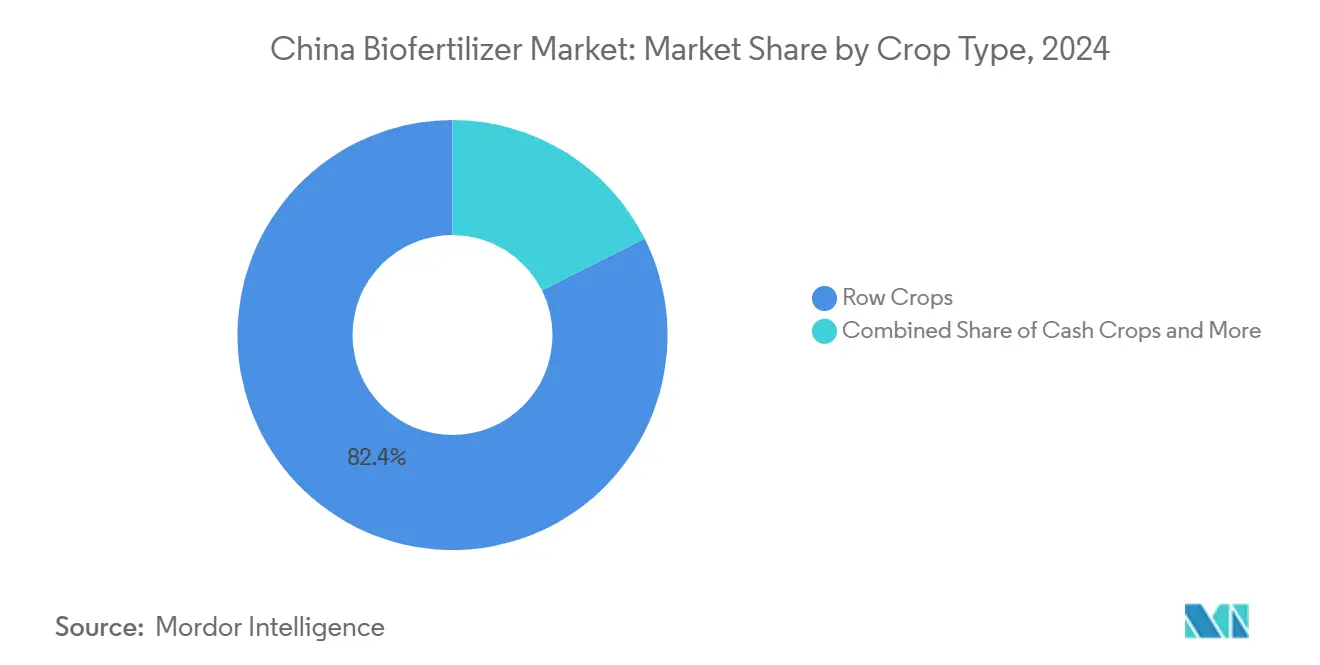
- By crop type, row crops accounted for 82.40% of the China biofertilizer market size in 2024, whereas cash crops are forecast to expand at a 10.67% CAGR between 2025 and 2030.
- The China biofertilizer market remains fragmented, with the top five players together constituting nearly 4%, leaving headroom for consolidation.
China Biofertilizer Market Trends and Insights
Drivers Impact Analysis*
| Driver | (~) % Impact on CAGR Forecast | Geographic Relevance | Impact Timeline |
|---|---|---|---|
| Government subsidies for organic inputs | +2.1% | Shandong, Jiangsu, Henan | Medium term (2-4 years) |
| Rising consumer demand for residue-free produce | +1.8% | Eastern coastal provinces | Short term (≤ 2 years) |
| Soil degradation mandates sustainable practices | +1.5% | North China Plain and Northeast | Long term (≥ 4 years) |
| Carbon-neutrality targets favor low-carbon inputs | +1.4% | National pilots in developed provinces | Long term (≥ 4 years) |
| E-commerce ag-input platforms widen reach | +1.2% | Eastern and central regions | Short term (≤ 2 years) |
| Microbial innovation clusters spur commercialization | +0.8% | Yangtze River Delta, Shandong, Beijing-Tianjin-Hebei | Medium term (2-4 years) |
| Source: Mordor Intelligence | |||
Government Subsidies for Organic Inputs Drive Market Expansion
Provincial programs covering 20%–30% of qualified product costs reduce adoption barriers and accelerate order volumes, especially in Shandong and Jiangsu[1]Source: Heilongjiang Provincial Department of Agriculture and Rural Affairs, “2024 Fertilizer Registration Approvals,” hlj.gov.cn. Training sessions and demonstration plots amplify awareness, so the China biofertilizer market quickly responds to subsidy signals. Faster product approvals, 45 new registrations issued in Heilongjiang during early 2024, underscore administrative alignment with financial incentives. The economic impact compounds because subsidies shrink the pricing gap relative to chemical fertilizers, driving volume growth and repeat purchases.
Rising Consumer Demand for Residue-Free Produce Reshapes Supply Chains
Urban consumers willing to pay premiums for residue-free fruits and vegetables reshape procurement contracts, compelling farmers to adopt certified biofertilizers. E-commerce platforms publicize certification data in real time, allowing growers to capture direct-to-consumer price premiums. Digital literacy boosts adoption by 6.5% and improves information efficacy by 19.1% among vegetable growers in six provinces. The China biofertilizer market, therefore, benefits from a pull-through effect driven by retail quality requirements.
Soil Degradation Concerns Mandate Sustainable Agriculture Transition
A meta-analysis of 107 field trials shows biofertilizers raise soil organic matter by 16.64% and beneficial microbes by more than 150%. Provinces on the North China Plain now integrate biofertilizers into soil-testing subsidy programs. Farmers view microbial products as a hedge against long-term land-value erosion. As chemical fertilizer dependence moderates, the China biofertilizer market gains a structural demand floor that aligns with national soil health metrics.
Carbon-Neutrality Targets Accelerate Low-Carbon Input Adoption
Biofertilizers carry a smaller carbon footprint than urea or ammonium nitrate, so provincial carbon-credit pilots reward farmers who document usage[2]Source: State Council of China, “Future Industry Development in Yangtze River Delta,” gov.cn. Changzhou’s synthetic biology fund of CNY 2 billion (USD 278 million) finances microbial research and development aligned with the 2060 carbon-neutrality roadmap. This collaboration between climate policy and input choices anchors future growth in the China biofertilizer market.
Restraints Impact Analysis*
| Restraint | (~) % Impact on CAGR Forecast | Geographic Relevance | Impact Timeline |
|---|---|---|---|
| Limited shelf life and temperature sensitivity | -1.3% | National, acute in western and southern regions | Short term (≤ 2 years) |
| Low farmer awareness and inconsistent efficacy | -1.1% | Less developed provinces | Medium term (2-4 years) |
| Fragmented regulatory approval processes | -0.8% | Nationwide | Medium term (2-4 years) |
| Cold-chain logistics gaps in western provinces | -0.6% | Xinjiang, Gansu, Qinghai, and Tibet | Long term (≥ 4 years) |
| Source: Mordor Intelligence | |||
Limited Shelf Life and Temperature Sensitivity Constrain Expansion
Most liquid formulations remain viable for only six months, and ambient transport in summer can slash microbial counts below efficacy thresholds[3]Source: National Digital Standard Repository, “NY/T 3833-2021 Microbial Fertilizer Preservation,” ndls.org.cn. Solid carriers made from spent mushroom substrate improve stability yet raise costs. The national NY/T 3833-2021 standard stipulates preservation parameters, but adherence varies by manufacturer. Until cold-chain coverage widens, this issue will temper the growth of the China biofertilizer market in heat-prone geographies.
Low Farmer Awareness and Inconsistent Efficacy Limit Adoption Rates
Knowledge gaps among farmers regarding proper biofertilizer application and realistic performance expectations create significant barriers to market expansion, particularly in regions with limited agricultural extension services. Public extension services raise scientific fertilization adoption, but coverage is uneven, especially in interior provinces. Field-trial data irregularities have occasionally eroded trust, leading some growers to revert to synthetic inputs. Consistent agronomic guidance is thus essential for expanding the China biofertilizer market.
*Our forecasts treat driver/restraint impacts as directional, not additive. The impact forecasts reflect baseline growth, mix effects, and variable interactions.
Segment Analysis
By Form: Nitrogen-Fixing Leaders Maintain Volume Advantage
Azotobacter held 31.30% of China biofertilizer market share in 2024 due to its proven nitrogen-fixing performance in staple grains. The segment benefits from cost-effective fermentation and wide agronomic recommendations. Meanwhile, Rhizobium is projected to expand at an 11.70% CAGR as legume rotations rise in government soil-health programs. Mycorrhiza gains traction in fruit and vegetable systems where phosphorus uptake and drought tolerance drive premium use cases. Phosphate-solubilizing bacteria find niche demand in acidified southern soils, and multi-strain consortia emerge as next-gen solutions that satisfy both nutrient and biostimulant roles.
Sustained research and development under NY/T 798 ensures quality consistency across forms, yet implementation gaps cause variable field performance. Bacterial products offer shelf-life advantages, while fungal lines deliver higher yield boosts but face storage hurdles. Investment in encapsulation technologies promises to reconcile efficacy with stability, supporting broader penetration of each form within the China biofertilizer market.


By Crop Type: Volume Versus Value Shapes Demand Patterns
Row crops dominated 82.40% of the China biofertilizer market size in 2024, propelled by the sheer area of rice, wheat, and corn. Cost-sensitive grain farmers accept Azotobacter and mixed inoculants once subsidies offset premiums. Cash crops, led by cotton in Xinjiang and specialty horticulture in southern provinces, are set to grow at a 10.67% CAGR through 2030 as export certification and quality differentiation reward biological inputs. Field research in semi-arid zones shows bacterium fertilizer lifting soybean yields by 78.97% and water-use efficiency by 75%, validating investments in higher-value systems.
Horticultural producers integrate mycorrhiza and biotin-triggered soil microbiomes to boost stress tolerance in vegetables like Chinese cabbage, aligning with premium retail channels. These segmentation dynamics suggest that volume will remain anchored in cereals, yet profit pools will migrate toward high-margin cash and horticultural crops, reinforcing diversified strategies across the China biofertilizer market.
Geography Analysis
Eastern provinces account for the largest portion of the China biofertilizer market, with Shandong, Jiangsu, and Zhejiang combining advanced biotechnology clusters, robust cold-chain networks, and high farmer education levels. Shandong alone hosts more than 10,000 enterprises, creating dense supply ecosystems that drive scale efficiencies. The Yangtze River Delta records the fastest growth, supported by a synthetic biology fund of CNY 2 billion (USD 278 million) and a target of CNY 10 billion (USD 1.39 billion) in bioeconomy revenues by 2028.
Central provinces such as Henan, Hubei, and Hunan display rising adoption as rice and wheat modernization programs integrate microbial inputs. Extension services significantly boost scientific fertilization rates, yet distribution infrastructure still lags coastal benchmarks. Western regions, including Xinjiang and Gansu, possess strong cotton and specialty-crop potential but remain constrained by cold-chain gaps. Manufacturers often ship stable solid formulations to mitigate spoilage, although profit margins narrow under higher logistics costs.
Northeastern grain belts of Heilongjiang, Jilin, and Liaoning offer unique partnerships with fermentation by-product streams. Zhaodong’s corn bio-fermentation base recorded CNY 5.57 billion (USD 774 million) in 2023 output, signaling feedstock availability for scaled microbial production. Cold winters necessitate strain specificity, yet mechanized farms invest in precision application that enhances uptake efficiency. These regional nuances collectively influence channel strategies and capacity placement across the China biofertilizer market.
Competitive Landscape
The China biofertilizer market remains fragmented: the top five suppliers hold only a minor share, leaving headroom for consolidation. Shandong Sukahan Bio-Technology Co., Ltd, Kiwa Bio-Tech, and Genliduo Bio-Tech leverage fermentation scale and patent portfolios to defend positions in the cost-sensitive row-crop sector. Beijing Leili Marine differentiates through marine-derived inoculants that command premiums in high-value fruit systems.
Technology leadership drives competitive edges. Over 80% of global bio-input patents filed since 2000 originate in China, creating formidable intellectual-property barriers for entrants. Players invest in encapsulation and solid-carrier innovations to extend shelf life, a critical determinant of channel reach. Distribution alliances with e-commerce platforms enable direct sales that undercut conventional wholesalers, yet quality assurance remains vital, as recent counterfeit crackdowns illustrate.
Mergers and partnerships appear inevitable as firms seek nationwide logistics presence and regulatory compliance scale. Companies with robust cold-chain footprints in the East are scouting joint ventures in Xinjiang to access emerging cotton demand. Synthetic biology start-ups backed by regional funds introduce engineered consortia with multi-pathway nutrient release, challenging incumbents to elevate R&D agility. This evolving competitive matrix underscores the dynamic nature of the China biofertilizer market.
China Biofertilizer Industry Leaders
Genliduo Bio-tech Corporation Ltd
Biolchim SpA (Huber AgroSolutions)
Novonesis
Kiwa Bio-Tech Products Group Corp.
Shandong Sukahan Bio-Technology Co., Ltd
- *Disclaimer: Major Players sorted in no particular order


Recent Industry Developments
- November 2024: The Ministry of Agriculture and Rural Affairs introduced electronic fertilizer registration certificates, cutting paper paperwork and accelerating biofertilizer product approval.
- January 2024: Novozymes and Chr. Hansen merged to establish Novonesis, a biosolutions company operating in more than 30 countries, including China. The merged entity focuses on advancing sustainable agriculture innovations, particularly biofertilizers, which aligns with China's emphasis on environmentally friendly agricultural inputs and microbial solutions.


China Biofertilizer Market Report Scope
Azospirillum, Azotobacter, Mycorrhiza, Phosphate Solubilizing Bacteria, Rhizobium are covered as segments by Form. Cash Crops, Horticultural Crops, Row Crops are covered as segments by Crop Type.Form
| Azospirillum |
| Azotobacter |
| Mycorrhiza |
| Phosphate Solubilizing Bacteria |
| Rhizobium |
| Other Biofertilizers |
Crop Type
| Cash Crops |
| Horticultural Crops |
| Row Crops |
| Form | Azospirillum |
| Azotobacter | |
| Mycorrhiza | |
| Phosphate Solubilizing Bacteria | |
| Rhizobium | |
| Other Biofertilizers | |
| Crop Type | Cash Crops |
| Horticultural Crops | |
| Row Crops |


Market Definition
- AVERAGE DOSAGE RATE - The average application rate is the average volume of biofertilizers applied per hectare of farmland in the respective region/country.
- CROP TYPE - Crop type includes Row crops (Cereals, Pulses, Oilseeds), Horticultural Crops (Fruits and vegetables) and Cash Crops (Plantation Crops, Fibre Crops and Other Industrial Crops)
- FUNCTION - The crop nutrition function of agricultural biological consists of various products that provide essential plant nutrients and enhance soil quality.
- TYPE - Biofertilizers enhance soil quality by increasing the population of beneficial microorganisms. They help crops absorb nutrients from the environment.
| Keyword | Definition |
|---|---|
| Cash Crops | Cash crops are non-consumable crops sold as a whole or part of the crop to manufacture end-products to make a profit. |
| Integrated Pest Management (IPM) | IPM is an environment-friendly and sustainable approach to control pests in various crops. It involves a combination of methods, including biological controls, cultural practices, and selective use of pesticides. |
| Bacterial biocontrol agents | Bacteria used to control pests and diseases in crops. They work by producing toxins harmful to the target pests or competing with them for nutrients and space in the growing environment. Some examples of commonly used bacterial biocontrol agents include Bacillus thuringiensis (Bt), Pseudomonas fluorescens, and Streptomyces spp. |
| Plant Protection Product (PPP) | A plant protection product is a formulation applied to crops to protect from pests, such as weeds, diseases, or insects. They contain one or more active substances with other co-formulants such as solvents, carriers, inert material, wetting agents or adjuvants formulated to give optimum product efficacy. |
| Pathogen | A pathogen is an organism causing disease to its host, with the severity of the disease symptoms. |
| Parasitoids | Parasitoids are insects that lay their eggs on or within the host insect, with their larvae feeding on the host insect. In agriculture, parasitoids can be used as a form of biological pest control, as they help to control pest damage to crops and decrease the need for chemical pesticides. |
| Entomopathogenic Nematodes (EPN) | Entomopathogenic nematodes are parasitic roundworms that infect and kill pests by releasing bacteria from their gut. Entomopathogenic nematodes are a form of biocontrol agents used in agriculture. |
| Vesicular-arbuscular mycorrhiza (VAM) | VAM fungi are mycorrhizal species of fungus. They live in the roots of different higher-order plants. They develop a symbiotic relationship with the plants in the roots of these plants. |
| Fungal biocontrol agents | Fungal biocontrol agents are the beneficial fungi that control plant pests and diseases. They are an alternative to chemical pesticides. They infect and kill the pests or compete with pathogenic fungi for nutrients and space. |
| Biofertilizers | Biofertilizers contain beneficial microorganisms that enhance soil fertility and promote plant growth. |
| Biopesticides | Biopesticides are natural/bio-based compounds used to manage agricultural pests using specific biological effects. |
| Predators | Predators in agriculture are the organisms that feed on pests and help control pest damage to the crops. Some common predator species used in agriculture include ladybugs, lacewings, and predatory mites. |
| Biocontrol agents | Biocontrol agents are living organisms used to control pests and diseases in agriculture. They are alternatives to chemical pesticides and are known for their lesser impact on the environment and human health. |
| Organic Fertilizers | Organic fertilizer is composed of animal or vegetable matter used alone or in combination with one or more non-synthetically derived elements or compounds used for soil fertility and plant growth. |
| Protein hydrolysates (PHs) | Protein hydrolysate-based biostimulants contain free amino acids, oligopeptides, and polypeptides produced by enzymatic or chemical hydrolysis of proteins, primarily from vegetal or animal sources. |
| Biostimulants/Plant Growth Regulators (PGR) | Biostimulants/Plant Growth Regulators (PGR) are substances derived from natural resources to enhance plant growth and health by stimulating plant processes (metabolism). |
| Soil Amendments | Soil Amendments are substances applied to soil that improve soil health, such as soil fertility and soil structure. |
| Seaweed Extract | Seaweed extracts are rich in micro and macronutrients, proteins, polysaccharides, polyphenols, phytohormones, and osmolytes. These substances boost seed germination and crop establishment, total plant growth and productivity. |
| Compounds related to biocontrol and/or promoting growth (CRBPG) | Compounds related to biocontrol or promoting growth (CRBPG) are the ability of a bacteria to produce compounds for phytopathogen biocontrol and plant growth promotion. |
| Symbiotic Nitrogen-Fixing Bacteria | Symbiotic nitrogen-fixing bacteria such as Rhizobium obtain food and shelter from the host, and in return, they help by providing fixed nitrogen to the plants. |
| Nitrogen Fixation | Nitrogen fixation is a chemical process in soil which converts molecular nitrogen into ammonia or related nitrogenous compounds. |
| ARS (Agricultural Research Service) | ARS is the U.S. Department of Agriculture's chief scientific in-house research agency. It aims to find solutions to agricultural problems faced by the farmers in the country. |
| Phytosanitary Regulations | Phytosanitary regulations imposed by the respective government bodies check or prohibit the importation and marketing of certain insects, plant species, or products of these plants to prevent the introduction or spread of new plant pests or pathogens. |
| Ectomycorrhizae (ECM) | Ectomycorrhiza (ECM) is a symbiotic interaction of fungi with the feeder roots of higher plants in which both the plant and the fungi benefit through the association for survival. |


Research Methodology
Mordor Intelligence follows a four-step methodology in all our reports.
- Step-1: Identify Key Variables: In order to build a robust forecasting methodology, the variables and factors identified in Step-1 are tested against available historical market numbers. Through an iterative process, the variables required for market forecast are set and the model is built on the basis of these variables.
- Step-2: Build a Market Model: Market-size estimations for the forecast years are in nominal terms. Inflation is not a part of the pricing, and the average selling price (ASP) is kept constant throughout the forecast period.
- Step-3: Validate and Finalize: In this important step, all market numbers, variables and analyst calls are validated through an extensive network of primary research experts from the market studied. The respondents are selected across levels and functions to generate a holistic picture of the market studied.
- Step-4: Research Outputs: Syndicated Reports, Custom Consulting Assignments, Databases & Subscription Platforms.


