Chemical Injection Skids Market Size and Share
Market Overview
| Study Period | 2020 - 2031 |
|---|---|
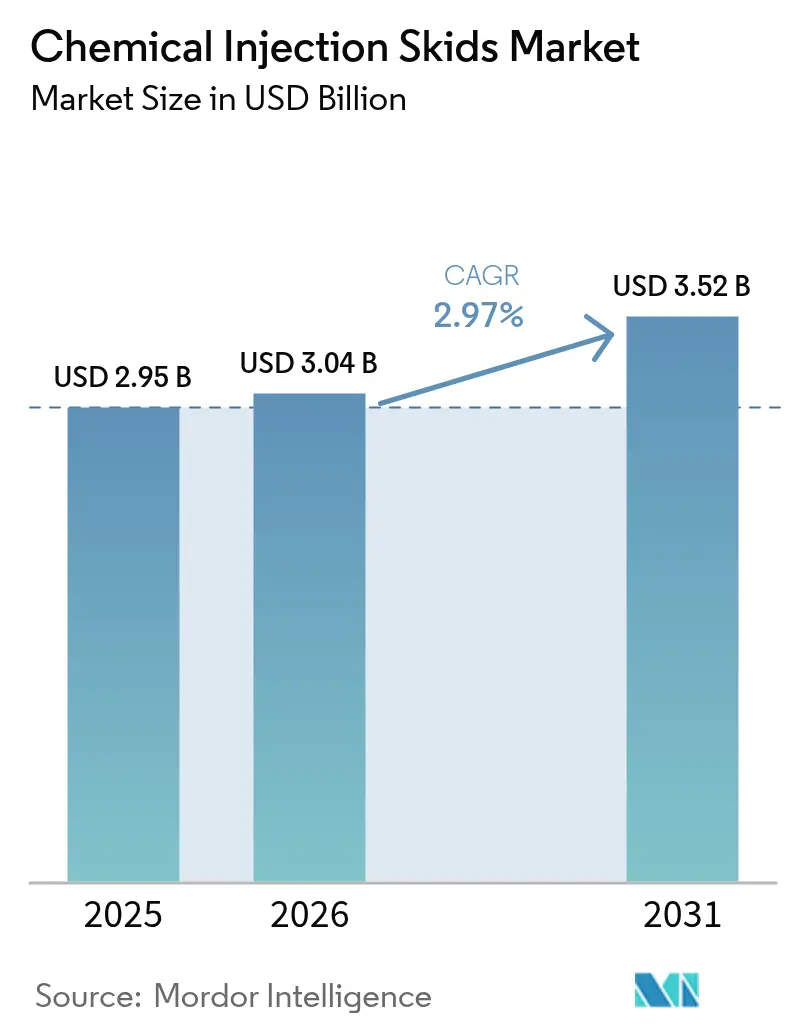
| Market Size (2026) | USD 3.04 Billion |
| Market Size (2031) | USD 3.52 Billion |
| Growth Rate (2026 - 2031) | 2.97% CAGR |
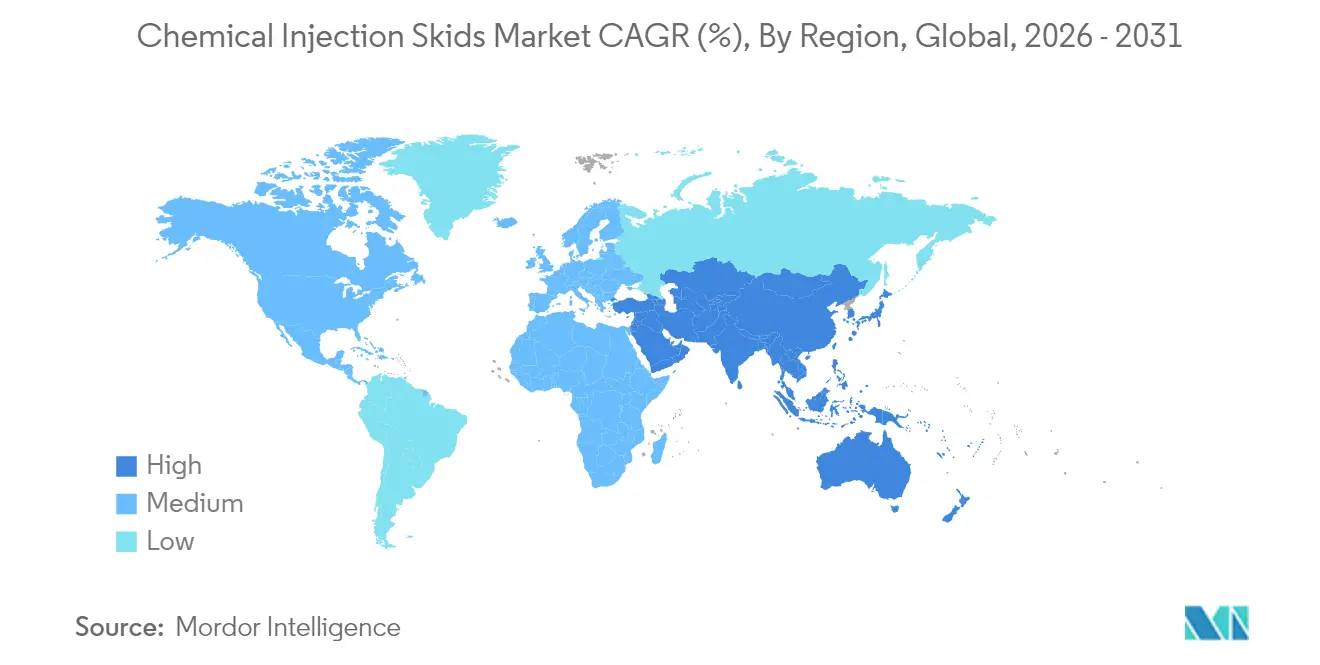
| Fastest Growing Market | Asia Pacific |
| Largest Market | Europe |
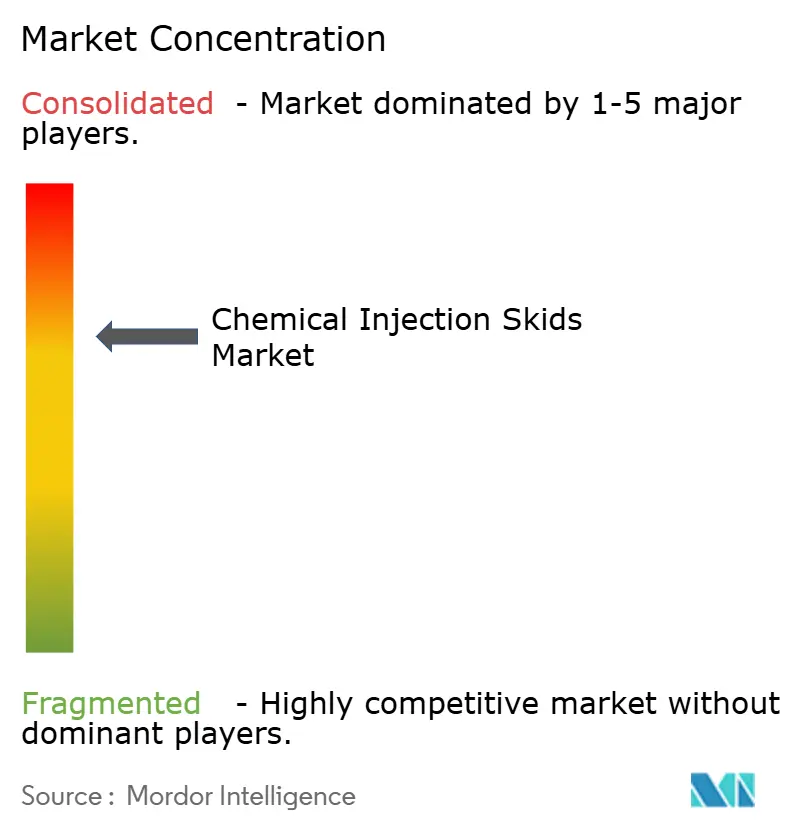
| Market Concentration | Medium |
Major Players *Disclaimer: Major Players sorted in no particular order Image © Mordor Intelligence. Reuse requires attribution under CC BY 4.0. | |
Chemical Injection Skids Market Analysis by Mordor Intelligence
The chemical injection skids market size in 2026 is estimated at USD 3.04 billion, growing from 2025 value of USD 2.95 billion with 2031 projections showing USD 3.52 billion, growing at 2.97% CAGR over 2026-2031. Steady growth is anchored in the expansion of downstream petrochemical complexes, tougher discharge regulations, and the need for reliable flow assurance across oil-and-gas operations[1]Endress+Hauser, “Solutions for chemical injection,” endress.com. Operators view precision-dosing skids as insurance against unplanned shutdowns caused by scaling, corrosion, or microbial fouling. Investment momentum is reinforced as water-treatment plants adopt automation to meet nutrient-removal rules that carry financial penalties for non-compliance. Europe continues to purchase high-specification equipment to satisfy the EU’s Fit-for-55 goals, while Asia-Pacific accelerates orders for large multi-feed packages alongside new ethylene, ammonia, and PTA capacity. Moderate consolidation among pump specialists and system integrators signals a maturity phase in which service reliability, materials engineering, and digital monitoring differentiate suppliers.
Key Report Takeaways
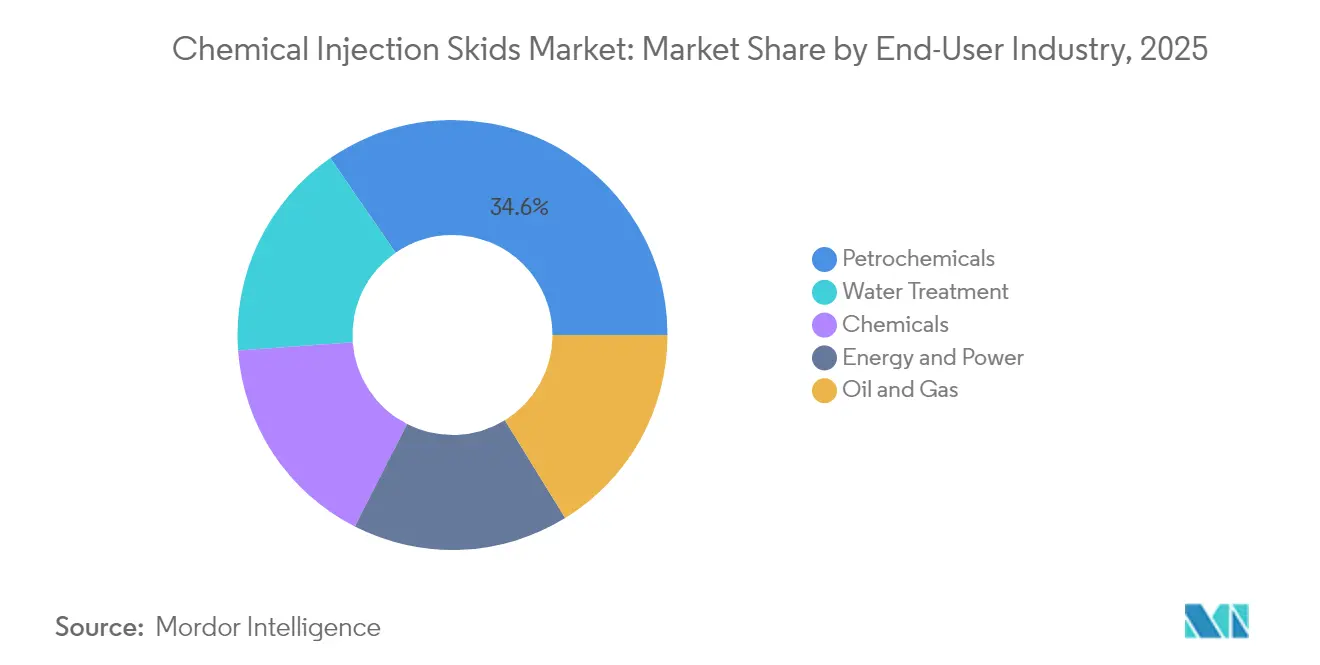
- By end-user, the petrochemicals segment led with 34.62% revenue share in 2025, while the water and wastewater segment is projected to grow at a 3.70% CAGR through 2031.
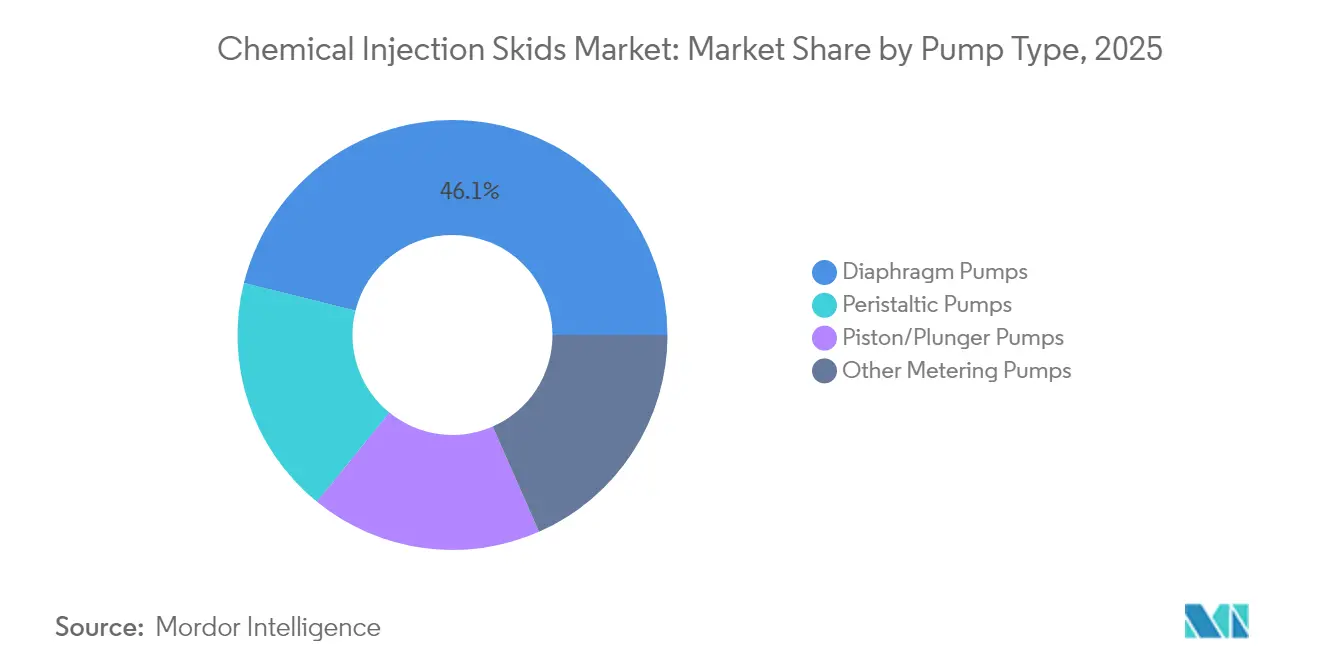
- By pump type, diaphragm pumps captured 46.12% of the chemical injection skids market share in 2025; peristaltic pumps show the highest projected CAGR at 3.58% to 2031.
- By geography, Europe accounted for 28.10% revenue in 2025, whereas Asia-Pacific is forecast to expand at a 3.28% CAGR through 2031.
Note: Market size and forecast figures in this report are generated using Mordor Intelligence’s proprietary estimation framework, updated with the latest available data and insights as of 2026.
Global Chemical Injection Skids Market Trends and Insights
Drivers Impact Analysis*
| Driver | (~) % Impact on CAGR Forecast | Geographic Relevance | Impact Timeline |
|---|---|---|---|
| Rapid growth in downstream petrochemical capacity additions | +0.80% | Asia-Pacific core, spill-over to Middle East | Medium term (2-4 years) |
| Accelerating demand from water treatment applications | +0.60% | Global, with concentration in North America & EU | Short term (≤ 2 years) |
| Stricter environmental discharge norms | +0.50% | Global, led by EU and North America | Long term (≥ 4 years) |
| Increasing usage for corrosion and scale inhibition application | +0.40% | Global, particularly offshore and high-temperature applications | Medium term (2-4 years) |
| Rising use of green chemicals requiring multi-feed skid designs | +0.30% | EU and North America, expanding to Asia-Pacific | Long term (≥ 4 years) |
| Source: Mordor Intelligence | |||
Rapid Growth in Downstream Petrochemical Capacity Additions
Mega-projects such as China's USD 20 billion Shandong complex require hundreds of dedicated dosing points for corrosion inhibition, antioxidant injection, and catalyst quenching. System suppliers respond by scaling fabrication lines: Advanced Precision Industrial Services lifted annual skid output 500% at its Saudi plant to meet Middle-East EPC backlogs. New crackers demand tighter flow-control tolerances than drilling or production operations, turning chemical injection skids from optional accessories into critical path equipment. Each additional ethylene train creates a multiplier effect because polymer, aromatics, and utilities islands all mandate separate dosing loops. The downstream build-out produces durable, project-linked demand that buffers the chemical injection skids market from oil price volatility.
Accelerating Demand from Water Treatment Applications
Municipalities now deploy multiple polymers, coagulants, and odor-control blends in a single process train; this complexity pushes operators toward fully automated, multi-chemical skids that integrate high-viscosity polymer pumps with gravimetric feeders. Accurate dosing trims chemical overuse penalties and reduces sludge-handling costs, bringing a two-year average payback in North American plants. Industrial users echo the trend as specialty-chemical producers face strict chloride, phosphate, and COD limits before discharging to sewers. Equipment vendors expand portfolios through M&A: Ingersoll Rand’s purchase of SSI Aeration adds diffused-air expertise that complements its metering-pump line for complete water packages. Such shifts keep the chemical injection skids market vibrant even when traditional oil-and-gas orders soften.
Stricter Environmental Discharge Norms
The EU toxic-free-environment roadmap obliges facilities to transition toward bio-based corrosion inhibitors and antiscalants, many of which possess different density and shear-sensitivity profiles[2]Chemical Industry Journal, “EU toxic-free initiative impact,” chemicalindustryjournal.co.uk. Skids, therefore, incorporate dual-material wetted parts plus inline density-compensation meters to assure accuracy despite fluid variability. Integrated data-loggers feed emissions audits directly, converting dosing packages into compliance platforms that mitigate potential multi-million-euro fines. Similar rules are advancing in Canada, Japan, and South Korea, signaling a persistent long-term pull for advanced systems.
Increasing Usage for Corrosion and Scale Inhibition Application
Offshore FPSOs pump produced water containing high levels of CO₂ and H₂S, accelerating corrosion under-deposit; specialist systems from LEWA deliver inhibitors at pressures above 900 bar while occupying minimal deck space[3]LEWA GmbH, “High-pressure metering pumps for offshore,” lewa.com. New solid-inhibitor chemistries trigger at reservoir temperature and could reduce daily consumption rates, yet they still rely on batch-injection skids for placement and boosting. Phosphonate-based scale inhibitors tolerate 200 °C service, carving a niche for plunger pumps with ceramic plungers that resist thermal shock. The interplay of advanced chemistry and extreme duty requirements drives continuous engineering upgrades, enhancing replacement demand.
Restraints Impact Analysis*
| Restraint | (~) % Impact on CAGR Forecast | Geographic Relevance | Impact Timeline |
|---|---|---|---|
| High initial cost of investment | -0.40% | Global, particularly impacting smaller operators | Short term (≤ 2 years) |
| Skilled-labor shortage for skid fabrication & maintenance | -0.30% | North America and Europe primarily | Medium term (2-4 years) |
| Volatility in raw material prices | -0.20% | Global, with acute impact in Asia-Pacific manufacturing hubs | Short term (≤ 2 years) |
| Source: Mordor Intelligence | |||
High Initial Cost of Investment
Capital outlays for integrated chemical injection stations on an enhanced-oil-recovery test can top USD 15 million, a barrier that pushes independents toward manual drum-feed techniques during price downturns. The entry hurdle persists because sophisticated skids bundle explosion-proof motors, seal-less metering pumps, PLCs, and redundant instrumentation. Added spend on commissioning and training can double the invoice value, delaying payback for mid-tier operators. Vendors respond with rental fleets and performance-based leasing plans, yet adoption remains cautious in cash-constrained segments.
Skilled-Labor Shortage for Skid Fabrication & Maintenance
Germany’s chemical workforce hit 479,500 in 2025, its highest in 25 years, yet component fabricators still flag shortages of certified welders and controls technicians. Mature technicians retire faster than apprentices gain competency, stretching delivery lead times to 40 weeks on complex high-pressure units. Offshore customers face service bottlenecks because qualified pump specialists command premium wages and are unwilling to accept extended rotations. The labor gap encourages simplified modular designs but simultaneously curbs growth in ultra-high-specification packages, clipping the chemical injection skids market trajectory.
*Our forecasts treat driver/restraint impacts as directional, not additive. The impact forecasts reflect baseline growth, mix effects, and variable interactions.
Segment Analysis
By End-User Industry: Petrochemicals Lead Despite Water Treatment Acceleration
The petrochemical sector held 34.62% of the chemical injection skids market share in 2025, underpinned by distributed dosing points across cracking, hydrogenation, and polymerization trains. Large complexes seldom tolerate unscheduled downtime, so operators favor duplex skid racks with hot-standby pumps that swap without disrupting flow. The segment anchors the chemical injection skids market size because each new ethylene unit demands conditions-specific acid inhibitors, antifoam, neutralizers, and biocide loops.
Water and wastewater facilities register the fastest 3.70% CAGR through 2031. Utilities seek nutrient-removal compliance, so multi-feed systems integrate polymer, alum, and PAC dosing on a single frame to conserve floor space. Adoption rises as municipalities shift from labor-intensive jar testing toward automated feedback loops that cut polymer overshoot by 15%. The chemical injection skids market size for water treatment is projected to rise, mirroring the build-out of tertiary treatment and sludge-dewatering lines.


By Pump Type: Diaphragm Dominance Challenged by Peristaltic Innovation
Diaphragm designs captured 46.12% revenue in 2025 due to leak-free hydraulics and PTFE diaphragms compatible with H₂S scavengers, hypochlorite, and caustic blends. Integrated pressure relief valves and double-containment housings reinforce worker safety, motivating regulated industries to retain legacy fleets. However, peristaltic technology grows 3.58% yearly as maintenance teams value tool-free hose changes that cut mean-time-to-repair by 60%.
Piston/plunger pumps remain indispensable above 1,000 bar, especially for scale-remediating solvents on deep-water umbilicals. Other niche meters, including progressive-cavity and gear pumps, serve low-shear polymer additions and high-viscosity bitumen cutback. The cost-of-ownership calculus has shifted discussion from initial capex to whole-life performance, a factor tilting new project specifications toward robust yet service-friendly options.
Geography Analysis
Europe accounted for 28.10% revenue in 2025, supported by Germany’s EUR 160 billion chemical output and a compliance climate that rewards high-accuracy dosing equipment. German SMEs representing 96% of sector companies purchase compact skids for batch specialty production, whereas BASF-scale complexes procure fully enclosed ISO-container solutions with automated switchover. Energy prices have quadrupled versus 2010-2020 averages, so plants upgrade to variable-speed drives that cut pump power by 20%, stimulating retrofit activity across existing installations.
Asia-Pacific posts the fastest 3.28% CAGR through 2031. China’s refinery-to-chemicals integration wave and India’s pharmaceuticals build-out require synchronized additive streams that ensure feedstock purity and reactor protection. The USD 700 million SCG Chemicals ethane-enhancement project in Vietnam specifies triple-pump skids with gravimetric blending to accommodate variable ethane composition. Regional EPCs embrace modular packages shipped fully wired and tested, minimizing site labor where skilled welders remain scarce.
North America secures a stable share via shale-driven petrochemical investments and mature offshore fields that rotate skids on 7-year renewal cycles. Emphasis on predictive maintenance adds digital twins and vibration analytics, allowing operators to schedule hose or diaphragm replacement before failure. Mexico’s maquiladora expansion adopts smaller capacity skids feeding paint, adhesive, and electronics finishing lines, broadening the customer base. South America, and Middle East and Africa trail in volume but gain traction as Brazil’s Comperj project and Saudi Arabia’s Vision 2030 downstream diversification roll out continuous-process units that integrate advanced chemical injection functionality.

Value Chain Analysis
The value chain starts with engineered inputs and subassemblies, including positive-displacement metering pumps (API 675/API 674), wetted materials selected for chemical compatibility (including corrosion-resistant alloys for sour or chloride service), storage tanks, tubing and valves, instrumentation (flow, pressure, and density measurement), and control hardware for PLC/SCADA integration. Skid OEMs and system integrators carry out application engineering, including sizing, pulsation control, and material selection, followed by detailed design to project standards (commonly API and ASME, plus ATEX/NORSOK or owner specifications for offshore projects). They then fabricate modular frames with preassembled piping, wiring, and control logic.
After manufacturing and integration, suppliers typically perform factory acceptance testing (FAT), package equipment for shipment, and deliver to EPCs/OEM project sites for greenfield complexes or via regional service providers for brownfield retrofits and turnarounds. Bottlenecks cluster around long-lead, high-pressure reciprocating pump capacity and availability of specialized corrosion-resistant alloys, while schedule execution risk sits in commissioning and controls handover. Integration with end users' DCS/SCADA and verification of dosing accuracy influence commissioning performance. Recent project execution, such as Aussie Fluid Power delivering a chemical injection package for Woodside Energy Scarborough Floating Production Unit, reflects demand for in-house engineered, factory-tested, multi-tank, multi-pump packages that reduce offshore integration time.
Competitive Landscape
The market remains moderately consolidated. IDEX, Ingersoll Rand, and TechnipFMC integrate pump manufacturing, controls, and field service networks to deliver turnkey solutions for refineries, LNG plants, and FPSOs. Mid-tier companies like LEWA, Milton Roy, and SEKO specialize in ultra-high-pressure and exotic-material applications, collaborating with EPC contractors on brownfield retrofits.
Technological advancements focus on diaphragm design, smart-pump diagnostics, and remote valve sequencing. LEWA’s flow-distribution module reduces pressure pulsation in offshore operations, while Watson-Marlow’s peristaltic range features IP66 enclosures and precise hose fatigue monitoring. Strategic initiatives emphasize water-treatment solutions, with Ingersoll Rand and IDEX enhancing capabilities through acquisitions and product integration.
Chemical Injection Skids Industry Leaders
Lewa GmbH
IDEX Corporation
Ingersoll Rand
SPX FLOW, Inc.
Petronash
- *Disclaimer: Major Players sorted in no particular order

Market Opportunities and Future Outlook
Operational focus on chemical-use optimization is expanding demand for control-grade, closed-loop dosing packages that combine accurate measurement with fast, stable control. In May 2026, Emerson described Active Chemical Injection Solution deployments using Coriolis flow meters and Fisher easy-e control valves that reduced chemical over-injection by 20% to 25%. This experience supports continued procurement of skids that bundle instrumentation, valve authority, and control logic, rather than standalone metering pumps. The opportunity concentrates on suppliers that can provide integrated automation (PLC/SCADA-ready), verification-ready data logging, and repeatable FAT procedures to shorten commissioning windows for both water-treatment and process-industry users.
Project activity in offshore and gas infrastructure also supports opportunities at the high-pressure and modularization ends of the market. In March 2026, IMI won a North Sea contract for ultra-high-pressure chemical injection valves exceeding 600 bar. Amarinth reported delivery of four API 675 chemical injection skid packages to Nigeria's Soku and Gbaran LNG fields, indicating continued purchasing linked to field development timelines. At the same time, operators and EPCs continue to standardize on plug-and-play, factory-tested architectures to reduce exposure to skilled-labor constraints at site, supported by December 2025 FAT completion of chemical injection skids for gas compressor stations in Bahrain for Jereh and BAPCO Upstream.
Recent Industry Developments
- May 2026: Ingersoll Rand completed the acquisition of Fox SRL and XF SRL, expanding its metering and dosing technology capabilities, including pulsation dampeners and accumulators used in dosing systems. The combination strengthens component-level integration and can improve reliability and performance of packaged chemical injection and dosing solutions offered to industrial and process customers.
- May 2026: LEWA GmbH announced a 20% hydraulic power increase for the LEWA ecoflow LDH Boxer process pump for demanding media in chemical and process industries. Higher power density can reduce footprint or increase achievable duty points in engineered injection packages, supporting high-specification applications where space, pressure, and control stability are critical.
- May 2025: INTECH announced plans to expand its Texas operations by delivering custom chemical injection skids for a chemical manufacturer, configured for Hydrogen Peroxide, Ammonium Bromide, and Potassium Hydroxide service. The project underscores continued customization demand in specialty and commodity chemical plants, where compatibility, safety, and integration requirements drive skid-level engineering rather than pump-only procurement.


Research Methodology Framework and Report Scope
Market Definition and Coverage
This market covers packaged chemical injection skid systems sold as an integrated unit, including the skid structure, metering pump set, tanks, valves, piping, instruments, and basic controls used to dose process chemicals in industrial operations.
Scope exclusions: stand-alone metering pumps, loose tanks, consumable chemicals, installation labor, and routine maintenance services are excluded from the market value.
Segmentation Overview
- By End-User Industry
- Petrochemicals
- Chemicals
- Energy and Power
- Oil and Gas
- Water Treatment
- By Pump Type
- Piston/Plunger Pumps
- Diaphragm Pumps
- Peristaltic Pumps
- Other Metering Pumps
- By Geography
- Asia-Pacific
- China
- India
- Japan
- South Korea
- Rest of Asia-Pacific
- North America
- United States
- Canada
- Mexico
- Europe
- United Kingdom
- Germany
- France
- Italy
- Rest of Europe
- South America
- Brazil
- Argentina
- Rest of South America
- Middle East and Africa
- Saudi Arabia
- South Africa
- Rest of Middle East and Africa
- Asia-Pacific
Data Sources, Market Sizing, and Validation
Desk Research
Desk research starts with mapping where skid demand comes from, and then gathering proof points that are visible in public data. We relied on sources such as the US Energy Information Administration for upstream activity context, the International Energy Agency for medium term oil and gas outlooks, the US Geological Survey for production signals that affect water handling needs, and standards and safety guidance from organizations such as ISO and API.
To make assumptions practical, the desk layer is cross-checked using company annual reports and investor decks, project and EPC announcements covered in reputed press, and association websites tied to oil and gas operations and water treatment. In places where numbers are hard to see in public sources, we also referenced paid subscriptions for company financial intelligence, patents, and shipment-level trade signals to sanity-check equipment flows. The above list is illustrative and not exhaustive, and many additional sources were used for data collection, validation, and clarification.
Primary Interviews and Surveys
Primary work is used to confirm how skids are specified, priced, and purchased across common end users, and to test the desk assumptions that drive volume and ASP. We spoke with a mix of skid integrators, component suppliers, distributors, and buyer-side engineering and maintenance teams, covering APAC, EMEA, and the Americas so regional project cycles and operating practices were reflected.
Respondent input was used to validate typical skid configurations, the split between newbuild and retrofit demand, and how automation and material choices shift pricing over time. Those insights were fed back into the model before totals were finalized.
Distribution of primary research fieldwork respondents
| Company type | Respondent position | Region |
|---|---|---|
| Top tier: 27% | CXOs: 15% | APAC: 49% |
| Mid tier: 55% | Functional/Unit leaders: 27% | EMEA: 32% |
| Smaller Players: 18% | Managers: 58% | Americas: 19% |
Market-Sizing & Forecasting
Sizing is built using top-down and bottom-up logic, with the main spine coming from a demand-pool reconstruction tied to equipment need in oil and gas, chemicals, petrochemicals, and power and water-related dosing applications. We start by linking activity indicators to expected skid deployments, and then translate that into value using representative skid pricing bands.
Key inputs used in the model include active and planned upstream and midstream projects, chemical dosing intensity by application, typical skid capacity and redundancy choices, regional skid mix (onshore versus offshore, and fixed versus modular packaging), and price movement in core components that influence packaged skid ASPs. Forecasts are driven using scenario analysis, where the outlook for oil and gas activity, compliance-driven dosing needs, and project execution timing are varied and then aligned to expert consensus from interviews. Where a bottom-up view is possible, sampled supplier and integrator revenues, along with channel checks on order flow, are used to corroborate totals and adjust for gaps where private-company reporting is limited.
Data Validation & Update Cycle
Results are validated through multi-step checks that compare modeled outcomes with independent signals, such as project pipelines, trade activity for relevant equipment classes, and directionally consistent pricing and lead-time feedback from the field. Outliers are reviewed region by region so unusual jumps are explained through a clear driver (for example, a wave of offshore tiebacks or a pause in capital spending) before sign-off is completed.
The report is refreshed annually, and interim updates are triggered when material events shift demand assumptions, such as major energy price swings or large project deferrals. Before delivery, a final analyst review pass is completed so clients receive a current view based on the latest available information.
Mordor Intelligence's Chemical Injection Skids Market Size Versus Other Published Estimates
Published market sizes for chemical injection skids do not always line up because the boundary of what is counted can shift, and the base year and pricing logic are not consistent across publishers. Differences usually come from what is included in the skid value, how regions are aggregated, and whether the estimate follows actual project timing or a smoother trend line.
By tracking skid-level inclusions and refresh timing, Mordor Intelligence keeps the value tied to packaged skid systems only (not stand-alone pumps or consumable chemicals), which can widen the gap versus estimates that blend adjacent dosing equipment into one total.
Benchmark comparison
| Source | Market Size | Gaps in Research Methodology |
|---|---|---|
| Mordor Intelligence | USD 3.04 B (2026) | |
| Global Consultancy A | USD 1.97 B (2025) | Uses an earlier base year and appears to size a narrower equipment value per system, which can undercount higher-spec skid packaging, controls, and integration content in some end-user settings. |
| Industry Publisher B | USD 2.01 B (2025) | Works on a different forecast window and mixes function-based segmenting with broad pricing averages, which can smooth out regional project cycles and reduce the impact of offshore and high-pressure skid configurations. |
Taken together, the spread is mainly explained by scope edges, base year choice, and how skid pricing is built up from configuration content. Our approach is meant to stay repeatable by anchoring demand to observable activity indicators, and then checking that the implied skid counts and ASPs still match what practitioners see in live purchasing and project execution.


Key Questions Answered in the Report
What is the current value of the Chemical Injection Skids Market?
The market stands at USD 3.04 billion in 2026 and is expected to reach USD 3.52 billion by 2031.
Which end-user segment contributes most to revenue?
Petrochemicals hold 34.62% of chemical injection skids market share, reflecting their heavy reliance on precise dosing.
Which pump technology is growing fastest?
Peristaltic pumps post a 3.58% CAGR, outpacing other types because of tool-free maintenance and contamination-free operation.
Which region shows the strongest growth potential to 2031?
Asia-Pacific leads with a projected 3.28% CAGR, propelled by large-scale petrochemical expansions in China and Southeast Asia.
Why are water-treatment plants investing in chemical injection skids?
Stricter nutrient-removal regulations and penalties drive utilities to adopt automated, multi-chemical dosing systems that ensure compliance and reduce operating cost.
Page last updated on:


