Cargo Shipping Market Size and Share
Market Overview
| Study Period | 2019 - 2031 |
|---|---|
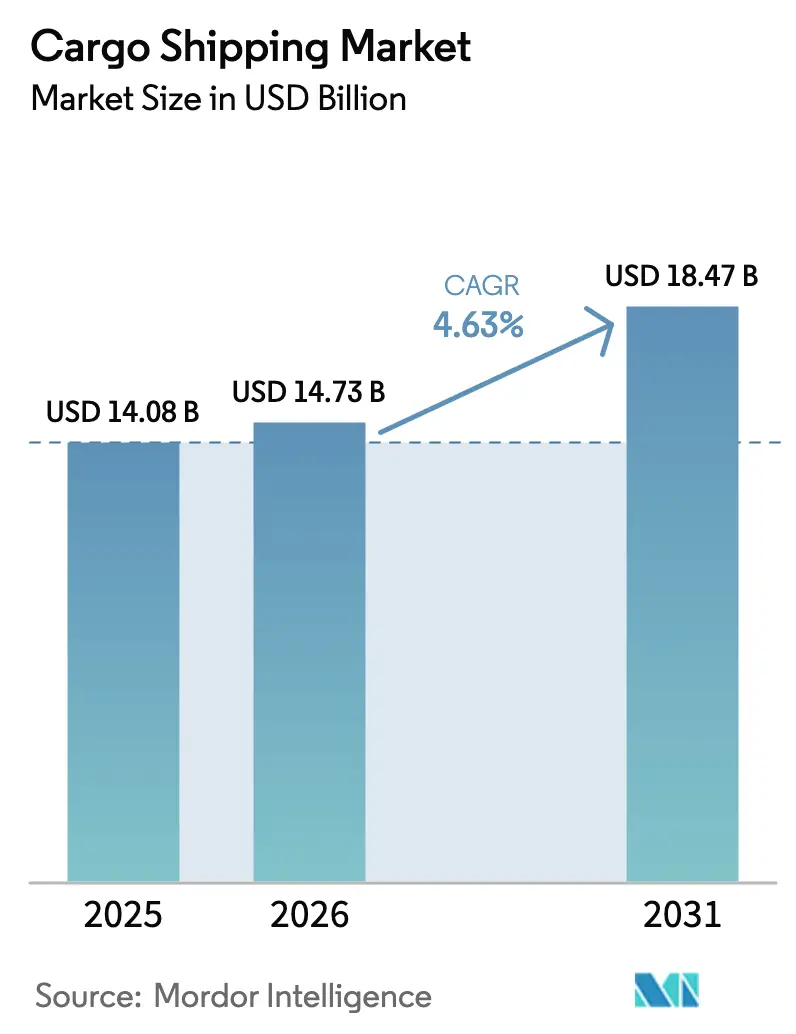
| Market Size (2026) | USD 14.73 Billion |
| Market Size (2031) | USD 18.47 Billion |
| Growth Rate (2026 - 2031) | 4.63% CAGR |
| Fastest Growing Market | Asia Pacific |
| Largest Market | Asia Pacific |
| Market Concentration | High |
Major Players
*Disclaimer: Major Players sorted in no particular order Image © Mordor Intelligence. Reuse requires attribution under CC BY 4.0. |
|
Cargo Shipping Market Analysis by Mordor Intelligence
The cargo shipping market size is projected to be USD 14.08 billion in 2025 and is estimated to grow from USD 14.73 billion in 2026 to reach USD 18.47 billion by 2031, growing at a CAGR of 4.63% from 2026 to 2031. Recent momentum stems from International Maritime Organization (IMO) decarbonization mandates, e-commerce demand for high-frequency shipments, and the emergence of new South-South trade corridors that redistribute volume toward developing-economy port pairs. Decarbonization rules are encouraging early retirement of older tonnage and heavier investment in methanol, LNG, and ammonia-ready vessels, effectively tightening capacity even as total fleet count grows. Strong Asia-Pacific throughput, digital freight platforms that reveal idle slots, and significant sourcing shifts by multinational manufacturers collectively underpin sustained demand across liner, tramp, and specialized services. However, bunker fuel volatility, new EU Emissions Trading System (ETS) surcharges, and route disruptions near the Red Sea continue to cloud rate visibility and compress carrier margins.
Key Report Takeaways
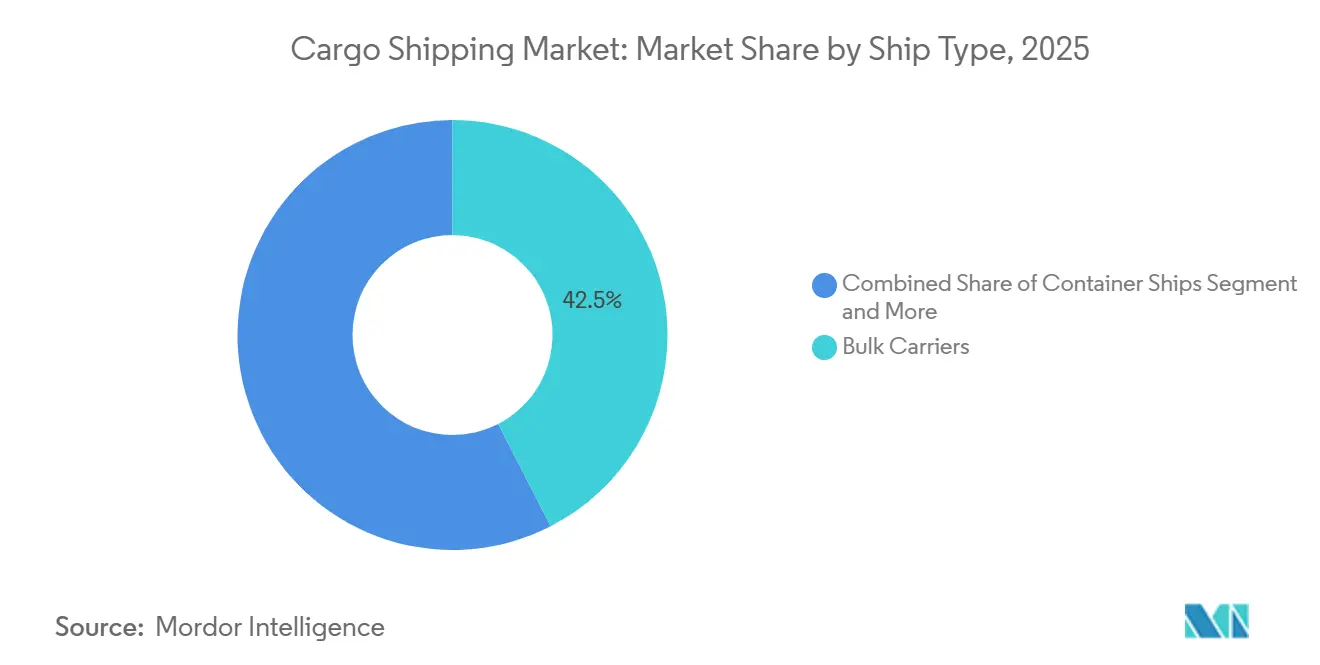
- By ship type, bulk carriers held 42.45% revenue share in 2025, whereas reefer and other specialized vessels are set to expand at a 6.12% CAGR to 2031.
- By vessel size class, Panamax ships commanded 38.04% revenue share in 2025; post-Panamax and neo-Panamax classes are poised to rise at a 4.94% CAGR through 2031.
- By cargo type, dry bulk led with 75.12% of cargo shipping market share in 2025, while containerized freight is forecast to grow at a 5.75% CAGR through 2031.
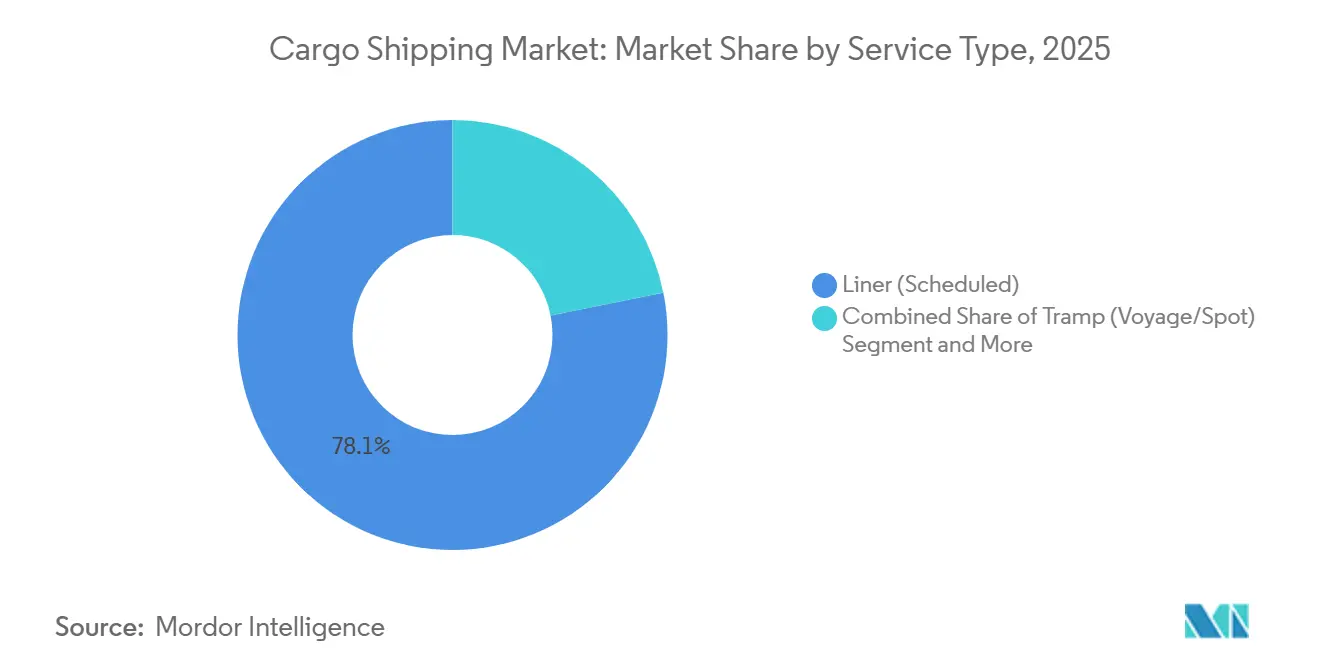
- By service type, liner schedules accounted for 78.14% of revenue in 2025; this segment is also the fastest, advancing at a 6.48% CAGR through 2031.
- By end-use industry, manufacturing accounted for 36.21% of the 2025 demand; however, pharmaceuticals and healthcare are expected to outpace all peers with a 7.12% CAGR from 2026 to 2031.
- By geography, the Asia-Pacific region dominated with a 47.13% revenue share in 2025 and is projected to grow at a 5.48% CAGR through 2031.
Note: Market size and forecast figures in this report are generated using Mordor Intelligence’s proprietary estimation framework, updated with the latest available data and insights as of January 2026.
Global Cargo Shipping Market Trends and Insights
Drivers Impact Analysis*
| Driver | (~) % Impact on CAGR Forecast | Geographic Relevance | Impact Timeline | |
|---|---|---|---|---|
| E-Commerce Drives Small-Lot Shipping | +1.2% | Global, most visible in Asia-Pacific and North America | Short term (≤ 2 years) | |
| Sourcing Shifts Boost South-South Trade | +0.9% | Asia-Pacific core, spill-over to MEA and South America | Medium term (2-4 years) | |
| IMO Rules Accelerate Fleet Renewal | +0.8% | Global, enforcement strongest in EU and North America | Long term (≥ 4 years) | |
| Growth in Plurilateral Trade Pacts | +0.6% | Asia-Pacific (RCEP), Africa (AfCFTA), Americas (CPTPP) | Medium term (2-4 years) | |
| Digital Platforms Unlock Vessel Capacity | +0.5% | Global, concentrated in North America and Europe | Short term (≤ 2 years) | |
| Near-Port Manufacturing Growth | +0.4% | MENA (United Arab Emirates, Saudi Arabia, Egypt), ASEAN (Vietnam, Indonesia, Thailand) | Long term (≥ 4 years) | |
| Source: Mordor Intelligence | ||||
E-Commerce-Led Demand for High-Frequency, Small-Lot Ocean Moves
In recent years, cross-border e-commerce transactions have grown significantly. This trend has pushed carriers to focus on increasing departure frequency rather than solely optimizing slot utilization. Consequently, traditional full-container-load models have shifted toward smaller, time-sensitive consignments. To adapt to this change, liner operators have introduced express loops between Asia and North America, significantly reducing port-to-port transit times compared to previous years[1]"ONE revises Asia–North America loops starting October 2025",porttechnology.org. Additionally, several fulfillment centers have been established near major ports, enhancing door-to-port integration and enabling premium pricing for expedited services. While customs agencies are experimenting with pre-clearance protocols, inconsistent implementation across regions has added compliance challenges, particularly for smaller forwarders. These developments have created a divided freight landscape: commodity bulk remains cost-sensitive, whereas e-commerce shipments exhibit inelastic demand and command premium rates, providing carriers with a safeguard against spot market volatility.
Shifting Sourcing Patterns Boosting South-South Trade Lanes
Between 2020 and 2024, intra-developing-country flows experienced significant growth, surpassing the pace of North-South trade and redirecting capacity toward the China-Africa and South America-Asia corridors. By 2024, container traffic between China and Africa had expanded notably, supported by Belt and Road infrastructure projects and increasing African consumption. Maersk’s new Santos-Shanghai service, launched in 2025, shaved 4 days off transit and circumvented Panama Canal congestion, highlighting the carrier's redeployment toward emergent lanes [2]“Express Route Launches,” Maersk, maersk.com. In 2024, the African Continental Free Trade Area's removal of tariffs on most internal goods led to a notable rise in demand for coastal short-sea services. This shift toward a more diverse range of cargoes, including electronics and perishables, has driven the need for greater investment in reefer capacity. These investments have increased capital intensity and created high-margin opportunities, presenting challenges for smaller market participants.
IMO Decarbonization Deadlines Accelerating Fleet Renewal Cycles
The IMO’s Carbon Intensity Indicator framework requires consistent annual efficiency improvements through 2030, with penalties imposed on vessels that fail to comply. In recent years, the demand for alternative-fuel ships has grown significantly, with a notable focus on methanol and ammonia propulsion systems. Leading companies in the shipping industry have made substantial investments in expanding their fleets with environmentally friendly vessels. At the same time, older ships are being retired at a steady pace, as the cost of retrofitting them to meet modern standards has become increasingly prohibitive. Current regulations favor compliant vessels with better market opportunities, while older, non-compliant ships are being relegated to less profitable routes, reducing their operational viability.
Rise of Multilateral and Plurilateral Trade-Agreement Pipelines
RCEP implemented measures that removed tariffs on a significant portion of goods within the region, driving growth in container volumes across the Asia-Pacific. Similarly, the CPTPP expanded its membership, enhancing trade in Pacific-coast refrigerated goods. The AfCFTA's customs harmonization efforts improved border efficiency, reducing logistics costs across the region. Carriers are increasingly deploying larger vessels for intra-regional routes to optimize operations. For example, COSCO introduced higher-capacity ships on the China-Southeast Asia routes, achieving cost efficiencies. However, fragmented rules of origin continue to require extensive digital documentation, favoring larger operators with advanced compliance platforms.
Restraints Impact Analysis*
| Restraint | (~) % Impact on CAGR Forecast | Geographic Relevance | Impact Timeline |
|---|---|---|---|
| Bunker Prices and ETS Surcharges | -0.7% | Global, with the EU and North America bearing higher surcharges | Short term (≤ 2 years) |
| Geopolitical Risks at Key Chokepoints | -0.5% | Red Sea, Strait of Hormuz, Malacca Strait | Short term (≤ 2 years) |
| Port and Hinterland Congestion | -0.4% | LA-Long Beach, Rotterdam, Singapore, Shanghai | Medium term (2-4 years) |
| Carbon Levies Drive Cost | -0.3% | EU core, spill-over to North America and Asia-Pacific | Long term (≥ 4 years) |
| Source: Mordor Intelligence | |||
Volatile Bunker Fuel Prices and EU ETS Surcharges
In the first half of 2025, low-sulfur marine fuel prices rose sharply from the previous year, driven by production cuts from major oil producers. The implementation of ETS Phase IV has introduced substantial carbon charges for large vessels on Asia-Europe routes, with carriers passing a majority of these costs to customers through environmental surcharges. Despite a notable portion of the global fleet adopting scrubbers by 2025, the high installation costs continue to deter smaller operators, intensifying cost disparities within the industry. Contract negotiations now frequently include clauses for periodic rate reviews and for transferring fuel cost risks to shippers. However, this shift reduces budget predictability and creates financial challenges for small and medium-sized enterprises.
Rising Geopolitical Exposure of Key Chokepoints
In recent years, Houthi attacks on Red Sea routes have forced Asia-Europe services to reroute around the Cape of Good Hope. This adjustment has significantly increased voyage durations and fuel costs for each trip. A temporary closure of the Strait of Hormuz earlier this year caused a notable rise in oil prices and disrupted LNG carrier schedules, underscoring the risks posed by chokepoint disruptions. Piracy incidents in the Malacca Strait have escalated, leading to higher insurance premiums for shipments passing through the area. To address these challenges, carriers have increasingly deployed armed guards on vessels operating in high-risk waters, further raising operational costs and security-related responsibilities.
*Our forecasts treat driver/restraint impacts as directional, not additive. The impact forecasts reflect baseline growth, mix effects, and variable interactions.
Segment Analysis
By Ship Type: Bulk Dominance Meets Reefer Acceleration
Bulk carriers accounted for 42.45% of 2025 revenue, anchored by iron ore, coal, and grain volumes with low substitution elasticities. This dominance stabilizes the cargo shipping market because infrastructure projects in India and Southeast Asia sustain strong demand for raw materials. LNG carrier utilization climbed in 2024, fueled by Europe’s pivot away from Russian pipeline gas. Container ships are shifting toward mega-vessels, with 24,000 TEU units delivering a lower slot cost than their 14,000 TEU predecessors on the Asia-Europe routes. General cargo and multipurpose orders have decreased, confirming a shift by shippers to containers, even for project cargo. Reefer-equipped container vessels constitute a small base yet are expected to grow at a 6.12% CAGR through 2031 as biologics, vaccines, and perishable produce increase cold-chain ocean demand.
Fleet composition reflects a premiumization divide: compliant reefer and LNG vessels command rate premiums of 15-20%, whereas legacy bulkers chase volatile spot charters. Maersk’s order for several reefer-centric vessels signals intensified competition for pharmaceutical corridors. With a significant portion of global tonnage being older vessels, increased scrapping is improving the utilization of modern ships, further intensifying the pricing disparity within the cargo shipping market.


By Vessel Size Class: Panamax Workhorse Faces Neo-Panamax Challenge
Panamax tonnage claimed 38.04% revenue in 2025, serving secondary ports where beam and draft cap ship size. Still, post-Panamax and neo-Panamax tonnage is expanding at 4.94% CAGR, pivoting on slot-cost economies as carriers up-sweep Asia-Europe and transpacific loops. Handy and Handymax bulkers sustain reliable demand in shallow-draft regional routes. Ultra-large container vessels (over 20,000 TEU) face berth restrictions at most global terminals, curbing further increases in vessel dimensions.
Rising neo-Panamax penetration exerts pressure on canal infrastructure; transit waits averaged 10 days mid-2024, prompting carriers to evaluate Suez or Cape of Good Hope options even without geopolitical triggers. With no new orders beyond 25,000 TEU placed in 2024, scale economics appear saturated, redirecting capital toward fuel efficiency and digital systems rather than sheer vessel size within the cargo shipping market.
By Cargo Type: Containerization Gains Ground
Dry bulk continued to dominate with a 75.12% share in 2025 as iron ore shipments grew and grain exports rebounded following Black Sea corridor reopening. Despite a decline in European coal imports, the liquid bulk segment grew, driven by increased LNG trade. Containerized flows are accelerating at a 5.75% CAGR as e-commerce, automotive CKD kits, and perishables shift from break-bulk to containerized transport. Vehicle exporters have significantly increased the use of containers for Asia-Europe shipments compared to previous years. Reefer container volumes also saw notable growth, with pharmaceuticals accounting for a substantial share, reflecting regulatory emphasis on compliant cold-chain logistics.
Containerization requires carriers to upgrade monitoring technology; IoT-enabled reefers deliver real-time temperature logs that satisfy regulatory audits and elevate service premiums. Consequently, capex allocation skews toward container fleets—particularly those equipped for controlled atmospheres—indicating that the cargo shipping market for reefer containers will continue to grow faster than that for conventional dry bulk.
By Service Type: Liner Schedules Dominate
Fixed-day liner services accounted for 78.14% of the revenue in 2025 and are expected to grow at a 6.48% CAGR, benefiting from a significant share of surveyed shippers naming schedule reliability as their top selection criterion. Tramp charters remain vital for commodity trades but face lower Capesize earnings in 2024 amid oversupply. Project and heavy-lift services, although niche, enjoy rate resilience due to their limited vessel count and specialized crane capabilities.
Maersk's Captain Peter platform exemplifies the impact of digitalization, significantly reducing manual workloads and integrating dynamic yield management into its pricing strategy. As containerization continues to expand into project cargo and the automotive sector, liner operators are expected to strengthen their market share, further solidifying the advantages gained from consistent service patterns in the cargo shipping market.
By End-Use Industry: Pharma Outpaces Manufacturing
Manufacturing maintained its lead at 36.21% of the 2025 volume, driven by strong electronics and vehicle exports in 2024. Yet, the pharmaceuticals and healthcare niche is accelerating at a 7.12% CAGR through 2031, as biologics and temperature-sensitive vaccines proliferate. Expanding reefer capacity and adherence to strict regulatory protocols have enhanced margins in this sector, offering carriers a reliable safeguard against fluctuations in bulk rates. The food and beverage industry, which heavily relies on reefer containers, continues to demonstrate stability.
Additionally, electrical and electronics commodities are benefiting from the export momentum in the Asia-Pacific region, with notable growth in Vietnam's electronics shipments. The pharmaceutical sector's willingness to invest in GDP-compliant services ensures premium returns. This underscores the potential for specialized reefer assets and comprehensive visibility platforms, creating opportunities for carriers with advanced cold-chain capabilities to expand their market share in cargo shipping.
Geography Analysis
The Asia-Pacific region held a 47.13% share of the cargo shipping market in 2025 and is projected to grow at a 5.48% CAGR through 2031. China’s container throughput hit 330 million TEUs in 2024, anchored by mega-ports in Shanghai, Ningbo-Zhoushan, and Shenzhen [3]“2024 Throughput Data,” China Ports & Harbours Association, chinaports.com. Intra-regional volumes grew significantly due to RCEP tariff reductions. Vietnam's Hai Phong complex demonstrated strong performance, driven by the reshoring of electronics. Indonesia's Patimban Port has become a key player in supporting automotive exports, with substantial investments from Japanese OEMs for nearby assembly facilities. India's imports grew notably in 2024, supported by production-linked incentive schemes aimed at diversifying sourcing. To maintain their hub status, Japan and South Korea are upgrading berths with shore power and green fuel bunkering capabilities.
In 2025, North America and Europe demonstrated stable yet modest growth in trade volumes. The Los Angeles-Long Beach port remained a key hub, primarily handling imports of electronics, apparel, and furniture. Domestic EV production in the United States, driven by policy incentives, has reduced reliance on Asian imports of EV components. In Europe, reshoring efforts contributed to increased container flows within the region, supported by an extensive short-sea network. Rotterdam continued to serve as a critical gateway for trade involving Germany and France, although labor disruptions posed significant challenges. Looking ahead, upcoming regulatory changes are expected to increase costs for imported goods, encouraging manufacturers to shift toward regional supply chains.
Meanwhile, South America, the Middle East, and Africa, though smaller in scale, are experiencing rapid growth. Brazil's primary port played a vital role in facilitating exports of agricultural and meat products, which formed a substantial portion of its outbound trade. Argentina's key port capitalized on rising demand for grain exports, particularly from Asia. In Africa, the implementation of a regional trade agreement significantly boosted short-sea shipping activity in both western and eastern regions. The major port in the United Arab Emirates leveraged its industrial zones to strengthen its position as a transshipment hub for East Africa. Despite maintaining its importance as a global trade route, the Suez Canal faced challenges as security concerns in the Red Sea prompted some ships to take alternative routes, impacting revenue. In Africa, Durban remained a leading port but continued to face operational inefficiencies due to aging infrastructure and labor-related issues.


Competitive Landscape
The top ten liner companies controlled a significant share of global container capacity in 2025, resulting in a moderately concentrated cargo shipping market. Alliances - 2M, Ocean, and THE - are optimizing port calls and load factors, achieving significant cost reductions compared to independent operators. Maersk made headlines with its acquisition of Visible Supply Chain Management, marking a strategic move into last-mile services. CMA CGM and COSCO have leveraged AI-driven scheduling, yielding notable improvements in fuel efficiency on mainline trades. Meanwhile, digital freight disruptors like Freightos and Xeneta are reshaping the landscape by enabling direct carrier bookings, which has led to a considerable impact on forwarder margins.
Capital barriers in the industry remain formidable: the cost of new vessels predominantly favors established players with access to deep debt markets. However, asset-light digital platforms are upending traditional norms by aggregating idle slots, all without the burden of vessel ownership. Furthermore, sustainability credentials are becoming pivotal: certifications and adherence to environmental standards are playing an increasingly significant role in tender decisions, especially among shippers in Europe and North America.
In 2024, the industry witnessed a notable shake-up, with several liner operators either declaring bankruptcy or being acquired, highlighting the mounting consolidation pressures on smaller fleets. As the industry pivots towards decarbonization, fresh investments are gravitating towards advanced and environmentally friendly assets. Simultaneously, niche players are carving out a space by pursuing carbon-neutral routes, utilizing innovative fuel blends, and auxiliary sail propulsion.
Cargo Shipping Industry Leaders
-
A.P. Moller - Maersk A/S
-
Mediterranean Shipping Company S.A.
-
CMA CGM Group
-
China COSCO Shipping Corporation Limited
-
Hapag-Lloyd AG
- *Disclaimer: Major Players sorted in no particular order

Recent Industry Developments
- October 2025: S J Logistics launched the Suez Express Service linking Jebel Ali, Kandla, Jeddah, and Alexandria to cut transit times across Gulf-India-Africa-Red Sea loops.
- August 2025: MSC announced a weekly loop connecting Hazira, Mundra, and Nhava Sheva with Sohar and Abu Dhabi to deepen India-Middle East trade lanes.
- August 2025: Haldia Dock Complex opened direct container sailings to Chittagong, Bangladesh, reducing cross-border dwell and bolstering EXIM trade.
- December 2024: India’s subsidized cargo service on National Waterways 1 and 2 commenced, linking Kolkata with Patna, Varanasi, and Guwahati to ease highway congestion under the Jalvahak scheme.


Research Methodology Framework and Report Scope
Market Definitions and Key Coverage
Our study defines the cargo shipping market as the freight revenue earned by oceangoing vessels that transport dry bulk, liquid bulk, general, and containerized goods across international waters, covering liner, tramp, and parcel services. It spans every ocean-going ship class from Handy vessels to ultra-large container ships and includes embedded bunker and surcharge components that are part of the contracted voyage rate.
For clarity, we exclude inland barge traffic, domestic coastal cabotage, pure passenger cruises, rail or road legs, and terminal fees that are invoiced separately.
Segmentation Overview
-
By Ship Type
- Bulk Carriers
- Container Ships
- Tankers
- General Cargo Ships
- Reefer and Specialized Vessels
-
By Vessel Size Class
- Handy/Handymax
- Panamax
- Post-Panamax and Neo-Panamax
- Ultra-Large Container Vessels
-
By Cargo Type
- Dry Bulk
- Liquid Bulk (Crude, LNG/LPG, Chemicals)
- Containerized (General and Reefer)
-
By Service Type
- Liner (Scheduled)
- Tramp (Voyage/Spot)
- Project / Heavy-lift / Parcel
-
By End-use Industry
- Manufacturing
- Food and Beverages
- Oil, Gas and Energy
- Pharmaceuticals and Healthcare
- Electrical and Electronics
- Others
-
By Geography
-
North America
- United States
- Canada
- Rest of North America
-
South America
- Brazil
- Argentina
- Rest of South America
-
Europe
- Germany
- United Kingdom
- France
- Italy
- Spain
- Russia
- Rest of Europe
-
Asia-Pacific
- China
- Japan
- India
- South Korea
- Rest of Asia-Pacific
-
Middle East and Africa
- Saudi Arabia
- United Arab Emirates
- Egypt
- Turkey
- South Africa
- Rest of Middle East and Africa
-
North America
Detailed Research Methodology and Data Validation
Primary Research
We spoke with shipowners, freight forwarders, port planners, and bunker suppliers across Asia-Pacific, Europe, and the Americas. These conversations validated load-factor assumptions, voyage yields, and emerging decarbonization premiums that secondary sources only hint at.
Desk Research
We began by assembling time-series signals on global seaborne trade, fleet capacity, and freight pricing from UNCTAD, the International Maritime Organization, Clarksons Shipping Intelligence, Container Trade Statistics, and major port authority customs releases. Company 10-Ks, carrier presentations, broker indices, and reputable press updates furnished current spot and contract rate benchmarks that refine our base year.
Paid slices from D&B Hoovers and Dow Jones Factiva enabled our analysts to mirror carrier financials and news flow. This documentary trail forms the backbone of the model; many additional public and subscription sources were also consulted for data cross-checks and clarification.
Market-Sizing & Forecasting
Cargo volume in dead-weight tons is first reconstructed top-down from UNCTAD trade matrices and port throughput, which are then valued with sampled voyage and time-charter rates to size the revenue pool. Select bottom-up cross-checks, carrier fleet roll-ups, and average slot cost × TEU lift anchor the totals.
Key model drivers include GDP growth, TEU throughput, vessel delivery schedules, bunker fuel indices, Drewry World Container Index movements, and orderbook-to-fleet ratios. A multivariate regression projects demand through the forecast period, while scenario analysis captures shocks such as canal blockages or rapid fuel-price swings. Gaps in bottom-up inputs are bridged using regional averages confirmed during interviews.
Data Validation & Update Cycle
Mordor analysts compare model outputs with independent trade indices, flag anomalies for peer review, and refresh the workbook every year, issuing interim updates when events materially shift freight rates so clients always receive the latest view.
Why Mordor's Cargo Shipping Baseline Stands Up to Scrutiny
Published cargo-shipping figures often diverge because firms mix cargo types, units, and pricing yardsticks.
We lay out our scope and variables so users see exactly what is counted.
Benchmark comparison
| Market Size | Anonymized source | Primary gap driver |
|---|---|---|
| USD 14.73 B (2025) | Mordor Intelligence | |
| USD 16.57 B (2025) | Global Consultancy A | Includes coastal and inland barge freight; blends 2024-25 rates |
| USD 17.40 B (2025) | Industry Association B | Counts terminal handling and documentation fees as freight revenue |
| USD 11.89 B (2024, volume-based) | Regional Consultancy C | Converts cargo volume to value with a uniform USD/ton factor |
The comparison shows that small definitional shifts swing results by billions. By selecting transparent variables, revisiting them annually, and validating through both desk and field work, Mordor Intelligence delivers a balanced, repeatable baseline that decision-makers can trust.


Key Questions Answered in the Report
What is the projected CAGR for the cargo shipping market between 2026 and 2031?
The market is forecast to expand at a 4.63% CAGR during 2026-2031.
Which cargo category currently dominates global ocean shipping revenue?
Dry bulk leads, capturing 75.12% of 2025 revenue.
How large is Asia-Pacific’s share of global ocean freight volume?
Asia-Pacific accounted for 47.13% of revenue in 2025 and is growing at a 5.48% CAGR.
Which ship type is expanding fastest through 2031?
Reefer and other specialized vessels are set to rise at a 6.12% CAGR.
What strategic move is most common among top carriers?
Major operators are integrating vertically into end-to-end logistics while investing in alternative-fuel newbuilds to meet IMO decarbonization targets.
Page last updated on:


