Carbon Capture And Storage Market Size and Share
Market Overview
| Study Period | 2020 - 2031 |
|---|---|
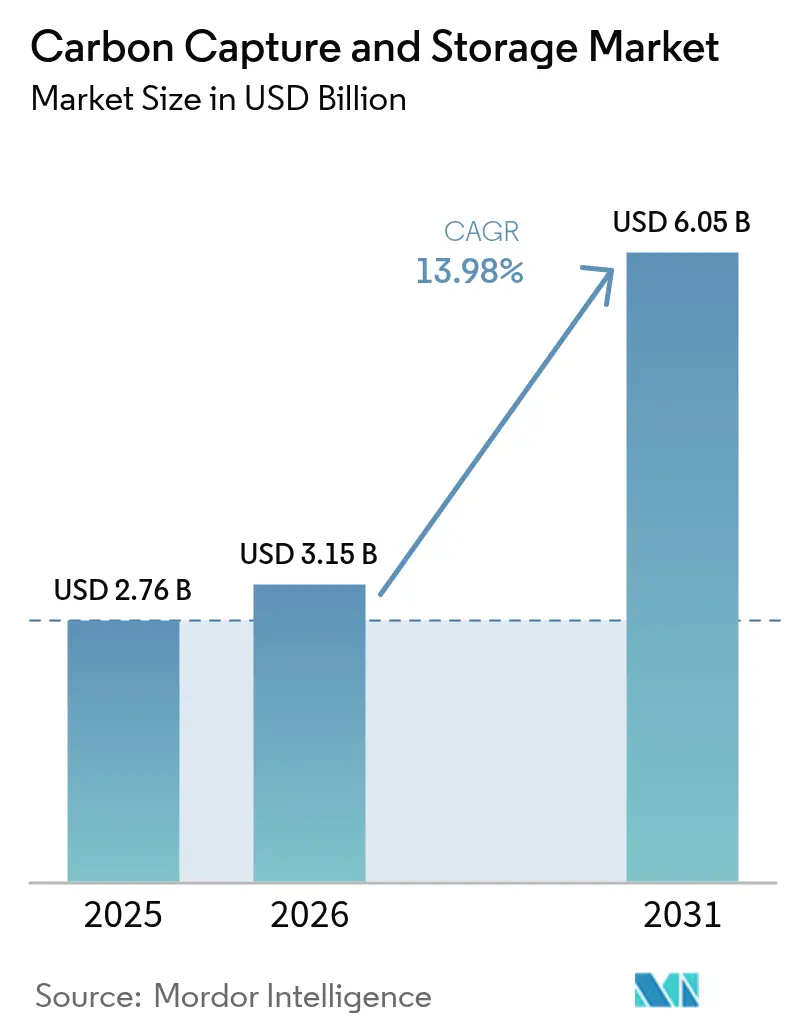
| Market Size (2026) | USD 3.15 Billion |
| Market Size (2031) | USD 6.05 Billion |
| Growth Rate (2026 - 2031) | 13.98% CAGR |
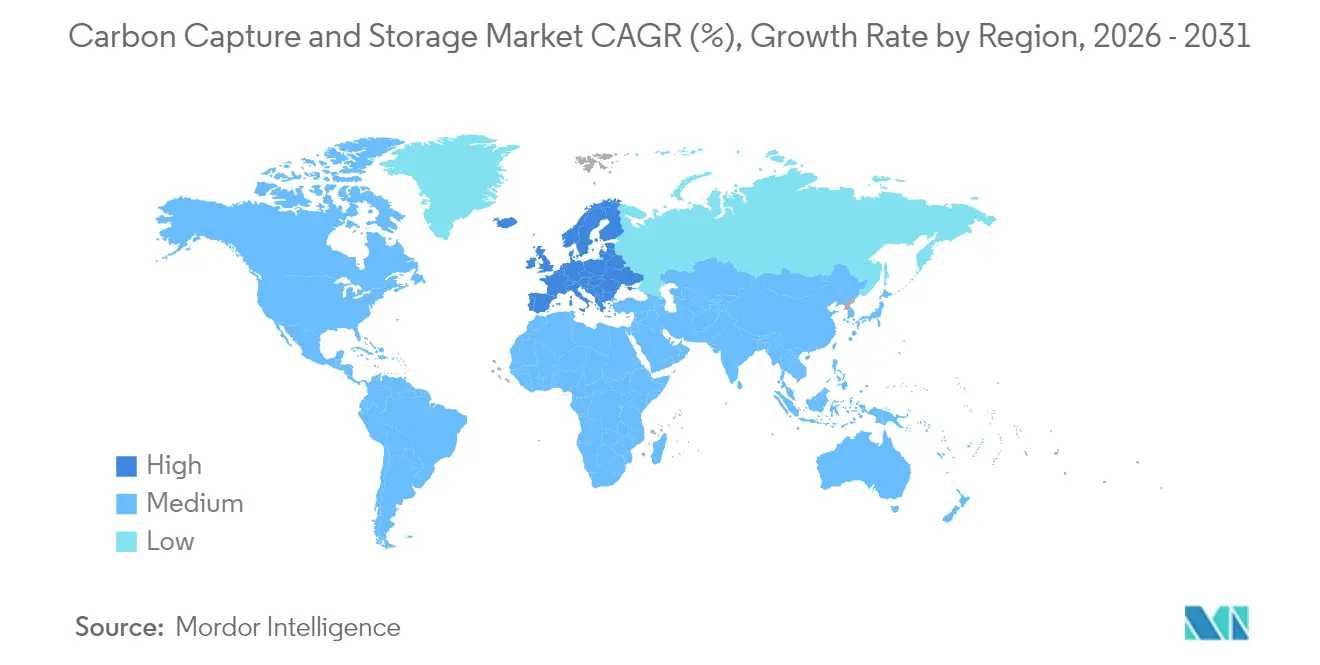
| Fastest Growing Market | Europe |
| Largest Market | North America |
| Market Concentration | Medium |
Major Players *Disclaimer: Major Players sorted in no particular order Image © Mordor Intelligence. Reuse requires attribution under CC BY 4.0. | |
Carbon Capture And Storage Market Analysis by Mordor Intelligence
The Carbon Capture And Storage market size is expected to grow from USD 2.76 billion in 2025 to USD 3.15 billion in 2026 and is forecast to reach USD 6.05 billion by 2031 at 13.98% CAGR over 2026-2031. Rising regulatory pressure, maturing capture technologies, and the recognition that heavy industries cannot meet net-zero obligations without dedicated abatement solutions underpin this expansion. Governments are tightening emissions caps, expanding carbon-pricing schemes, and raising tax incentives, creating a price signal that has shifted CCS from pilot-scale experiments to commercial deployment. The convergence of supportive policy and technology cost decline also attracts private capital from oil majors and industrial conglomerates that see CCS as a hedge against future carbon liability. Competition from renewable power does temper the outlook, yet sectors such as cement, steel, chemicals, and refineries have few practical alternatives, making CCS a structural requirement rather than a transitional option.
Key Report Takeaways
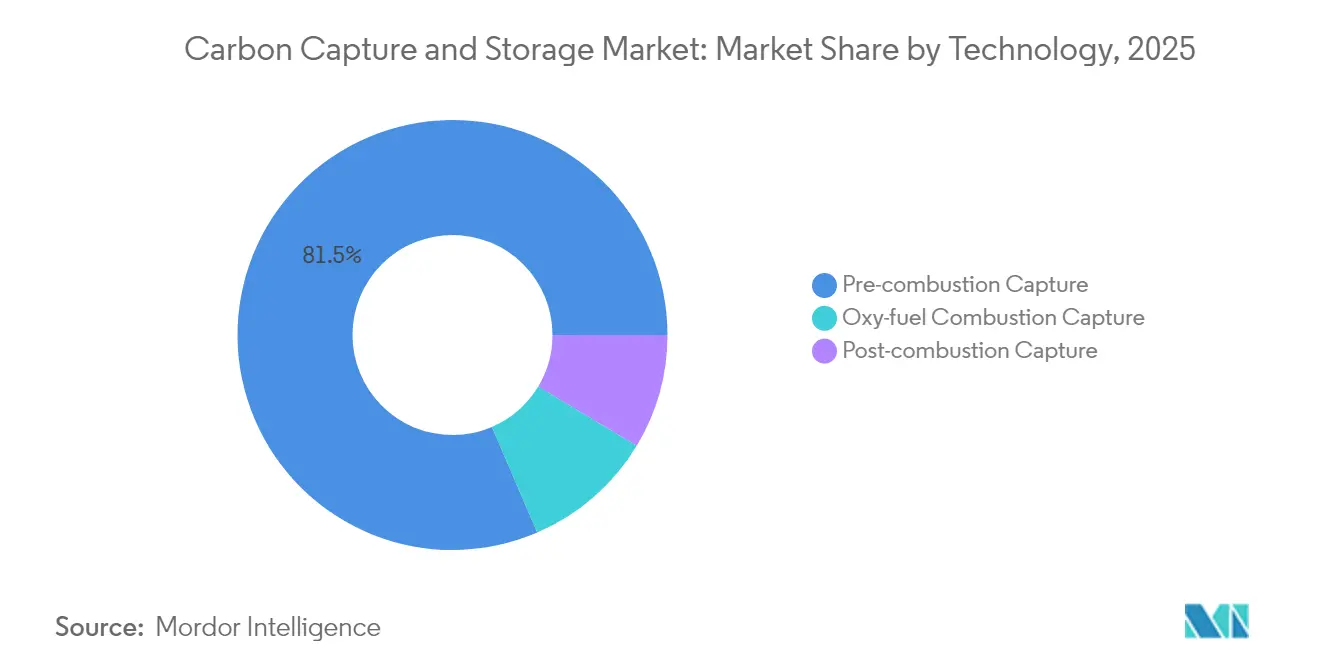
- By technology, pre-combustion capture held 81.45% of carbon capture and storage market share in 2025 while oxy-fuel combustion capture is forecast to register an 18.21% CAGR through 2031.
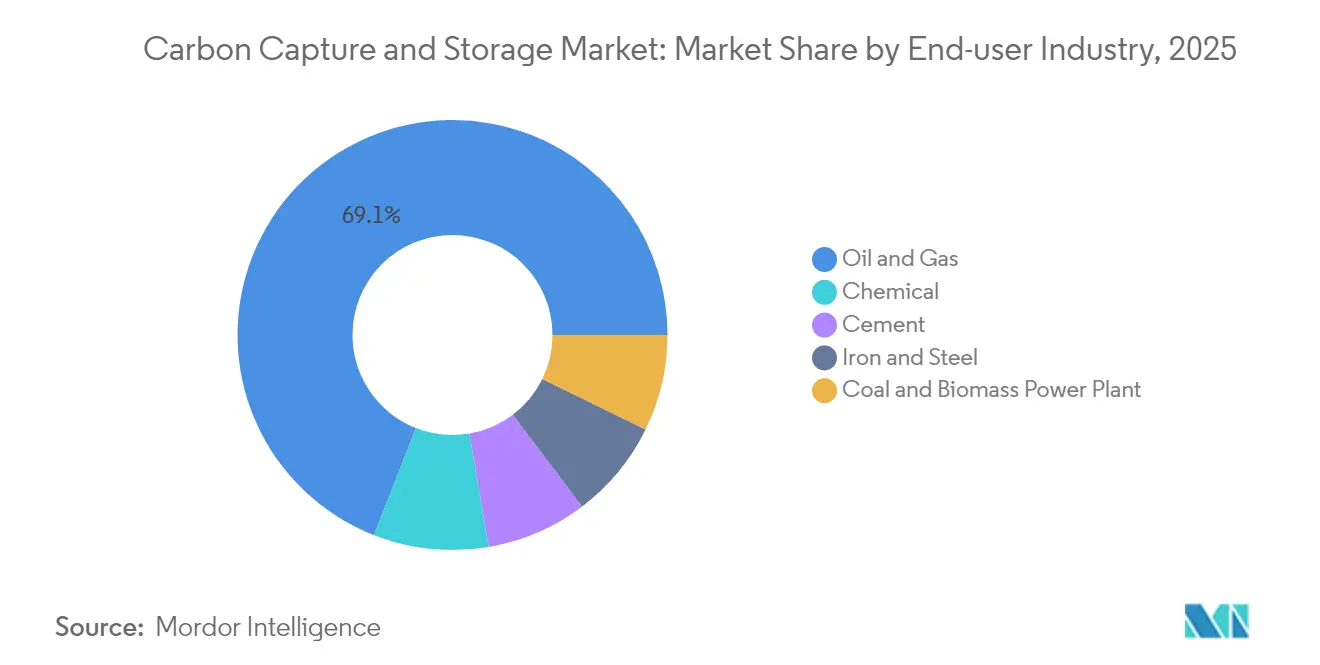
- By end-user industry, the oil and gas segment accounted for 69.05% of the carbon capture and storage market size in 2025, whereas the chemical sector is set to expand at a 25.12% CAGR between 2026-2031.
- By geography, North America led with 50.72% revenue share in 2025 and Europe is projected to deliver the fastest regional CAGR of 26.05% during the outlook period.
Note: Market size and forecast figures in this report are generated using Mordor Intelligence’s proprietary estimation framework, updated with the latest available data and insights as of 2026.
Global Carbon Capture And Storage Market Trends and Insights
Drivers Impact Analysis*
| Driver | (~) % Impact on CAGR Forecast | Geographic Relevance | Impact Timeline |
|---|---|---|---|
| Emerging Demand for CO₂-EOR Projects | +2.8% | North America and Middle-East | Medium term (2-4 years) |
| Expansion of Carbon-Pricing and ETS Schemes | +3.2% | Global, with EU and California leading | Long term (≥ 4 years) |
| Stricter National Net-Zero Legislation | +4.1% | Global, concentrated in developed economies | Long term (≥ 4 years) |
| Scale-Up of Low-Carbon Synthetic-Fuel Projects | +1.9% | Europe and Asia-Pacific | Medium term (2-4 years) |
| Direct-Air-Capture (DAC) Build-Outs Needing Storage | +1.5% | North America and Northern Europe | Long term (≥ 4 years) |
| Source: Mordor Intelligence | |||
Emerging Demand for CO₂-EOR Projects
Enhanced oil recovery is regaining prominence because it creates dual revenue streams—monetizing captured carbon while extending production from mature reservoirs. Oil majors are pairing fertiliser, steel, and petrochemical emitters with depleted fields, turning capture hubs into profit-generating assets during the early adoption stage. The approach lowers payback periods, secures anchor customers, and accelerates infrastructure build-out in regions that already possess extensive pipeline networks. It also provides practical experience in handling large CO₂ volumes, establishing a bridge to pure storage projects as EOR demand tails off over time. Revenue visibility from incremental barrels helps investors justify the high upfront capital required for capture plants and injection wells, smoothing the transition toward stand-alone sequestration services.
Expansion of Carbon-Pricing and ETS Schemes
Carbon markets now extend beyond cap-and-trade to include border adjustments and sector-specific levies, changing the economic calculus for manufacturers that export into regulated regions[1]European Commission, “Carbon Border Adjustment Mechanism: Questions and Answers,” europa.eu. The EU’s Carbon Border Adjustment Mechanism applies a shadow price to imported emissions-intensive goods, forcing foreign producers to invest in CCS or risk losing market share. California extended its cap-and-trade through 2030 and tightened allowance allocations, making CCS a compliance cost-avoidance tool rather than a corporate social responsibility add-on. Voluntary carbon markets are maturing, and though questions around additionality persist, they still create secondary monetization routes for verified storage tonnes. Each of these policy levers lifts the floor price for abatement, narrowing the economic gap between capture costs and market incentives.
Stricter National Net-Zero Legislation
Legally binding 2050 net-zero targets are cascading into sector-level standards that compel heavy emitters to show credible decarbonization pathways, and CCS is explicitly cited in most strategies. The UK Industrial Decarbonisation Strategy ties permit approvals for new plants to the submission of CCS implementation plans. Germany’s draft law to lift the onshore storage moratorium signals a policy pivot that places climate imperatives ahead of historic public concerns. Clarity around liability, monitoring, and long-term stewardship lowers the risk premiums that deter financial institutions, translating political ambition into bankable business models. The alignment between national legislation and multilateral climate commitments transforms CCS from optional technology to structural necessity, underpinning the rapid scale-up anticipated post-2025.
Scale-Up of Low-Carbon Synthetic-Fuel Projects
Aviation and shipping cannot meet 2050 climate goals through electrification alone; they therefore look to power-to-liquids and e-methanol that need captured CO₂ as feedstock. Airlines have signed offtake agreements for sustainable aviation fuel, while maritime engine designers like Wärtsilä test onboard carbon capture modules that feed into closed-loop e-fuel production. These developments create alternative revenue channels for capture operators, allowing higher pricing than permanent storage while supporting circular carbon utilization. Synthetic-fuel pathways gain competitiveness in jurisdictions that adopt mandates such as the EU ReFuelEU initiative, anchoring long-term demand for biogenic and industrial CO₂ streams and bolstering project economics for early movers.
Restraints Impact Analysis*
| Restraint | (~) % Impact on CAGR Forecast | Geographic Relevance | Impact Timeline |
|---|---|---|---|
| High CAPEX And OPEX Of CCS Plants | -3.5% | Global, particularly in developing economies | Short term (≤ 2 years) |
| Growing Attractiveness of Cheaper Renewables | -2.1% | Global, with strongest impact in regions with excellent renewable resources | Medium term (2-4 years) |
| Public Opposition to On-Shore CO₂ Pipelines | -1.8% | Rural North America and Europe | Short term (≤ 2 years) |
| Source: Mordor Intelligence | |||
High CAPEX and OPEX of CCS Plants
Industrial-scale facilities routinely require USD 500 million-800 million in upfront investment, making equity financing challenging where policy certainty is weak. Even innovative solvent systems such as Carbon Clean’s CycloneCC, which lowers capture cost to USD 30 per tonne, have yet to demonstrate economies of scale at commercial rates . Operating cost is further burdened by energy penalties that trim baseline plant efficiency 15-30%, forcing operators either to buy additional electricity or accept lower output. Access to concessional finance remains limited in developing economies, delaying uptake despite substantial emissions reduction needs. Capital intensity therefore prolongs payback periods and narrows the pool of early adopters to large corporations or state-owned enterprises capable of absorbing risk.
Growing Attractiveness of Cheaper Renewables
Solar and wind bids frequently undercut new fossil capacity, and co-located green hydrogen facilities can deliver zero-carbon feedstock without capture overhead. For power producers, adding CCS to an existing coal unit becomes less compelling when renewable generation plus storage achieves similar or lower levelized costs. As grid-scale batteries extend discharge duration, dispatchable renewables gain market share, eroding the addressable base for fossil units retrofitted with CCS. Policy frameworks that favor resource-neutral emissions reduction inadvertently intensify the technology competition, requiring CCS proponents to highlight the unique abatement of process-related emissions that renewables cannot touch.
*Our forecasts treat driver/restraint impacts as directional, not additive. The impact forecasts reflect baseline growth, mix effects, and variable interactions.
Segment Analysis
By Technology: Pre-Combustion Dominance Faces Oxy-Fuel Disruption
Pre-combustion capture accounted for 81.45% of carbon capture and storage market share in 2025 because it dovetails with steam-methane reformers and biomass gasifiers already common in refineries and chemical complexes . The segment benefits from decades of operational data and lower incremental cost when installed during greenfield builds. However, the process imposes a 20-25% energy penalty, and solvent regeneration remains capital intensive. Oxy-fuel combustion is projected to grow 18.21% CAGR to 2031, propelled by projects such as the Brevik cement plant that capture process emissions without extensive flue-gas separation. By burning fuel in pure oxygen, the exhaust stream is nearly pure CO₂, simplifying downstream compression. Technology providers are introducing modular oxy-fuel units suited for retrofit, and improved air-separation economics reinforce competitiveness against post-combustion alternatives. As heavy industries seek deep cuts with minimal efficiency loss, oxy-fuel’s market share is expected to expand quickly, challenging pre-combustion’s long-held lead in the carbon capture and storage market.


By End-User Industry: Chemical Sector Accelerates Past Traditional Leaders
Oil and gas enterprises commanded 69.05% of the carbon capture and storage market size in 2025, leveraging mature CO₂-EOR systems and extensive pipeline networks. Capture units at gas-processing plants provide immediate volumes, and geological knowledge accelerates storage site selection. Yet the chemical industry will grow 25.12% CAGR through 2031 as ammonia and methanol producers integrate blue hydrogen into existing flows to meet carbon intensity benchmarks. CF Industries’ Louisiana plant, capturing 500,000 t CO₂ per year, demonstrates competitive economics when 45Q credits combine with secured offtake agreements. Iron and steel and cement remain necessity users because process emissions cannot be avoided through fuel switching alone. Modular capture systems sized at 400 t CO₂ per day open the mid-tier industrial cluster market, broadening the install base beyond super-majors and enabling smaller chemicals, glass, and lime producers to participate in the carbon capture and storage market.
Geography Analysis
North America led with 50.72% carbon capture and storage market share in 2025, supported by generous 45Q tax credits that provide USD 85 per tonne for direct air capture and USD 60 for point-source capture. The U.S. Gulf Coast concentrates emitters, pipeline corridors, and saline aquifers, enabling hub concepts like ExxonMobil’s proposed USD 100 billion Houston Ship Channel network. Canada complements the region with an investment tax credit of 60% for DAC equipment and 50% for other capture systems, spurring joint ventures such as Strathcona Resources and Canada Growth Fund’s USD 2 billion partnership. Mexico positions itself as a cross-border transport partner, exploring shared storage solutions in depleted offshore fields.
Europe is projected to post the fastest CAGR at 26.05% between 2026-2031, underpinned by the Innovation Fund, the EU ETS, and Norway’s pioneering Longship project, which began CO₂ injection at Northern Lights in 2025. Germany’s draft CCS law removes the onshore storage ban and unlocks the North German Basin, while the Netherlands advances the Porthos hub and the UK pushes HyNet and Teesside clusters. Cross-border transport agreements are maturing, and shared infrastructure lowers unit costs for smaller industrial emitters. The combination of carbon pricing, border tariffs, and dedicated public grants accelerates private investment, ensuring that Europe closes the gap with early-moving North America.
Asia-Pacific represents the largest long-term upside, driven by China’s 2060 neutrality pledge and the first oxy-fuel cement demonstration in 2025, which validated technology fit for regional process industries. Japan is co-developing shipping routes with Australia for liquefied CO₂, linking heavy industrial zones with offshore storage in the Bonaparte Basin . Indonesia targets 15 CCS projects by 2030, leveraging abundant deep-saline aquifers, while South Korea’s Green New Deal earmarks CCS expenditure across steel and petrochemicals. The region, however, grapples with fragmented regulations and access to affordable finance, factors that may delay full-scale take-off until post-2030.

Value Chain Analysis
The CCS value chain runs from capture technology design and equipment supply to project execution, then to transport and long-term storage operations. Upstream inputs include solvents and sorbents, especially amine-based systems, catalysts and process packages integrated into hydrogen, ammonia, and methanol units, and rotating equipment such as CO2 compressors, pumps, and dehydration or compression trains. Engineering, procurement, and construction capability and specialty internals can become schedule and cost bottlenecks, which is driving supplier frameworks such as Carbon Clean's 2024 strategic supply arrangement with Julius Montz (Koch Engineered Solutions) to manufacture metal packing used in CycloneCC modular capture systems.
Midstream logistics and storage infrastructure increasingly shape project bankability, particularly where multiple emitters share transport and injection assets. Equipment specialization is also moving into marine CO2 shipping for offshore storage, as INEOS selected Svanehoej in February 2025 to supply CO2 cargo pumps for the onshore facility and a purpose-built liquefied CO2 carrier supporting Project Greensand. On the downstream side, operators and regulators emphasize measurement, monitoring, and verification, alongside long-term liability management, which increases demand for subsurface characterization, monitoring sensors, and end-to-end capture, transport, and storage assurance services. In Europe, policy attention to industrial supply chains such as under the Net-Zero Industry Act has reinforced efforts to map and scale CCUS manufacturing capacity and reduce fragmentation across these value chain nodes.
Competitive Landscape
The carbon capture and storage market features moderate concentration: the top five operators—ExxonMobil, SLB Capturi, Shell, Equinor, and TotalEnergies—control just over 45% of installed capture capacity, reflecting deep capital pools and vertically integrated project portfolios. Oil majors deploy CCS to future-proof core assets while monetizing subsurface expertise. Technology specialists such as Aker Carbon Capture, Carbon Clean, and Svante compete on modularity and cost-per-tonne metrics, often partnering with engineering-procurement-construction firms to access global projects. The formation of SLB Capturi, a 2025 joint venture between SLB and Aker Carbon Capture, typifies the shift from R&D to streamlined commercialization, bundling proprietary solvents with project execution capability[2]SLB, “SLB Capturi Joint Venture Launch Announcement,” slb.com.
Competitive intensity is further shaped by white-space opportunities in standardized 400-t-per-day units, enabling plug-and-play deployment for mid-size emitters. Carbon Clean’s CycloneCC claims a 90% footprint reduction over conventional designs, targeting cement, glass, and steel plants that lack space for large absorbers. Direct air capture specialists like Climeworks and Heirloom create a parallel submarket for negative emissions credits, diversifying revenue streams away from emitters’ balance sheets. Players that integrate capture, transport, permanent storage, and optional CO₂ utilization will gain pricing power, while pure-play equipment vendors must prove durability and performance across diverse industrial gases to maintain share.
Carbon Capture And Storage Industry Leaders
Occidental Petroleum Corporation
Exxon Mobil Corporation
Shell PLC
TotalEnergies
Equinor ASA
- *Disclaimer: Major Players sorted in no particular order


Market Opportunities and Future Outlook
Industrial decarbonization programs are creating concrete whitespace for integrated capture solutions that bundle capture equipment with transport and permanent storage access, especially for chemicals, refining, and power assets in hub geographies. One near-term opportunity is in low-carbon methanol and other CO2-intensive chemical pathways where high-purity process CO2 streams can be captured at scale; for example, INEOS Acetyls and Sandpiper Chemicals announced in April 2026 a USD 1.7 billion, 1.1 MMtpy low-carbon methanol project in Texas City that incorporates 97% process CO2 capture. In North America, large point-source capture economics are being reinforced by enabling infrastructure and storage contracting structures, including July 2025 when CF Industries started up a CO2 dehydration and compression unit at its Donaldsonville Complex in Louisiana to enable permanent sequestration of up to 2 million metric tons of CO2 per year.
A second opportunity area is the build-out of regulated, multi-user transport and storage networks that reduce risk for mid-sized emitters that cannot justify dedicated pipelines and injection wells. The UK Department for Energy Security and Net Zero published a CCS Network Code in 2025, defining commercial and technical rules for network users and transport and storage operators, while 2026 amendments to UK safety and offshore installation rules explicitly brought CCUS activities into major accident hazard frameworks, helping standardize requirements for pipeline and offshore operations. In Asia-Pacific and Oceania, clearer permitting pathways for offshore storage are opening additional addressable markets for capture projects that can move CO2 by ship, supported by updated Australian offshore CCS regulatory approvals guidance issued in March 2026 under the Offshore Petroleum and Greenhouse Gas Storage Act 2006. Across regions, modular capture packages and purpose-built CO2 shipping and pumping capacity are emerging as practical levers to shorten execution timelines and connect dispersed emitters to shared storage.
Recent Industry Developments
- February 2026: ExxonMobil started CCS operations for its New Generation Gas Gathering (NG3) project in Gillis, Louisiana. Moving a second Louisiana capture project into operations strengthens the industrial-scale operating base for capture, compression, and storage workflows in the US Gulf Coast. The milestone also supports hub-style models where existing pipelines and subsurface expertise lower barriers for additional point-source tie-ins.
- April 2025: ExxonMobil and Calpine signed an agreement for ExxonMobil to transport and store up to 2 million metric tons of CO2 per year from a natural gas power generation project. The deal extends CCS beyond traditional gas processing and EOR-linked applications into dispatchable power, expanding the addressable end-user base. It also signals growing use of third-party transport and storage contracting as a route to decarbonize assets that do not own subsurface storage.
- June 2024: Shell reached final investment decision for the Polaris CCS project at the Scotford refinery and the associated Atlas Carbon Storage Hub in Alberta, Canada. This moved a major refinery-linked capture and storage build into execution and anchored a storage hub intended to serve multiple emitters. The decision highlights the role of integrated capture-to-storage developments in accelerating commercial CCS deployment in heavy industry corridors.


Research Methodology Framework and Report Scope
Market Definition and Coverage
For this report, the market covers revenues generated from capturing CO2 from power and industrial sources, moving it for handling, and storing it in long-lived geological sites so it does not enter the atmosphere.
Scope exclusions: Carbon credit trading, general carbon consulting, and offsets certification services are not counted in this market sizing.
Segmentation Overview
- By Technology
- Pre-combustion Capture
- Post-combustion Capture
- Oxy-fuel Combustion Capture
- By End-user Industry
- Oil and Gas
- Coal and Biomass Power Plant
- Iron and Steel
- Cement
- Chemical
- By Geography
- Asia-Pacific
- China
- India
- Japan
- Australia
- South Korea
- Rest of Asia-Pacific
- North America
- United States
- Canada
- Mexico
- Europe
- Germany
- United Kingdom
- France
- Norway
- Netherlands
- Russia
- Rest of Europe
- South America
- Brazil
- Argentina
- Rest of South America
- Middle-East and Africa
- Saudi Arabia
- South Africa
- Rest of Middle-East and Africa
- Asia-Pacific
Data Sources, Market Sizing, and Validation
Desk Research
Desk research started with public datasets and policy trackers that signal CCS activity levels and project pipelines. We relied on sources such as the International Energy Agency releases on CCUS, the US Energy Information Administration for power and fuel context, the US EPA greenhouse gas reporting program for point-source emissions signals, and the European Commission and national energy regulators for permitting and incentive details.
To keep assumptions grounded, we also reviewed company annual reports, investor presentations, and public project announcements to understand commissioning timelines and funding milestones. Peer-reviewed journals and patent databases were used to gauge technology maturity and likely capture-cost direction, which helps avoid overstating near-term adoption. For trade and equipment context, an import and export shipment-level database and a company financials and intelligence subscription were used selectively. The desk sources listed here are illustrative only, and many other public sources were also referred to for data collection, validation, and clarification.
Primary Interviews and Surveys
Primary work was used to validate what is actually moving from announcement to execution, including capture capacity additions, transport and storage readiness, and likely ramp-up curves by end-user industry. We spoke with a mix of project developers, engineering and operations specialists, equipment ecosystem participants, and downstream users across APAC, EMEA, and the Americas to close gaps from desk research before finalizing the model.
Distribution of primary research fieldwork respondents
| Company type | Respondent position | Region |
|---|---|---|
| Top tier: 37% | CXOs: 13% | APAC: 44% |
| Mid tier: 44% | Functional/Unit leaders: 27% | EMEA: 33% |
| Smaller Players: 19% | Managers: 60% | Americas: 23% |
Market-Sizing & Forecasting
Sizing is built from a top-down demand pool that starts with large stationary CO2 sources and then reconstructs likely capture volumes using policy coverage, project sanction rates, and practical storage access in each region. Those volumes are converted to value using capture-service and storage-service pricing ranges that were checked through interviews, and then adjusted for realistic ramp-up after commissioning, because most projects do not run at nameplate in year one.
We then corroborated totals with selective bottom-up approximations, including roll-ups of announced and under-construction project capacities, sampled unit economics (USD per ton) by technology type, and channel checks on major equipment delivery schedules. Key inputs used in the model include CO2 point-source emissions by sector, permitted or planned storage capacity (and injection readiness), pipeline and shipping transport availability, incentive levels and contract structures, and the share of hard-to-abate industries that are pursuing capture instead of fuel switching.
Forecasts are generated using scenario analysis supported by a simple multivariate regression overlay, where variables like carbon price signals, subsidy stability, and expected final investment decisions are used to shape the adoption curve. When project-level details are incomplete, conservative utilization and delay factors are applied, and they are revisited during analyst review once new permitting or financing information becomes public.
Data Validation & Update Cycle
Model outputs are cross-checked against independent signals such as operating and planned capture capacity, policy and funding announcements, and regional storage readiness indicators, and then any large swings are investigated before sign-off. We run variance checks across regions and end-user industries so a single outlier assumption does not distort the total market.
Before publication, the draft is reviewed in steps, including a second-analyst pass that challenges input ranges and timing assumptions, followed by a final consistency check on units, currencies, and year labels. Reports are refreshed annually, and interim updates are triggered when there are material events such as a major incentive change, a large project cancellation, or a meaningful commissioning acceleration. Right before delivery, an analyst does a fresh pass so clients receive the most current view available at that time.
Mordor Intelligence's Carbon Capture and Storage Market Estimate Compared With Other Published Estimates
Published market values for CCS and the broader CCUS space often do not match because each publisher draws the market scope differently and also treats project timing in its own way. Differences usually come from whether utilization revenues are included, how early-stage projects are counted, and which price and volume assumptions are used for the same ton of CO2.
Operating capture capacity signals, sanctioned project pipelines, and region-level storage readiness are the evidence checks that keep Mordor Intelligence tied to capture and storage revenues only, which reduces over-counting from utilization add-ons and from projects that are still at concept or pre-permit stage.
Benchmark comparison
| Source | Market Size | Gaps in Research Methodology |
|---|---|---|
| Mordor Intelligence | USD 3.15 B (2026) | |
| Industry Publisher A | USD 3.40 B (2024) | Uses a broader CCUS technology framing and reports an earlier-year snapshot, so utilization-linked revenues and faster ramp assumptions can lift the value versus a storage-focused build. |
| Sustainability Advisory B | USD 4.10 B (2024) | Includes a wider set of projects at earlier development stages and may use higher average USD per ton progression without delaying volumes for permitting and infrastructure readiness. |
The spread is mainly explained by scope boundaries and how quickly volumes are assumed to ramp after a project is announced. When the model is tied back to capacity, approvals, and storage access, the resulting number stays traceable to clear inputs, and it can be repeated each year with the same steps.


Key Questions Answered in the Report
What is the current value of the carbon capture and storage market?
The carbon capture and storage market is valued at USD 3.15 billion in 2026 and is expected to reach USD 6.05 billion by 2031.
Which technology dominates the carbon capture and storage market?
Pre-combustion capture leads with 81.45% market share in 2025, mainly due to its integration into hydrogen and gasification processes.
Which end-use sector is growing fastest in adopting CCS?
The chemical sector is the fastest-growing end-user, projected to expand at a 25.12% CAGR between 2026-2031.
Why is Europe expected to post the highest regional growth for CCS?
Europe benefits from robust policy instruments such as the EU ETS and Innovation Fund and from landmark projects like Norway’s Northern Lights, driving a 26.05% regional CAGR.
What are the main restraints holding back wider CCS adoption?
High capital and operating costs, the increasing cost-competitiveness of renewables, and community resistance to on-shore CO₂ pipelines are the primary barriers.
Page last updated on:


