
Carbon Foam Market Size and Share
Market Overview
| Study Period | 2021 - 2031 |
|---|---|
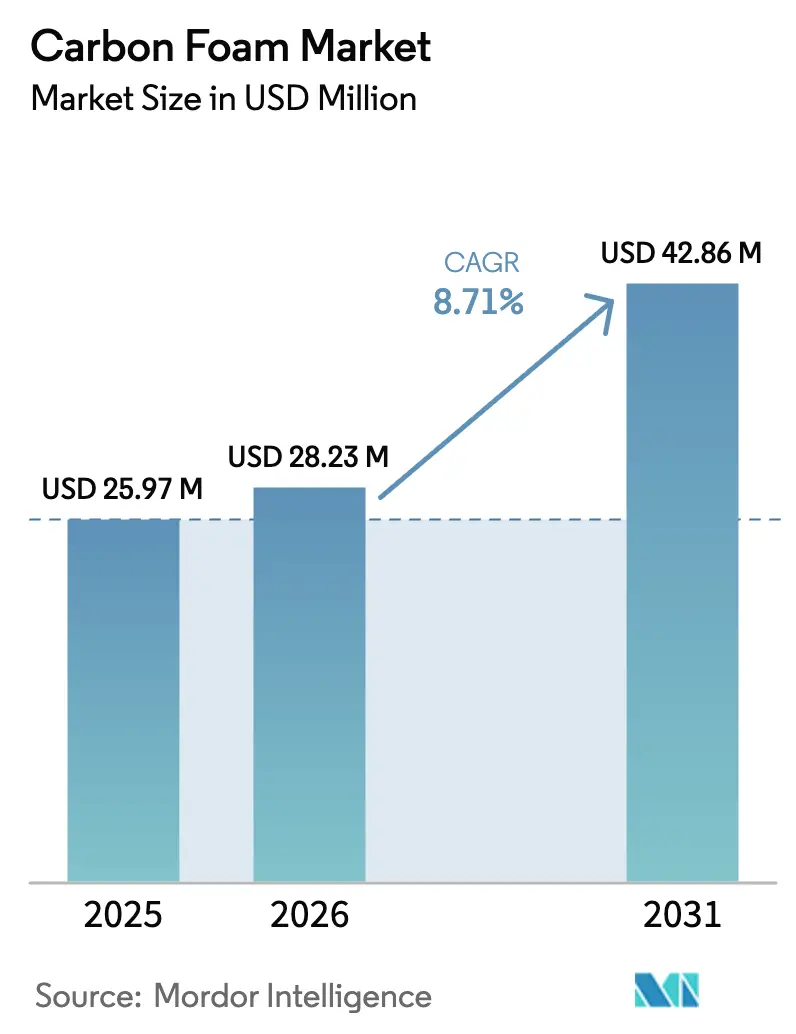
| Market Size (2026) | USD 28.23 Million |
| Market Size (2031) | USD 42.86 Million |
| Growth Rate (2026 - 2031) | 8.71 % |
| Fastest Growing Market | North America |
| Largest Market | Asia Pacific |
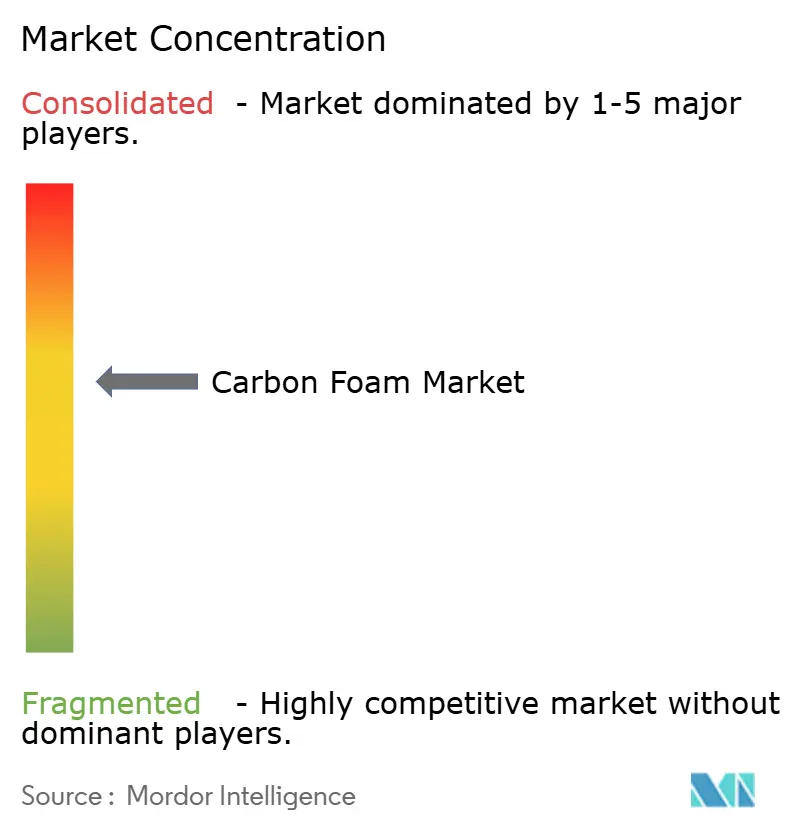
| Market Concentration | Medium |
Major Players *Disclaimer: Major Players sorted in no particular order Image © Mordor Intelligence. Reuse requires attribution under CC BY 4.0. | |
Carbon Foam Market Analysis by Mordor Intelligence
The Carbon Foam Market size was valued at USD 25.97 million in 2025 and is estimated to grow from USD 28.23 million in 2026 to reach USD 42.86 million by 2031, at a CAGR of 8.71% during the forecast period (2026-2031). Graphitic grades dominate today’s carbon foam market thanks to their superior in-plane thermal conductivity, while emerging battery, aerospace, and building-insulation uses open new revenue pools. Defense agencies continue to underwrite long-cycle demand for hypersonic thermal-protection systems, and electric-vehicle makers are turning to porous carbon architectures to dissipate the heat that fast-charging produces. Feedstock diversification into lignin and coal-extract blends offers a viable cost-compression pathway, yet the absence of harmonized foam-specific test standards still slows automotive and electronics qualification. Competitive rivalry is intensifying as incumbent carbon-fiber producers scale graphitization capacity and start-ups pursue bio-based foams with negative embodied carbon.
Key Report Takeaways
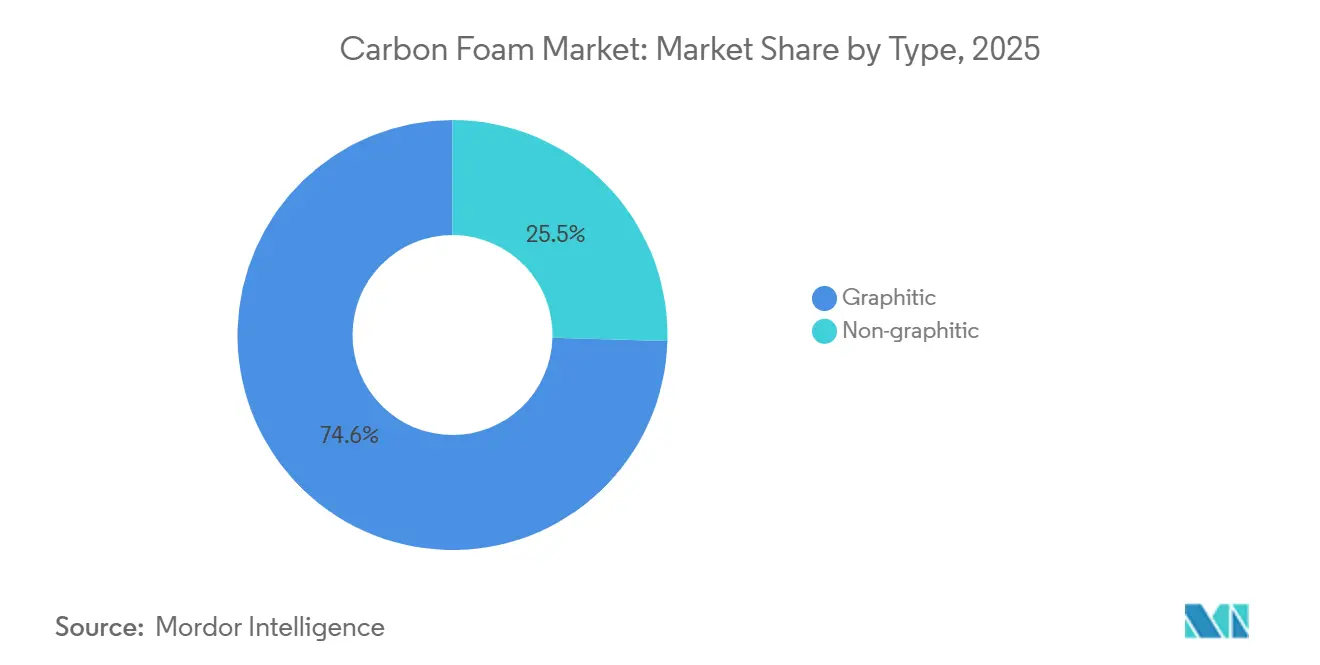
- By type, graphitic foam captured 74.55% revenue in 2025 and is forecast to advance at a 9.85% CAGR through 2031, outpacing non-graphitic grades.
- By end-user, aerospace and defence held 31.22% share of the carbon foam market size in 2025, while the same segment is projected to expand at a 9.51% CAGR to 2031.
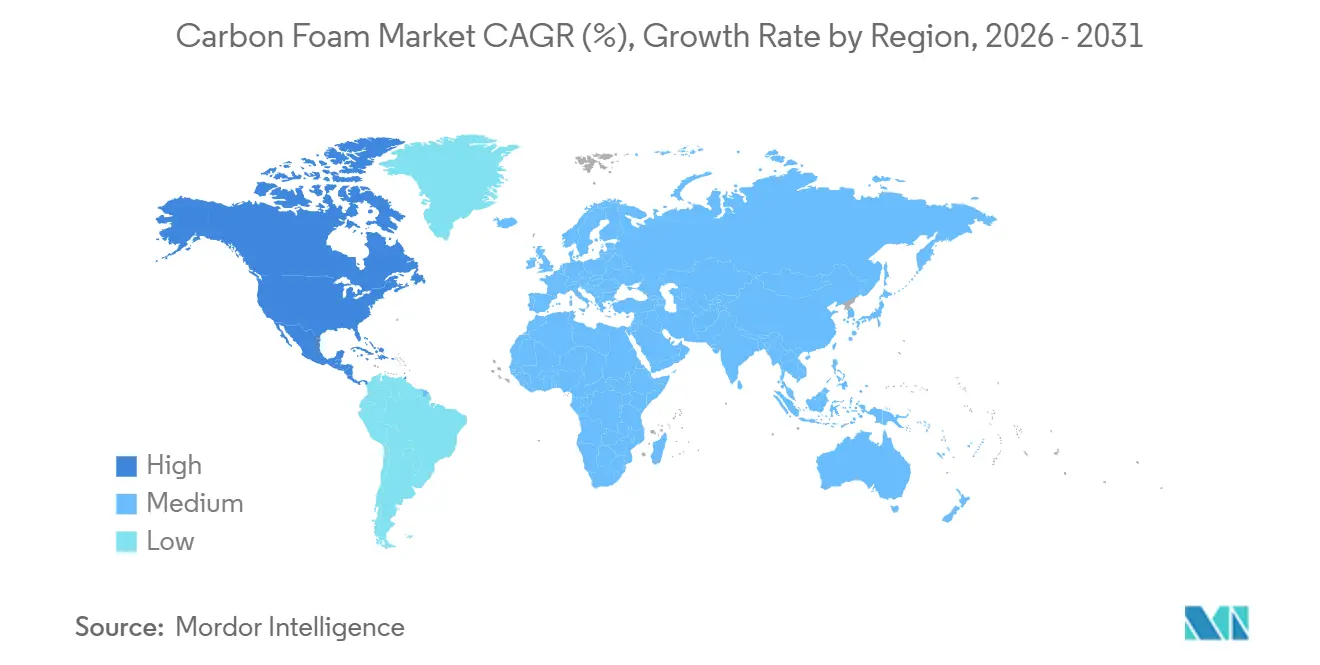
- By geography, Asia-Pacific led with 27.53% revenue in 2025; North America is positioned for the fastest regional growth at a 9.24% CAGR over the forecast period.
Note: Market size and forecast figures in this report are generated using Mordor Intelligence’s proprietary estimation framework, updated with the latest available data and insights as of January 2026.
Market Trends and Insights
Drivers Impact Analysis of Carbon Foam Market*
| Drivers | (~) % Impact on CAGR Forecast | Geographic Relevance | Impact Timeline |
|---|---|---|---|
| Increasing demand from aerospace and defence | +2.5% | North America, Europe, Asia-Pacific (Japan, South Korea) | Medium term (2-4 years) |
| Expanding thermal-management needs of power electronics | +2.0% | Global, with concentration in Asia-Pacific (China, Japan, South Korea), North America | Short term (≤ 2 years) |
| Environmental regulations favouring non-toxic, fire-resistant insulation | +1.5% | Europe, North America | Long term (≥ 4 years) |
| Rapid adoption of carbon-foam current collectors in solid-state batteries | +1.8% | Asia-Pacific (China, Japan, South Korea), North America | Medium term (2-4 years) |
| Biomass-derived carbon-foam feedstocks enabling cost reduction | +1.3% | Global, early adoption in North America, Europe | Long term (≥ 4 years) |
| Source: Mordor Intelligence | |||
Increasing Demand from Aerospace and Defence
Hypersonic vehicles endure extreme conditions, facing high heat fluxes and temperatures. Remarkably, graphitic carbon-foam cores withstand these challenges without premature ablation[1]James Klett, “Graphite Foam for Automotive Power-Electronics Cooling,” Oak Ridge National Laboratory, ornl.gov. In 2024–2025, the U.S. Air Force and Navy unveiled several SBIR topics, targeting modular carbon–carbon and carbon-foam structures. Their goal: to reduce unit costs for expendable re-entry systems. Meanwhile, in 2024, Hexcel boasted a robust backlog. This surge indicates that wide-body programs are increasingly opting for nacelle liners and wing de-icing hardware, both integrating carbon foam for enhanced directional heat transfer. This convergence of defense and commercial aerospace not only ensures multi-year volume visibility but also shields suppliers from the typical airframe cycles. As hypersonic testing gains momentum heading into the late-2020s, suppliers who can elevate their graphitization furnaces to higher temperatures stand poised to secure a significant share of emerging contracts.
Expanding Thermal-Management Needs of Power Electronics
Insulated-gate bipolar transistors in electric vehicles have reliability thresholds hovering around 150 °C. However, when combined with phase-change materials, porous carbon heat-spreaders ensure junction temperatures remain well below this limit, even at 5C discharge rates[2]National Renewable Energy Laboratory, “High-Heat-Transfer Batteries Enable Fast Charging,” nrel.gov. In trials conducted in June 2025, battery packs utilizing copper-coated carbon foam and PCM achieved a notable reduction in peak temperatures. This setup also managed to reduce the system's mass compared to traditional liquid cooling methods. Such a material switch not only lightens the load but also significantly cuts parasitic power draw. Meanwhile, data-center operators grapple with similar density challenges, especially as artificial-intelligence accelerators push out substantial heat per chip. Enter graphene-foam vapor chambers, now essential players in the thermal management strategies for inference clusters. Given the pressing need to mitigate thermal throttling in both transportation and computing realms, power-electronics cooling has emerged as the most lucrative segment for the carbon foam market.
Environmental Regulations Favouring Non-Toxic, Fire-Resistant Insulation
The revamped Energy Performance of Buildings Directive mandates that all new buildings in the EU achieve zero emissions by 2030. This push is driving up the demand for insulation materials with low thermal conductivity and minimal flame-spread indices. Carbon foam meets the stringent room-corner and radiant-panel tests without the use of brominated additives, which are known to emit toxic fumes. In the United States, HUD’s 24 CFR 3280 mirrors these fire-propagation restrictions for manufactured housing. This gives non-graphitic foam a distinct advantage over polymeric foams, which depend on halogen flame-retardants for compliance. Meanwhile, Japan's 2024 roadmap to carbon neutrality is shining a spotlight on high-density heat-storage materials. This emphasis further amplifies the regulatory demand for thermally resilient carbon foams, especially in industrial kilns and building envelopes.
Rapid Adoption of Carbon-Foam Current Collectors in Solid-State Batteries
Carbon-foam scaffolds, boasting high porosity and conductivity, are essential for solid-state lithium cells. These cells require current collectors that can absorb volumetric expansion without delaminating. NREL’s ParaThermic prototype achieved significantly higher heat removal rates than traditional prismatic designs. This advancement allows for rapid charging when paired with refrigerant cooling. Such a feat necessitates the use of high-conductivity, low-mass carbon foams in the electrode stack. In November 2025, Nanjing University validated structural energy-storage concepts. They demonstrated that foams, when coated with reduced graphene oxide, can store energy while supporting mechanical loads. This "fuselage-as-battery" architecture has the potential to replace discrete packs in logistics drones.
Restraints Impact Analysis of Carbon Foam Market*
| Restraints | (~) % Impact on CAGR Forecast | Geographic Relevance | Impact Timeline |
|---|---|---|---|
| High production cost and energy intensity | -1.5% | Global | Short term (≤ 2 years) |
| Limited supply of high-quality mesophase pitch | -1.2% | Global, acute in North America, Europe | Medium term (2-4 years) |
| Lack of global test standards delaying OEM qualification | -0.8% | Global, pronounced in automotive and electronics sectors | Medium term (2-4 years) |
| Source: Mordor Intelligence | |||
High Production Cost and Energy Intensity
Graphitizing foam demands furnace temperatures exceeding high thresholds and inert atmospheres for extended durations, consuming significant power—a draw on par with primary aluminum smelting. While CONSOL’s continuous pilot streamlines operations by merging oxidation and carbonization into a single pass, establishing an industrial line comes with substantial capital expenditure, a barrier that confines entry to well-capitalized firms. Rising gas and electricity prices in Europe squeezed SGL Carbon’s Graphite Solutions EBITDA margin, highlighting persistent margin pressures in energy-intensive locales. As long as renewable energy constitutes less than half of industrial grids, producers will grapple with fossil-fuel price volatility, hindering their competitiveness in price-sensitive sectors like construction and industrial furnace applications.
Limited Supply of High-Quality Mesophase Pitch
To spin graphitic foams, it's essential to have ash content below acceptable levels and quinoline insolubles under a specific threshold. However, only a select few petroleum FCC or coal-tar streams can achieve these benchmarks after undergoing multi-stage filtration. Transitioning university-level coal extraction research to commercial tonnage requires reconfiguring cokers and incurring a higher hydrogen consumption. This adjustment ensures feedstock tightness persists at least until the forecasted period. While Toray's expansion in Gumi boosts global capacity, it's insufficient to bridge the demand gap from aerospace, hydrogen pressure vessels, and next-gen batteries.
*Our forecasts treat driver/restraint impacts as directional, not additive. The impact forecasts reflect baseline growth, mix effects, and variable interactions.
Carbon Foam Market Segment Analysis
By Type:
Graphitic Foam Captures Aerospace Thermal BudgetsGraphitic foam accounted for 74.55% of 2025 revenue in the carbon foam market and is forecast to grow at a 9.85% CAGR to 2031, reflecting its indispensability for directional heat spreading in hypersonic skins and power inverters. At USD 28.23 million, the 2026 carbon foam market size skews heavily toward graphitized grades despite their higher energy footprint because alternative materials cannot meet 40–180 W/m·K in-plane conductivity requirements. Toray’s decision to double graphitization capacity in Japan and the United States proves that high-temperature lines remain the strategic bottleneck that commands the best margins. Oak Ridge National Laboratory’s additive manufacturing trials reached flexural strengths near 235 MPa, validating graphitic foam cores above 3,000 °C for rocket-nozzle inserts where non-graphitic foams oxidize. At the same time, non-graphitic foams maintain relevance in building insulation and furnace linings where 5–20 W/m·K conductivity suffices and price beats performance. Lignin-derived foams reaching 1,050 °C fire resistance signal that bio-based non-graphitic options could unlock large-volume construction demand once producers scale beyond pilot lots. Cost-down pressures, therefore, split the carbon foam market into a high-performance, graphitized tier and a cost-sensitive, bio-based tier that will coexist through the decade.


By End-User Industry:
Aerospace and Defence Lock in Long-Cycle DemandAerospace and defence commanded 31.22% of 2025 revenue, securing the largest carbon foam market share on the back of multi-year hypersonic and wide-body programs. The segment is projected to expand at a 9.51% CAGR, outpacing electronics and automotive, aided by SBIR-backed research that targets cost-effective carbon–carbon precursor routes. Electronics and electrical equipment are the second-largest buyers, driven by demand for heat-spreaders in power modules and high-performance computing. Automotive adoption accelerates after copper-foam PCM packs cut peak battery temperatures by 9.18 K at 5C, offering an attractive path to five-minute fast charging in commercial fleets. Building and construction uptake, while smaller today, benefits from EU zero-emission mandates and U.S. HUD fire-propagation limits that polymer foams increasingly struggle to meet without halogen retardants. Carbon foam, utilized as gas-diffusion layers and hydrogen-storage scaffolds, aligns with the U.S. Department of Energy's system-level target, underscoring its pivotal role in energy storage and fuel-cell applications. Additionally, industrial equipment's demand for carbon foam is evident in its use as low-thermal-mass furnace linings, which can reduce cycle energy consumption. This versatility solidifies a diverse and resilient end-market portfolio for suppliers.


Geography Analysis
APAC Carbon Foam Market
Asia-Pacific delivered 27.53% of 2025 revenue, underpinned by Toray’s South Korean expansion and Hyosung’s multi-country build-out aimed at hydrogen pressure vessels. Chinese and Japanese investors also advanced capacity for wind-turbine and automotive composites, reinforcing the region’s role as the production hub for global customers. Government roadmaps in Japan that prioritize high-density heat storage further elevate domestic demand for industrial thermal barriers made from carbon foam.
North America Carbon Foam Market
North America will be the fastest-growing region at a 9.24% CAGR through 2031. U.S. defense agencies fund hypersonic vehicle programs that insist on graphitic foams for 5,000 °F heat shields, while commercial aerospace backlogs stretch to the decade’s end.
Europe Carbon Foam Market
Europe blends strong aerospace activity with stringent building-energy codes that favor non-toxic, fire-safe insulation. Energy-price volatility compressed graphite-solutions margins in 2024, yet circular-economy policies catalyzed investment in recycling lines that recover carbon-fiber scrap for foam production at up to 95% lower carbon footprint. These moves, coupled with the EPBD’s zero-emission trajectory, create a dual pull for high-end aerospace foams and low-cost building foams, positioning Europe as both a technology incubator and a regulatory driver.

Regulatory Landscape
Carbon foam qualification is shaped more by cross-cutting fire-safety, building-product, and materials test regimes than by foam-specific global standards, and the resulting patchwork continues to lengthen OEM approval cycles. In Europe, the construction pathway increasingly routes through EU building-product frameworks and third-party assessments; for example, Rothoblaas issued a European Technical Assessment (ETA-26/0349) in May 2026 for a fire-penetration sealing application using graphite foam technology. The decision highlights how fire-resistance performance and documented conformity are becoming central to building-envelope adoption.
On the manufacturing side, process safety and environmental compliance are tightening for high-temperature carbon and graphite operations, especially in major producing regions. In China, the Ministry of Emergency Management implemented AQ 7028-2025 as a mandatory safety specification for the production of graphite and carbon products, pushing producers to formalize controls for furnaces, inert atmospheres, dust management, and chemical handling. Across end uses, carbon-foam suppliers frequently reference established test methods and fire standards, such as ASTM density and mechanical-property methods and ISO non-combustibility approaches, as the practical baseline for customer qualification where harmonized carbon-foam-specific standards are still not universal.
Value Chain Analysis
The carbon foam value chain starts with carbonaceous precursors and additives, most commonly mesophase pitch and other pitch and polymers for graphitic grades, and biomass or coal-extract blends for non-graphitic routes. These inputs go into foaming (often under controlled temperature and pressure), stabilization and oxidation, carbonization, and then graphitization for high-conductivity products. Within this sequence, graphitization furnaces and reliable mesophase-pitch supply act as recurring bottlenecks. In 2026, Touchstone Advanced Composites expanded its Triadelphia, West Virginia, facility, adding cleanroom space for composite tooling production, which points to near-term tooling-capacity build-out linked to carbon-foam architectures.
Downstream, converters and fabricators machine, coat, or laminate foam into components such as thermal spreaders, heat exchangers, tooling, structural cores, and fire-safe insulation elements, then test them against customer and sector standards. Distribution is typically direct to aerospace and defense buyers and to electronics and thermal-management integrators, while construction adoption often requires third-party documentation and code-aligned performance testing. End-user qualification and the lack of universally adopted carbon-foam-specific test protocols remain a friction point, particularly for automotive and electronics supply chains that need repeatable supplier quality systems and standardized property reporting.
Competitive Landscape
The carbon foam market is moderately consolidated in nature. Mid-tier players carve out niches in reticulated foam and graded-density cores for low-volume, high-margin programs. Start-ups are focusing on lignin-derived or biochar foams that undercut polymeric insulation on both cost and embodied carbon, a proposition that could steal share in construction if performance certification aligns with building codes. Process innovation remains key: University of Kentucky’s coal-extract blend nearly doubled mesophase-pitch yield, a breakthrough that could ease feedstock constraints without massive greenfield spend. Overall, the competitive field is widening as green-precursor and recycling pathways lower entry barriers outside aerospace’s qualification moat.
Carbon Foam Industry Leaders
Touchstone Advanced Composites
Entegris Inc.
ERG Aerospace
Koppers Inc.
Ultramet
- *Disclaimer: Major Players sorted in no particular order
Carbon Foam Market Companies Covered in this Report
- American Elements
- Beijing Jingke Xingye Technology Development Co., Ltd.
- Carbon-Core Corporation
- CONSOL Energy Inc.
- Entegris Inc.
- ERG Aerospace
- Evonik Industries
- Goodfellow Cambridge Ltd.
- Graphite India Limited
- Hexcel Corporation
- Koppers Inc.
- SGL Carbon
- TORAY CARBON MAGIC CO., LTD
- Touchstone Advanced Composites
- Ultramet
- Xiamen Zopin New Material Limited

Market Opportunities and Future Outlook
A white-space opportunity is emerging at the intersection of fire-safe building materials and verified compliance routes. Europe provides a tangible pull through building-product conformity and fire-penetration requirements, and actions such as Rothoblaas securing ETA-26/0349 in May 2026 for a graphite-foam-based fire sealing application suggest where carbon foam can be specified as a performance material rather than a specialty substitute. The channel favors suppliers that can package foam performance with documented fire testing and installable system designs, which reduces adoption friction for specifiers and contractors.
On the technology side, the most actionable opportunities concentrate on cost and manufacturability improvements that broaden the addressable base beyond long-cycle aerospace programs. Publicly documented work on continuous, atmospheric-pressure production of coal-based carbon foam, along with 2026 research demonstrating in-situ foamed carbon-fiber and carbon-foam composite insulation in an industrial silicon monocrystalline furnace (including measured reductions in seeding power), supports a shift toward process-integrated foam components in industrial thermal systems. Separately, 2026 publications on biomass-derived and green-foaming approaches, including stepwise carbonization using alkaline salts as foaming and activation agents and porous carbon derived from Kraft black liquor for radar-absorbing performance, indicate active R&D pathways tied to lower-cost precursors and differentiated functionality. That body of work maps to carbon foam applications in thermal management, EMI and RF attenuation, and multifunctional structures where part-count reduction is valued.
Recent Industry Developments in Carbon Foam Market
- May 2026: Touchstone Advanced Composites announced a collaboration with Northrop Grumman to support development of the YFQ-48A Talon Blue Collaborative Combat Aircraft, supplying CFOAM tooling material and related structural parts. The program linkage ties carbon-foam-based tooling and structures to a named next-generation defense platform, supporting long-cycle demand visibility. It also reinforces qualification momentum for specialty foam solutions in high-precision aerospace manufacturing.
- April 2026: Touchstone Advanced Composites completed a physical expansion of its Triadelphia, West Virginia, manufacturing facility, increasing footprint and tripling cleanroom space for composite tooling production. The added controlled-environment capacity strengthens throughput and repeatability for aerospace-grade tooling and components that use carbon foam architectures. It also signals investment in domestic capability to support defense and commercial aerospace programs.
- December 2024: Koppers Inc. confirmed plans to discontinue phthalic anhydride production in Illinois during 2025, affecting availability of an intermediate used in select carbon foam chemistries. The planned shutdown tightens supply options for formulations that depend on this value-chain input and can trigger reformulation or alternate sourcing work. Such feedstock shifts increase the importance of diversified precursor pathways, including biomass- and coal-extract-based routes.


Carbon Foam Market Report Scope and Research Methodology
Market Definition and Coverage
For this study, the carbon foam market covers revenue generated from selling carbon foam materials used for thermal management, lightweight structural uses, insulation, and energy related applications across industries, tracked on a value basis in USD.
Scope exclusions: We exclude downstream finished parts where carbon foam is only a small internal component and the selling price is mainly driven by other materials or assembly work.
Segments Covered in This Report
- By Type
- Graphitic
- Non-graphitic
- By End-user Industry
- Aerospace and Defence
- Electronics and Electrical
- Automotive and Transportation
- Building and Construction
- Energy Storage and Fuel Cells
- Industrial Equipment
- Other End-users
- By Geography
- Asia-Pacific
- China
- India
- Japan
- South Korea
- ASEAN Countries
- Rest of Asia-Pacific
- North America
- United States
- Canada
- Mexico
- Europe
- Germany
- United Kingdom
- France
- Italy
- Spain
- NORDIC Countries
- Russia
- Rest of Europe
- South America
- Brazil
- Argentina
- Rest of South America
- Middle East and Africa
- Saudi Arabia
- South Africa
- Rest of Middle East and Africa
- Asia-Pacific
Data Sources, Market Sizing, and Validation
Desk Research
To set a clean starting point, we first mapped the carbon foam value chain, typical end uses, and what drives pricing and volumes. Public sources were used to anchor the demand context and adoption signals, such as USGS materials information, US Census trade statistics, Eurostat industrial data, IEA energy storage publications, and NASA or DoD publicly released technical notes where carbon thermal materials are discussed.
We then cross-checked supply side signals using company filings, investor presentations, product datasheets, and press releases, followed by patent databases to understand where R and D is moving in terms of foam grades and processing. When needed, we also used paid subscriptions for company financials and intelligence, news and financials, and patent coverage to fill gaps in privately held revenue splits and timeline events. The sources listed here are illustrative, and many other public and paid references were used for data collection, validation, and clarification.
Primary Interviews and Surveys
Primary work focused on validating where carbon foam is specified in purchasing processes across aerospace and defense, electronics thermal management, batteries, and industrial equipment. We spoke with a mix of material suppliers, converters, distributors, and large end users, and we used these discussions to confirm realistic ASP ranges, qualification lead times, and how quickly new programs move from trials to repeat orders across regions.
Distribution of primary research fieldwork respondents
| Company type | Respondent position | Region |
|---|---|---|
| Top tier: 29% | CXOs: 13% | APAC: 45% |
| Mid tier: 57% | Functional/Unit leaders: 42% | EMEA: 35% |
| Smaller Players: 14% | Managers: 45% | Americas: 20% |
Market-Sizing & Forecasting
Sizing starts with a top-down build where demand pools were reconstructed from end-use industries that regularly require high heat dissipation and low weight, then filtered through estimated carbon foam penetration by use case. Those totals were corroborated with selective bottom-up checks, mainly by rolling up supplier and channel indications, and by using sampled shipment volumes multiplied by realistic ASP bands to adjust the final number.
In the model, a few practical inputs matter a lot, such as qualification cycles in aerospace and defense programs, EV and stationary storage build activity that influences thermal management materials, the split between graphitic and non-graphitic grades (which changes pricing), and capacity additions or yield constraints that affect availability. We also track application mix shifts, because electronics and battery uses tend to pull different foam thicknesses and performance specs, which show up in ASP movement.
For forecasting, scenario analysis was used so that adoption rates and pricing can be flexed around base case expectations shared by interviewees, and then stress tested against known program timing. Where bottom-up visibility was thin in smaller regions, we used proxy indicators like industrial output trends and import patterns, followed by expert checks to avoid overstating early stage demand.
Data Validation & Update Cycle
Our checks run in layers, so any single input does not over-influence the outcome. The model outputs are compared against independent signals such as known capacity announcements, trade flow direction, and the pace of new program wins discussed in interviews, and then outliers are reviewed again before sign-off.
A second analyst review is done for key assumptions, followed by selective re-contact when a number looks inconsistent with the demand story or when pricing changes faster than expected. Reports are refreshed annually, and interim updates are triggered when material events occur, such as sharp feedstock cost swings, meaningful capacity changes, or new regulations affecting end-use industries. Right before delivery, a final pass is completed so clients receive the most current view available.
Mordor Intelligence's Carbon Foam Market Size Measured Against Other Published Estimates
Published carbon foam market numbers can look far apart because the category sits close to several adjacent materials, and each publisher draws the line differently. The timing of FX conversion, the way ASP progression is handled across grades, and how often assumptions are refreshed also create visible swings in USD values.
In practice, gaps usually come from whether estimates include fabricated components versus just the foam material, and whether battery and electronics use is counted only after qualification or already at prototype stage. By refreshing FX timing and re-checking ASP bands for graphitic versus non-graphitic grades during each update cycle, the 2026 total is kept stable and comparable over time, which is a key reason the USD 28.23 M (2026) figure differs in some tables, a modeling choice applied by Mordor Intelligence.
Benchmark comparison
| Source | Market Size | Gaps in Research Methodology |
|---|---|---|
| Mordor Intelligence | USD 28.23 M (2026) | |
| Trade Journal A | USD 19.17 M (2022) | Uses an earlier base year and a shorter horizon, and it does not clearly separate prototype demand from qualified production programs, which can compress the value reported. |
| Market Tracker B | USD 0.92 M (2025) | Appears to rely on a narrow supplier and application capture, and the resulting scale suggests partial coverage of carbon foam grades or end uses, which materially understates total market value. |
The comparison shows that most variance is explained by scope boundaries and timing choices, not by a simple disagreement on growth direction. When the same demand pool is defined consistently, and pricing is tied to grade level specs and updated currency timing, the estimate becomes easier to audit and repeat year after year.


Key Questions Answered in the Report
What CAGR is expected for the carbon foam market through 2031?
The carbon foam market is forecast to expand at an 8.71% CAGR between 2026 and 2031 and reach USD 42.86 million by 2031.
Which segment currently leads carbon-foam demand?
Graphitic foam leads, generating 74.55% of 2025 revenue due to its high thermal conductivity.
Why is North America the fastest-growing region?
U.S. defense spending on hypersonic vehicles and a robust commercial-aerospace backlog together drive a 9.24% regional CAGR.
How do environmental regulations affect carbon-foam adoption?
EU and U.S. building codes favor non-combustible, low-toxicity insulation, directly benefiting carbon-foam producers.
Which industries beyond aerospace show strong potential for carbon foam?
Power-electronics cooling, solid-state batteries, and building insulation represent rapid-growth opportunities thanks to carbon foam’s heat-spreading and fire-resistant traits.
Page last updated on:


 Your data is secure and never sold or shared.


