Carbon Dioxide Incubator Market Size and Share
Market Overview
| Study Period | 2019 - 2030 |
|---|---|
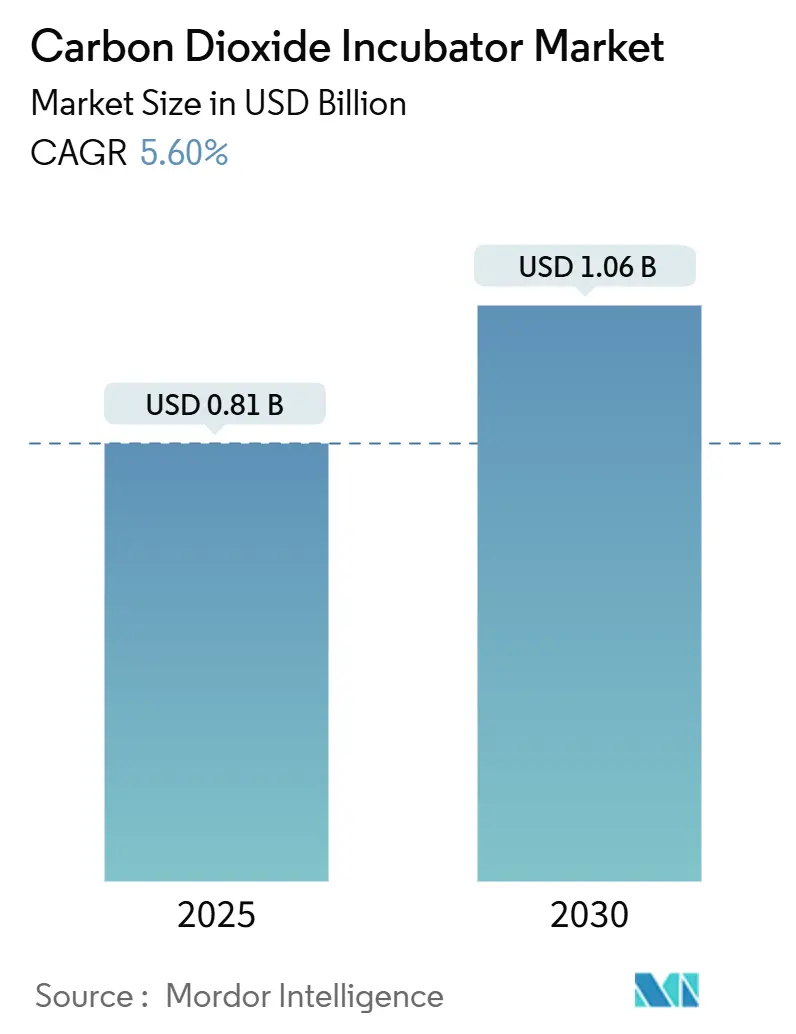
| Market Size (2025) | USD 0.81 Billion |
| Market Size (2030) | USD 1.06 Billion |
| Growth Rate (2025 - 2030) | 5.60% CAGR |
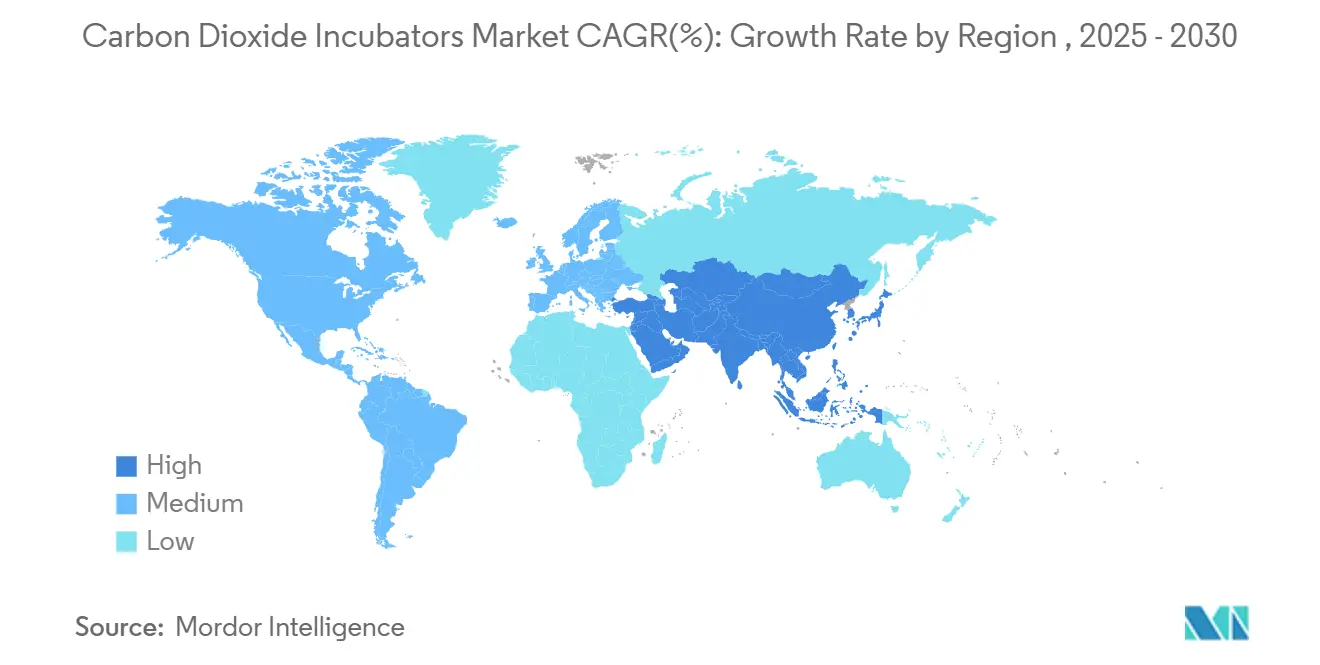
| Fastest Growing Market | Asia Pacific |
| Largest Market | North America |
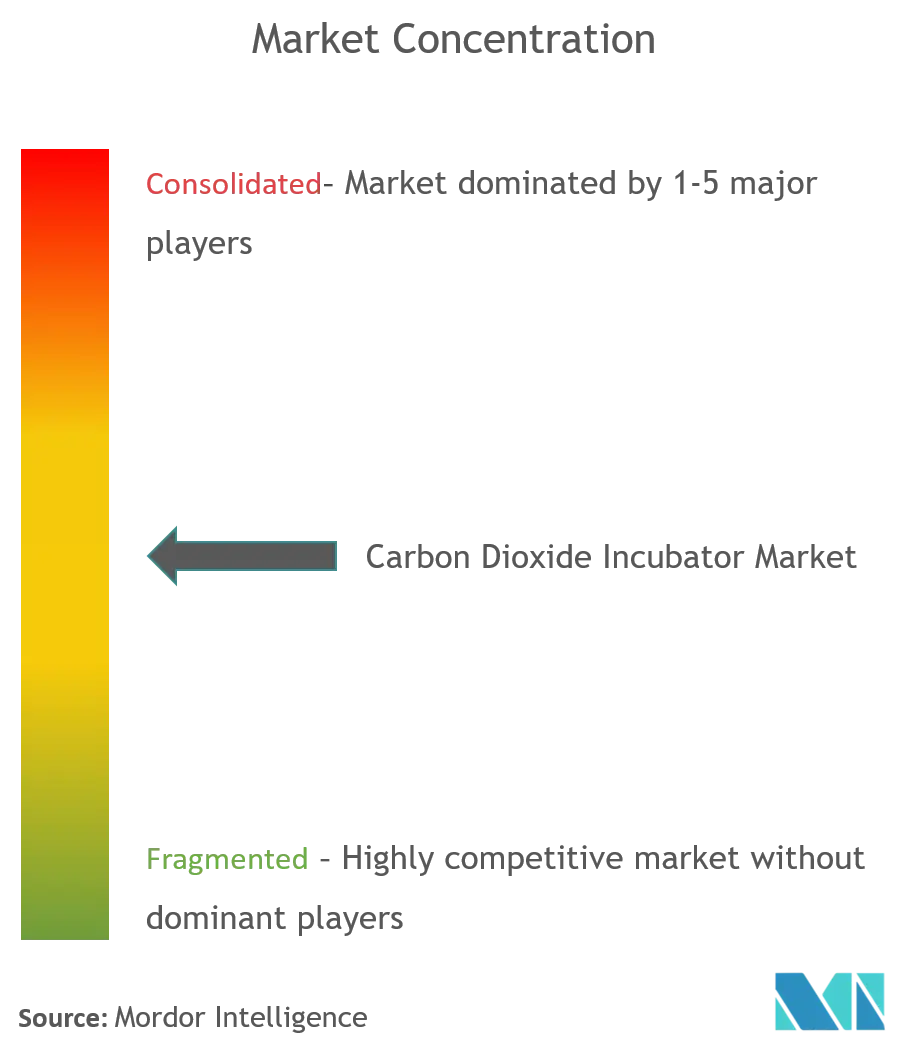
| Market Concentration | High |
Major Players *Disclaimer: Major Players sorted in no particular order Image © Mordor Intelligence. Reuse requires attribution under CC BY 4.0. | |
Carbon Dioxide Incubator Market Analysis by Mordor Intelligence
The CO₂ incubator market stands at USD 808.36 million in 2024 and is projected to reach USD 1,061.51 million by 2030, advancing at a 5.6% CAGR. Consistent expansion in cell and gene therapy pipelines, tighter contamination-control regulations, and laboratory automation initiatives sustain demand even in budget-constrained academic settings. Higher biopharmaceutical R&D outlays, the move toward allogeneic cell-therapy manufacturing, and energy-efficiency rules that favor direct-heat designs further reinforce the growth outlook. Multinational suppliers respond with advanced sensors, remote monitoring, and AI-ready interfaces that align with self-driving laboratory concepts. Regional momentum differs: mature North American facilities focus on upgrade cycles while fast-growing Asian sites add first-time capacities, collectively shaping the CO₂ incubator market trajectory.
Key Report Takeaways
- By product type, water-jacketed models held 45.45% of CO₂ incubator market share in 2024; direct-heat variants are forecast to grow at 6.23% CAGR through 2030.
- By capacity, the 100–200 L segment led with 41.23% revenue share in 2024, whereas units below 100 L are set to expand at 6.89% CAGR to 2030.
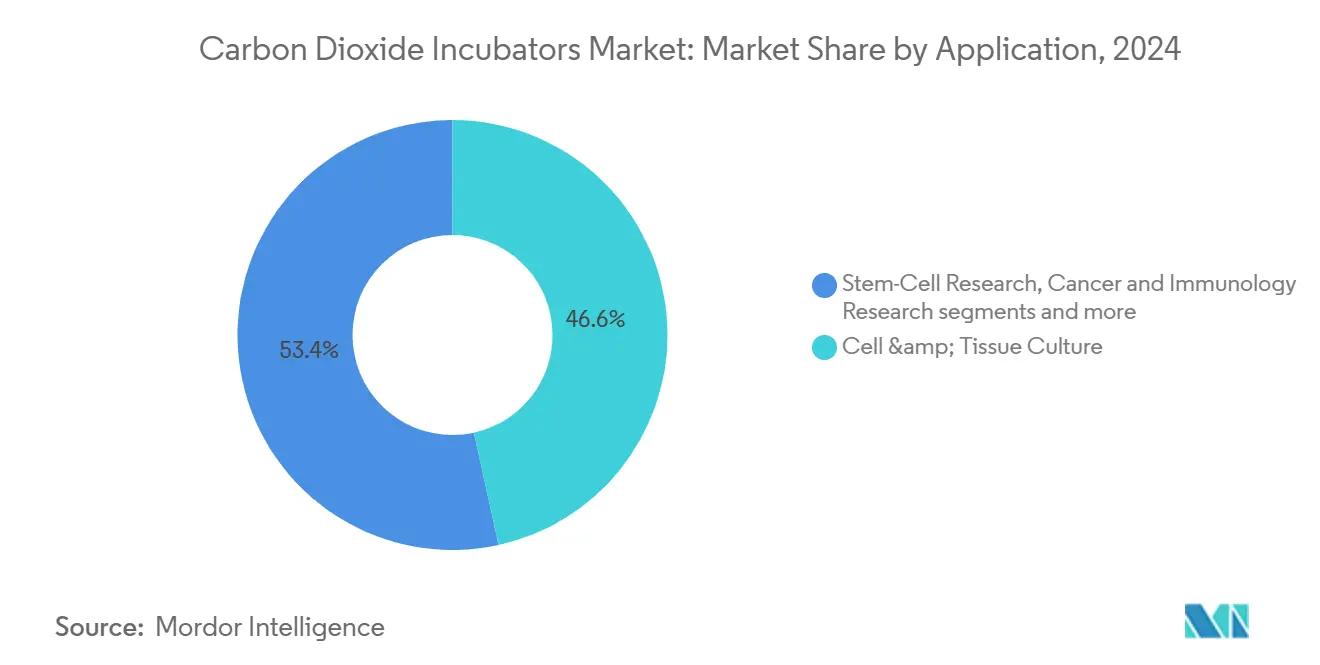
- By application, cell and tissue culture accounted for 46.56% of the CO₂ incubator market size in 2024, while stem-cell research is poised for 7.12% CAGR growth.
- By end user, pharmaceutical and biotechnology companies commanded 51.22% share of the CO₂ incubator market size in 2024; CDMOs represent the fastest track at 7.89% CAGR.
- By geography, North America led with 38.89% share of the CO₂ incubator market in 2024, and Asia-Pacific is projected to post a 7.45% CAGR through 2030.
Global Carbon Dioxide Incubator Market Trends and Insights
Driver Impact Analysis*
| Driver | (~) % Impact on CAGR Forecast | Geographic Relevance | Impact Timeline |
|---|---|---|---|
| Cell & gene-therapy process development | +1.8% | North America, EU, global spill-over | Medium term (2-4 years) |
| Rising biopharma R&D expenditure | +1.5% | Global, APAC emerging | Long term (≥4 years) |
| Growing IVF procedure volumes | +1.2% | APAC highest growth, global presence | Medium term (2-4 years) |
| Expansion of cell-based vaccine manufacturing | +0.9% | North America, EU core, APAC follow-up | Short term (≤2 years) |
| Shift to automated micro-incubators | +0.7% | North America, EU, selective APAC | Medium term (2-4 years) |
| Regulatory push for single-use chambers | +0.6% | EU leading, global adoption | Long term (≥4 years) |
| Source: Mordor Intelligence | |||
Rising Demand for Cell & Gene-Therapy Process Development
Escalating therapy pipelines in oncology and rare diseases raise the need for incubation environments that guarantee tight temperature and gas uniformity. Sartorius projects biopharma growth near 10% CAGR for 2024-2028, with cell and gene therapies outpacing traditional biologics[1]Source: Sartorius Group, “IR Presentation,” sartorius.com. As programs transition from autologous to allogeneic formats, batch sizes increase, driving procurement of larger, contamination-free chambers. Manufacturers embed traceability software to satisfy evolving GMP-level documentation. The CO₂ incubator market thereby gains recurring demand from both development and commercial-scale facilities.
Surge in Biopharma R&D Expenditure Worldwide
Despite selective funding headwinds, global R&D pipelines remain robust, and major suppliers continue to post multibillion-dollar revenues. Thermo Fisher reported USD 10.36 billion in Q1 2025, underscoring sustained purchasing power among commercial labs. Higher spending priorities include automation platforms and connected equipment, prompting incubator designs that transmit real-time performance data. AI-enabled monitoring reduces manual checks, helping laboratories meet throughput goals while maintaining compliance.
Growing Global IVF Procedure Volumes
Asia-Pacific markets exhibit the most dynamic growth patterns, with India experiencing particularly rapid expansion as 60-70 new fertility clinics open annually, driving organized market share from 0% to 40% over the past decade. Infertility now affects approximately 17.5% of the global adult population, with 1 in 6 couples experiencing fertility challenges, creating sustained demand for specialized laboratory equipment including advanced CO₂ incubators capable of maintaining optimal embryonic development conditions. The expanding network of assisted-reproduction clinics increasingly demands compact, energy-efficient CO₂ incubators with tri-gas configurations and rapid-recovery capabilities to minimize pH fluctuations during critical embryo culture periods.
Expansion of Cell-Based Vaccine Manufacturing
Lessons from recent pandemic responses accelerate movement away from egg-based platforms toward cell-based systems. This shift requires high-volume incubators that uphold sterility during long production cycles. Updated EU GMP Annex 1 guidelines raise the bar on closed-system operations, incentivising single-use interiors and automated decontamination susupport.com. Emerging markets in Asia establish regional production hubs, stimulating incremental demand for scalable incubation fleets within the CO₂ incubator market.
Restraint Impact Analysis*
| Restraint | % Impact on CAGR Forecast | Geographic Relevance | Impact Timeline |
|---|---|---|---|
| High capital & maintenance costs of advanced units | -0.80% | Global, with higher impact in emerging markets | Medium term (2-4 years) |
| Persistent contamination-risk perception among labs | -0.50% | Global, with concentration in cost-sensitive segments | Short term (≤ 2 years) |
| Stringent energy-efficiency directives for legacy models | -0.40% | North America & EU core, expanding to APAC | Long term (≥ 4 years) |
| Supply-chain dependence on specialty CO₂ sensors | -0.30% | Global, with acute impact in APAC manufacturing hubs | Medium term (2-4 years) |
| Source: Mordor Intelligence | |||
High Capital & Maintenance Costs of Advanced Units
Leading models integrate UV sterilization, HEPA filtration, and IoT-ready sensors, raising list prices and service contracts. Bio-Rad cited softer instrument demand from academia in Q1 2025, linking slower upgrades to limited grant cycles. Energy-efficiency redesigns, required under new DOE rules effective 2029, also inflate manufacturing expenses[2]Source: U.S. Department of Energy, “Energy Conservation Standards for Miscellaneous Refrigeration Products,” federalregister.gov . Smaller facilities defer purchases, stretching replacement timelines.
Persistent Contamination-Risk Perception Among Labs
Complex multigas units can appear intimidating to personnel without advanced training. Even with built-in hydrogen-peroxide or UV-cycle sterilization, operators remain wary of costly batch losses, especially for irreplaceable primary cells. Regulatory audits heighten attention on surface integrity and airflow validation, causing some labs to cling to older, well-understood models. Manufacturers respond with simplified user interfaces and guided maintenance prompts to ease adoption.
*Our forecasts treat driver/restraint impacts as directional, not additive. The impact forecasts reflect baseline growth, mix effects, and variable interactions.
Segment Analysis
By Product Type: Water-Jacketed Dominance Faces Direct-Heat Challenge
Water-jacketed systems captured 45.45% of the CO₂ incubator market in 2024 thanks to unmatched thermal inertia that protects sensitive cultures during door openings. Yet energy-focused procurement policies spur rising preference for direct-heat units, projected to grow 6.23% annually through 2030 as laboratories prioritize lower running costs and simpler upkeep. Upcoming U.S. energy-conservation standards, set for compliance in 2029, will likely speed conversion to direct-heat architecture .
Direct-heat models eliminate water reservoirs, reducing contamination vectors and downtime. Suppliers now integrate adaptive PID controls and miniaturized ScAlN-based CO₂ sensors that improve recovery times. Tri-gas variants also register accelerating demand for hypoxic research. Portfolio breadth positions vendors to upsell accessories and service plans, reinforcing the CO₂ incubator market growth path.


By Capacity: Mid-Range Dominance with Small-Scale Growth
Chambers between 100 L and 200 L yielded 41.23% of 2024 revenue, confirming their sweet spot between sample throughput and lab-space economics. This segment benefits from retrofits in existing pharmaceutical suites, where infrastructure constraints limit adoption of larger formats. Units below 100 L, however, represent the fastest expanding niche at a 6.89% CAGR, reflecting the proliferation of precision-medicine and point-of-care workflows that require localized, small-batch culture environments.
Automation pushes capacity selection toward modularity. Self-driving laboratory prototypes reveal how multiple compact incubators can operate in parallel, trading volume for flexibility while feeding robotic handlers. As a result, the CO₂ incubator market size for sub-100 L systems could widen beyond traditional academic demand into hospital and diagnostics settings. Vendors answer with stackable footprints and cloud dashboards that balance productivity and footprint.
By Application: Cell Culture Leadership with Stem-Cell Acceleration
Cell and tissue culture maintained 46.56% of the CO₂ incubator market size in 2024, underlining its centrality to drug-discovery and quality-control protocols. Standardized methods, consumable compatibility, and well-trained technicians sustain stable repeat orders. Stem-cell research, meanwhile, exhibits a 7.12% growth pace to 2030 as regulatory clearances for regenerative therapies multiply. Hypoxic tri-gas environments, real-time CO₂/O₂ feedback loops, and ultra-clean surfaces form baseline purchasing criteria in this field.
Cancer immunology and vaccine work also employ advanced systems to ensure metabolic stability across long culture times. IVF laboratories embrace compact, rapid-recovery chambers that secure embryo viability. Collectively these segments diversify revenue streams and spread demand across academic, clinical, and industrial buyer pools, cushioning the CO₂ incubator industry against cyclical slowdowns elsewhere.
By End User: Pharma Dominance with CDMO Acceleration
Pharmaceutical and biotechnology companies generated 51.22% of 2024 turnover, driven by robust biologics pipelines and quality-control obligations. High-volume suites require stringent validation and service contracts, favoring established suppliers. CDMOs register the quickest rise at 7.89% CAGR through 2030 as originator firms outsource manufacturing to asset-light partners. The resulting facility expansion cycles directly enlarge the CO₂ incubator market.
Academic centers and governmental institutes maintain significant install bases but face tightening funding, extending equipment lifetimes. IVF clinics and hospital labs increase purchases to support growing fertility-service activity. Across segments, total cost of ownership—including energy, downtime, and compliance—is now a primary selection metric, influencing brand loyalty and upgrade timing
Geography Analysis
North America contributed 38.89% of 2024 revenue, reflecting deep biopharmaceutical supply chains, well-funded universities, and early adoption of energy-efficient retrofits. Replacement demand dominates, with buyers trading older water-jacketed units for direct-heat models that meet forthcoming DOE standards. Service networks and aftermarket parts availability further cement vendor positions.
Europe retains a sizable share through strict contamination-control rules and sustainability directives. The 2024 EU ecodesign regulation mandates durability and repairability criteria, nudging buyers toward premium models with documented lifecycle assessments. Pharmaceutical clusters in Germany, Ireland, and Scandinavia anchor recurring demand, while government grants encourage deployment of smart sensors for energy tracking.
Asia-Pacific shows the sharpest trajectory at 7.45% CAGR as China, India, and South-East Asia scale biologics manufacturing and fertility clinics. Lower labor costs attract CDMO facilities that install large fleets of incubators, favouring suppliers with regional service centers. Local regulations increasingly mirror Western GMP norms, accelerating adoption of single-use interiors and advanced decontamination functions. Combined, these dynamics reinforce the CO₂ incubator market momentum across emerging economies.

Competitive Landscape
The market remains moderately fragmented, though leading brands leverage R&D scale and global support hubs to widen moats. Thermo Fisher sustains multibillion-dollar quarterly sales that fund frequent upgrades such as AI-driven monitoring modules. Panasonic Healthcare channels HVAC know-how into CO₂ incubator energy-savings and door-seal ergonomics. Eppendorf focuses on intuitive interfaces aimed at academic labs.
Rising regulatory emphasis on power consumption encourages vendors to publicize kilowatt-hour savings, positioning compliant models ahead of 2029 DOE deadlines. Binder promotes water-free direct-heat platforms paired with UV decontamination cycles. Smaller innovators explore miniaturized CO₂ sensors to shrink form factors and reduce warm-up times.
Strategic moves include Thermo Fisher’s early-2025 release of energy-saving centrifuges that complement sustainable incubator portfolios, Panasonic’s battery-focused investments that indirectly advance thermal-management expertise, and Binder’s F-Gas compliant product line aligned with new EU refrigerant rules. Partnerships with automation specialists allow incumbents to integrate robotic arms and LIMS connectivity, deepening account stickiness within the CO₂ incubator market
Carbon Dioxide Incubator Industry Leaders
Eppendorf AG
Panasonic Healthcare Co.
Thermo Fisher Scientific Inc.
Sheldon Manufacturing Inc.
BINDER GmbH
- *Disclaimer: Major Players sorted in no particular order

Recent Industry Developments
- May 2021: Esco launched Esco CelCulture CO2 Incubator with High Heat Sterilization (CCL-HHS). This new product adopts a 180°C dry heat sterilization system, proven effective in normally killing resistant fungi, bacterial spores, and vegetative cells that may contaminate the workspace.
- March 2023: Eppendorf introduced the VisioNize Lab Suite digital management platform for laboratory devices, enabling remote monitoring, device alarm notifications, and modular digital services to enhance sample security and regulatory compliance in CO₂ incubator operations.


Research Methodology Framework and Report Scope
Market Definitions and Key Coverage
Our study views the carbon dioxide incubator market as all factory-built equipment that maintains controlled temperature, humidity, and 5 % CO2 (or multi-gas) atmospheres for live-cell, microbial, and embryology work in research, biopharma, clinical, and food-testing laboratories. Units may be water-jacketed, air-jacketed, direct-heat, or tri-gas varieties and are valued new, at ex-factory USD prices.
Scope exclusions include refurbished or rental incubators and simple anaerobic jars, which are outside our accounting.
Segmentation Overview
- By Product Type
- Water-Jacketed CO₂ Incubator
- Air-Jacketed CO₂ Incubator
- Direct-Heat CO₂ Incubator
- Multi-Gas (Tri-Gas) Incubator
- Portable / Benchtop Incubator
- Customized & Other Types
- By Capacity
- Less than 100 L
- 100 – 200 L
- More than 200 L
- By Application
- Cell & Tissue Culture
- Stem-Cell Research
- Cancer & Immunology Research
- In-Vitro Fertilisation (IVF)
- Microbiology & Diagnostics
- Other Emerging Applications
- By End User
- Pharmaceutical & Biotechnology Companies
- Contract Development & Manufacturing Organisations (CDMOs)
- Research & Academic Institutes
- Clinical & IVF Laboratories
- Food-Testing & Environmental Labs
- By Geography
- North America
- United States
- Canada
- Mexico
- South America
- Brazil
- Argentina
- Rest of South America
- Europe
- Germany
- United Kingdom
- France
- Italy
- Spain
- Russia
- Rest of Europe
- Asia-Pacific
- China
- Japan
- India
- South Korea
- Australia
- Rest of Asia-Pacific
- Middle East and Africa
- GCC
- South Africa
- Rest of Middle East and Africa
- North America
Detailed Research Methodology and Data Validation
Primary Research
Mordor analysts interviewed service engineers, purchasing managers at biopharma cleanrooms, IVF embryologists across North America, Europe, and Asia, and distributors covering tier-2 cities. These conversations confirmed replacement cycles, typical capacity mixes, and current pricing spreads, filling critical gaps left by desk research.
Desk Research
We first mapped the demand base using open datasets from bodies such as the National Institutes of Health, the U.S. Centers for Medicare & Medicaid Services (IVF cycle counts), Eurostat PRODCOM medical-device codes, and customs shipment records compiled by Volza. Patent trends from Questel and peer-reviewed articles in journals like Applied Microbiology & Biotechnology helped calibrate technology diffusion, while company 10-Ks and investor decks clarified average selling prices. D&B Hoovers supplied hard revenue for key manufacturers. The sources above are illustrative; numerous additional public records were consulted for cross-checks and context.
Market-Sizing & Forecasting
A blended top-down model converts laboratory counts and IVF procedure volumes into potential chamber demand, which is then cross-verified through bottom-up supplier roll-ups on sampled ASP x units. Key variables like installed GMP cell-therapy suites, annual NIH life-science funding, average embryo-transfer cycles per clinic, and five-year replacement rates drive base-year value. Multivariate regression projects each driver, while scenario analysis stresses exchange-rate swings and capex slowdowns. Outputs feed an exponential-smoothing forecast to 2030. When bottom-up tallies diverge by more than two percentage points from the top-down total, assumptions on utilization or ASP are revisited with field experts.
Data Validation & Update Cycle
All interim results undergo anomaly checks, peer review, and senior analyst sign-off. Models refresh every 12 months, with mid-cycle revisions if recalls, regulatory shifts, or material M&A alter supply or pricing dynamics. A final sense check is performed just before report release, so clients receive the latest view.
Why Mordor's Carbon Dioxide Incubators Baseline is the dependable choice
Published estimates rarely align; differences usually stem from what gets counted, the age of the data, currency treatments, or how aggressively growth levers are modeled.
Key gap drivers here include whether benchtop tri-gas units and food-testing labs are in scope, if ASP progression assumes premium sensor upgrades, and how frequently figures are refreshed. Mordor's approach captures the full new-unit spectrum, ties ASPs to audited manufacturer filings, and is revisited annually, reducing drift.
Benchmark comparison
| Market Size | Anonymized source | Primary gap driver |
|---|---|---|
| USD 808.36 million | Mordor Intelligence | - |
| USD 769.42 million | Regional Consultancy A | Omits tri-gas and customized units; last update 2023; relies solely on top-down desk data |
| USD 384.90 million | Global Consultancy B | Counts only research & IVF labs, uses conservative ASP pulled from limited supplier sample |
The comparison shows that narrower scopes or infrequent updates can halve the headline number. By aligning breadth of coverage with verified price points and a disciplined refresh rhythm, Mordor delivers a balanced, transparent baseline decision-makers can trust.


Key Questions Answered in the Report
What is the current Carbon Dioxide Incubator Market size?
The Carbon Dioxide Incubator Market is projected to register a CAGR of 7.9% during the forecast period (2025-2030)
Who are the key players in Carbon Dioxide Incubator Market?
Eppendorf AG, Panasonic Healthcare Co., Thermo Fisher Scientific Inc., Sheldon Manufacturing Inc. and BINDER GmbH are the major companies operating in the Carbon Dioxide Incubator Market.
Which is the fastest growing region in Carbon Dioxide Incubator Market?
Asia Pacific is estimated to grow at the highest CAGR over the forecast period (2025-2030).
Which region has the biggest share in Carbon Dioxide Incubator Market?
In 2025, the North America accounts for the largest market share in Carbon Dioxide Incubator Market.
What years does this Carbon Dioxide Incubator Market cover?
The report covers the Carbon Dioxide Incubator Market historical market size for years: 2019, 2020, 2021, 2022, 2023 and 2024. The report also forecasts the Carbon Dioxide Incubator Market size for years: 2025, 2026, 2027, 2028, 2029 and 2030.
Page last updated on:


