Brisket Market Size and Share
Market Overview
| Study Period | 2021 - 2031 |
|---|---|
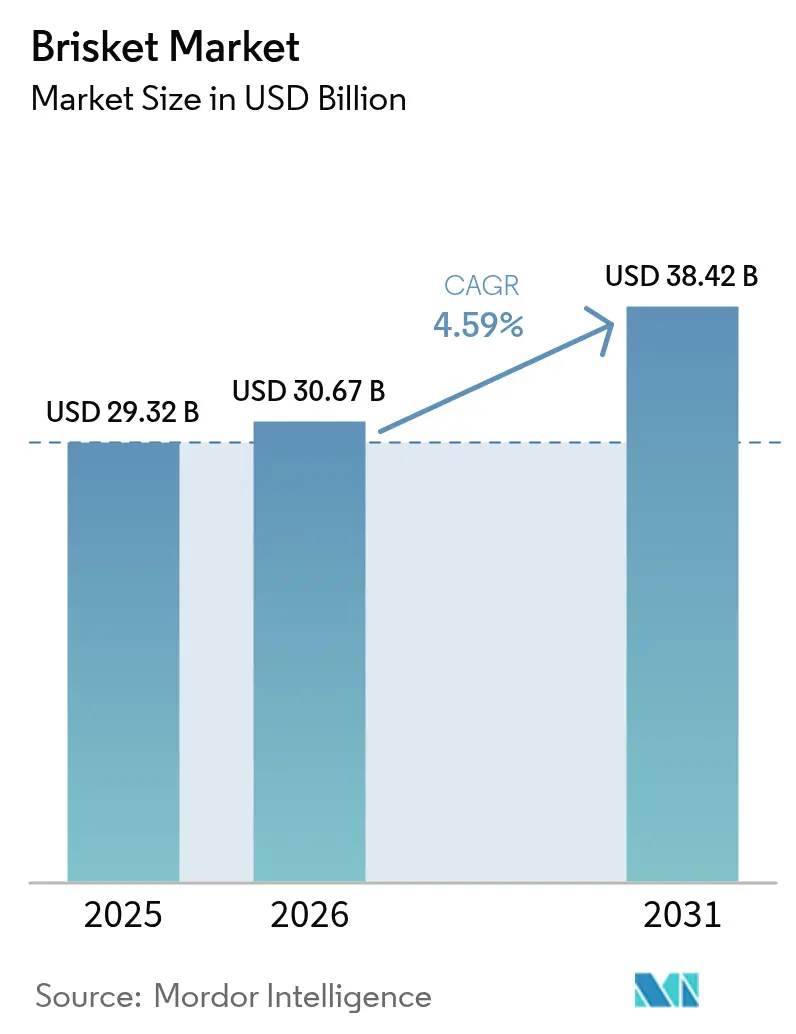
| Market Size (2026) | USD 30.67 Billion |
| Market Size (2031) | USD 38.42 Billion |
| Growth Rate (2026 - 2031) | 4.59% CAGR |
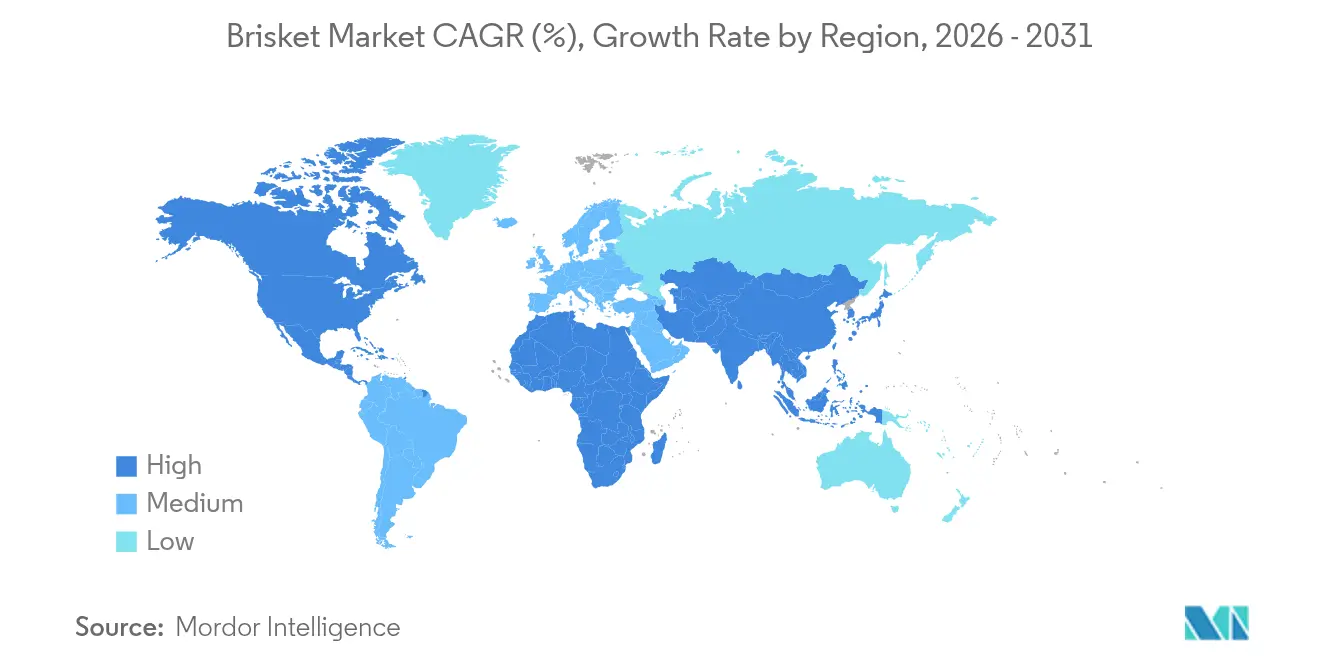
| Fastest Growing Market | Asia Pacific |
| Largest Market | North America |
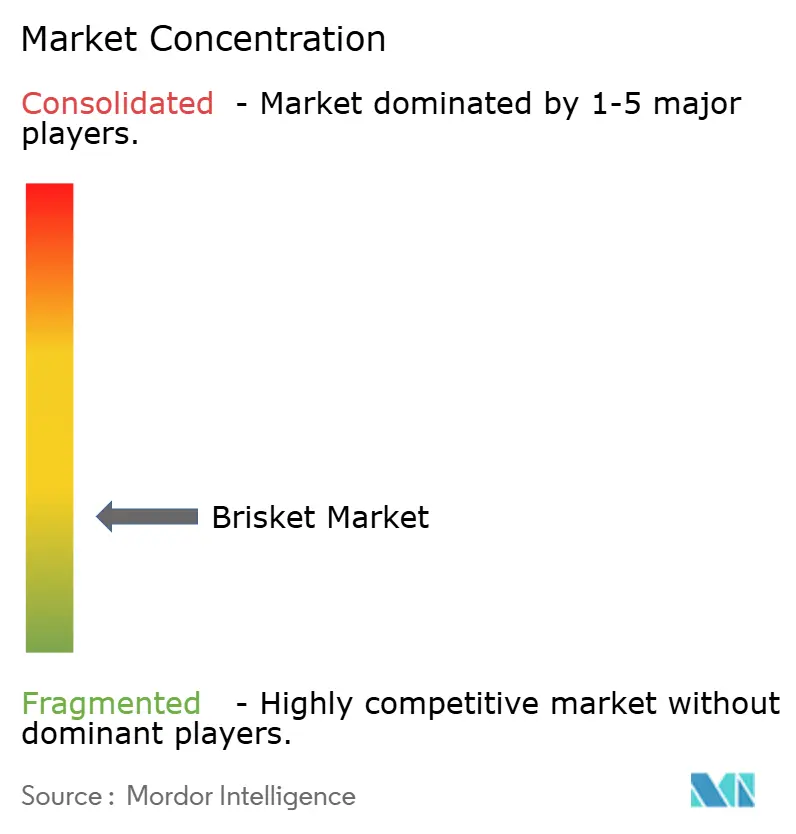
| Market Concentration | Low |
Major Players
*Disclaimer: Major Players sorted in no particular order Image © Mordor Intelligence. Reuse requires attribution under CC BY 4.0. |
|
Brisket Market Analysis by Mordor Intelligence
The brisket market size was valued at USD 29.32 billion in 2025 and estimated to grow from USD 30.67 billion in 2026 to reach USD 38.42 billion by 2031, at a CAGR of 4.59% during the forecast period (2026-2031). The increasing demand stems from both home cooks and restaurants seeking high-quality, slow-cooked beef options. While North America dominates consumption, the Asia-Pacific region shows strong growth potential due to increasing protein consumption and foodservice sector recovery. Market expansion is driven by innovations in pre-packaged cuts, clean-label products, and advanced packaging technologies in retail. Restaurants continue to feature brisket as a key menu item to attract customers and maintain profit margins. The market without a dominant processor allows regional brands to establish market presence through sustainable practices and distinct flavor profiles.
Key Report Takeaways
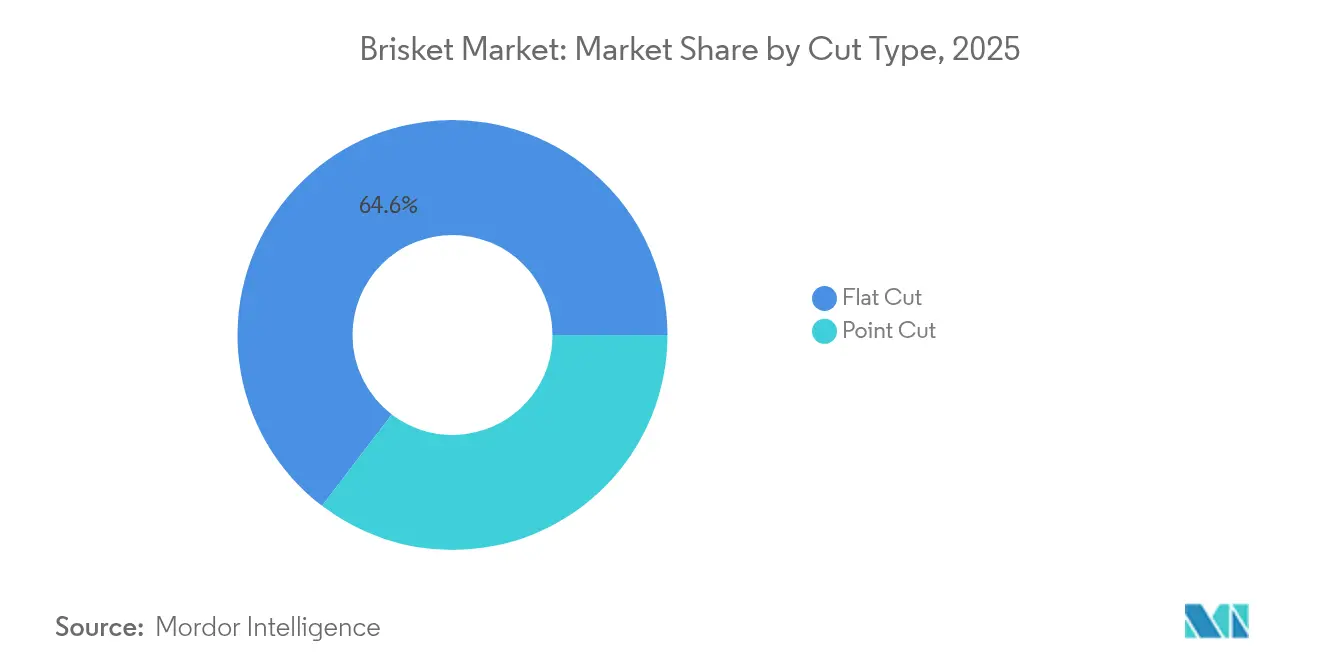
- By cut type, flat cut captured 64.62% of the brisket market share in 2025, whereas point cut is projected to post the fastest 5.42% CAGR through 2031.
- By product type, conventional brisket held 84.62% revenue in 2025; organic brisket is set to expand at a 6.63% CAGR to 2031.
- By packaging, box formats commanded 69.54% share of the brisket market size in 2025, while pouches are forecast to grow at 5.68% CAGR.
- By end-use, foodservice accounted for 59.62% of the brisket market size in 2025, yet retail channels are advancing at a 6.23% CAGR.
- By geography, North America led with 45.02% revenue share in 2025, but Asia-Pacific is expected to log a 7.70% CAGR through 2031.
Note: Market size and forecast figures in this report are generated using Mordor Intelligence’s proprietary estimation framework, updated with the latest available data and insights as of 2026.
Global Brisket Market Trends and Insights
Drivers Impact Analysis*
| Driver | (~) % Impact on CAGR Forecast | Geographic Relevance | Impact Timeline |
|---|---|---|---|
| Rising demand for protein-rich meat in daily diets | +1.2% | Global, with strongest impact in Asia-Pacific and emerging markets | Long term (≥ 4 years) |
| Growing popularity of barbecue cuisine across global markets | +0.9% | North America, expanding to Europe and Asia-Pacific | Medium term (2-4 years) |
| Expansion of quick service and casual dining restaurants | +0.8% | Global, particularly urban centers in developing markets | Medium term (2-4 years) |
| Increasing consumption of beef in emerging regional markets | +1.1% | Asia-Pacific, Middle East, Latin America | Long term (≥ 4 years) |
| Availability of packaged brisket in retail and online channels | +0.6% | North America and Europe, expanding globally | Short term (≤ 2 years) |
| Advancements in meat processing and cold chain logistics | +0.4% | Global, with priority in temperature-sensitive regions | Medium term (2-4 years) |
| Source: Mordor Intelligence | |||
Rising demand for protein-rich meat in daily diets
The demand for protein is increasing significantly in emerging markets, where growing middle-class populations are driving annual consumption growth, particularly in Indonesia and Sub-Saharan Africa. The consumer preference for protein-rich foods is changing meat consumption patterns, with brisket gaining popularity due to its high protein content and collagen properties. This shift is evident across various demographic segments, from urban professionals to health-conscious families. The nutritional profile of brisket, combined with its versatility in different cooking methods, has positioned it as a preferred choice in both household and food service sectors. This trend benefits brisket consumption as consumers increasingly consider meat an essential component of their nutritional requirements. The growing awareness of protein's role in muscle maintenance, immune function, and overall health has further strengthened brisket's market position in both traditional and emerging markets.
Expansion of quick service and casual dining restaurants
The foodservice sector's expansion is creating substantial demand channels for brisket, with restaurant chains increasingly incorporating premium cuts to differentiate their offerings and capture higher margins. Restaurants across various segments, from quick-service chains like Arby's to casual dining establishments, have successfully incorporated brisket into their menus. The complex preparation and lengthy cooking process of brisket creates a competitive advantage for restaurants over home cooking. Restaurant expansion in emerging markets is particularly significant for brisket demand, as operators seek to establish premium positioning through distinctive protein offerings that justify higher price points compared to commodity cuts. The foodservice channel's growth trajectory aligns with consumer preferences for experiential dining and complex flavors that are difficult to replicate at home, positioning brisket as an ideal vehicle for restaurant differentiation strategies.
Increasing consumption of beef in emerging regional markets
Emerging markets are driving fundamental shifts in global beef consumption patterns, with per capita consumption of beef in the United States being 59.2 pounds, according to the US Department of Agriculture data [1]Source: U.S. Department of Agriculture, "USDA Agricultural Projections to 2034," ers.usda.gov. JD Super's strategic partnerships with Argentina's Beef Promotion Institute and international brands like BRF and Marfrig demonstrate how Chinese retailers are expanding premium meat imports to serve over 600 million users through sophisticated logistics networks. The Middle East presents particularly strong growth opportunities, with economic development and higher oil prices driving demand for premium meat cuts, including specialized applications in hotels and restaurants that favor distinctive cuts like brisket. U.S. beef exports are capitalizing on these trends, with the U.S. Meat Export Federation implementing targeted strategies to educate buyers on the quality and versatility of American beef, particularly focusing on alternative cuts that offer value differentiation in price-sensitive markets. These emerging market dynamics are creating sustained demand growth for brisket as consumers in developing economies increasingly prioritize protein quality and culinary sophistication.
Advancements in meat processing and cold chain logistics
Technological innovations in meat processing and cold chain management are enabling brisket market expansion by improving product quality, extending shelf life, and reducing distribution costs. Automated warehouse systems handle briskets at a lower temperature while reducing energy consumption and improving goods movement efficiency, demonstrating how technology is optimizing cold storage operations. Cold chain management innovations are particularly critical for brisket distribution, as research shows transportation temperature significantly impacts color stability and purge loss, with lower temperatures yielding better quality attributes that extend retail shelf life. Advanced packaging technologies, including vacuum skin packaging and carbon monoxide-modified atmosphere packaging, are extending geographical sales potential while reducing the meat waste that occurs during transportation, creating new market opportunities for brisket distribution.
Restraints Impact Analysis*
| Restraint | (~) % Impact on CAGR Forecasts | Geographic Relevance | Impact Timeline |
|---|---|---|---|
| High cost of brisket compared to other meat cuts | -0.8% | Global, particularly price-sensitive emerging markets | Short term (≤ 2 years) |
| Stringent government regulations on meat processing standards | -0.6% | North America and Europe, expanding to Asia-Pacific | Medium term (2-4 years) |
| Growing popularity of vegan and plant-based food alternatives | -0.4% | North America and Europe, with spillover to urban Asia-Pacific | Long term (≥ 4 years) |
| Religious and ethical restrictions on beef consumption practices | -0.3% | Middle East, India, parts of Africa and Asia-Pacific | Long term (≥ 4 years) |
| Source: Mordor Intelligence | |||
High cost of brisket compared to other meat cuts
The high price of brisket compared to other meat cuts creates significant barriers to market expansion, especially in price-sensitive segments and emerging economies where protein purchase decisions depend heavily on cost. The premium pricing affects both retail and wholesale markets, limiting broader consumer adoption across various income segments. Consumers adapt by choosing more affordable options, with barbecue enthusiasts using chuck roast as a cost-effective substitute to maintain traditional cooking methods. This shift in consumer behavior reflects broader market dynamics where price sensitivity influences meat selection patterns. In foodservice, operators face challenges balancing menu prices with customer expectations, often restricting brisket to premium menu items or promotional offerings instead of regular menu items. The limited availability in foodservice establishments further impacts market growth potential, as restaurants carefully manage their cost structures while maintaining profit margins.
Stringent government regulations on meat processing standards
Regulatory compliance requirements create operational complexity and cost burdens that can constrain market growth, particularly for smaller processors seeking to enter brisket production or expand distribution capabilities. The USDA's Food Safety and Inspection Service faces ongoing challenges in finalizing pathogen standards, with work paused on several critical standards, including those for Salmonella in raw ground beef, creating uncertainty for processors planning facility investments. The Government Accountability Office has urged the USDA to develop prioritization plans for pathogen standards and improve coordination between agencies, highlighting regulatory gaps that could impact food safety oversight and compliance costs [2]Source: U.S. Government Accountability Office, “FOOD SAFETY: USDA Should Take Additional Actions to Strengthen Oversight of Meat and Poultry,” gao.gov. The complex regulatory landscape often requires significant capital investment in equipment upgrades, testing facilities, and compliance monitoring systems, which can be particularly burdensome for new market entrants. Such regulatory challenges collectively act as a significant market restraint, particularly affecting smaller market participants and potentially limiting overall market growth.
*Our forecasts treat driver/restraint impacts as directional, not additive. The impact forecasts reflect baseline growth, mix effects, and variable interactions.
Segment Analysis
By Cut Type: Flat Cut Dominance Drives Volume Growth
Flat cut brisket commands 64.62% market share in 2025, reflecting consumer and foodservice preferences for its leaner profile and more predictable cooking characteristics that align with commercial preparation requirements. Point cut represents the faster-growing segment at 5.42% CAGR through 2031, driven by barbecue enthusiasts and premium restaurants seeking the higher fat content and more complex flavor profiles that point cut delivers. The segmentation reflects fundamental differences in culinary applications, with flat cut preferred for slicing presentations and point cut favored for pulled preparations and specialty barbecue applications.
Consumer education initiatives by organizations like the Texas Beef Council are expanding awareness of cut-specific applications through programs like Smoke Lab, where participants learn grilling techniques that optimize each cut's characteristics, according to the Texas Beef Council data from 2025. The cut type segmentation is also influenced by processing economics, as flat cuts' more uniform shape enables more efficient packaging and portion control for foodservice applications.


By Product Type: Organic Segment Accelerates Premium Positioning
Conventional brisket holds 84.62% of the market share in 2025, driven by established supply chains and competitive pricing that attracts both consumers and foodservice businesses. The widespread availability, consistent quality, and lower production costs of conventional brisket make it the preferred choice for most retail outlets, restaurants, and institutional buyers. The organic brisket segment is growing at 6.63% CAGR through 2031, as consumers demonstrate a willingness to pay higher prices for products with verified production methods and sustainability certifications.
The growth in organic brisket is supported by improved supply chain transparency and traceability systems that justify premium pricing. Organic producers are implementing advanced tracking technologies and certification programs to ensure product authenticity and meet consumer demands for detailed production information. The market players are launching new products in the market, owing to the rising demand for organic products. The rising awareness of environmental impact and animal welfare concerns continues to drive consumer interest in organic options, particularly among urban populations and higher-income demographics.
By Packaging: Innovation Drives Convenience Adoption
Box packaging holds 69.54% market share in 2025, supported by retail and foodservice distribution systems that prioritize rigid packaging for product protection and stacking efficiency. The dominance of box packaging stems from its durability, cost-effectiveness, and ability to withstand various transportation and storage conditions. Pouches are experiencing the highest growth rate at 5.68% CAGR through 2031, due to advancements in vacuum packaging and modified atmosphere technologies that extend product shelf life while reducing material usage. The rise in pouch adoption is particularly notable in ready-to-eat meals and portion-controlled products, where convenience and space efficiency are crucial factors.
The market is evolving through sustainable packaging developments, including recyclable shrink bags and wood-based plastics, in response to environmental regulations and consumer preferences. Manufacturers are investing in bio-based materials and implementing circular economy principles in their packaging designs. Integration of smart packaging features, such as QR codes and freshness indicators, enhances food safety monitoring and consumer information access. These technologies enable real-time tracking of product quality and provide detailed information about sourcing and handling. New packaging formats, including cook-in packaging, address food safety requirements while reducing direct contact with raw meat, aligning with current retail trends for convenience and sustainability. The industry is also exploring antimicrobial packaging solutions and temperature-sensitive indicators to improve food safety and reduce waste throughout the supply chain.

By End-Use: Retail Channel Momentum Challenges Foodservice Leadership
Foodservice applications account for 59.62% of brisket consumption in 2025, as the cut's complexity and cooking requirements favor professional preparation. Restaurants, catering services, and institutional foodservice providers prefer brisket due to their expertise in slow-cooking techniques and specialized equipment. Foodservice channels are launching new brisket recipes in the market, owing to the rising demand for products among consumers. For instance, in April 2025, Freddy's Frozen Custard and Stakeburgers launched a new BBQ Brisket Stakeburgers made with sliced brisket pit-smoked for 16 hours.
Retail channels are projected to grow at 6.23% CAGR through 2031, driven by increasing home barbecue popularity, direct-to-consumer meat sales, and enhanced retail packaging. The retail segment's expansion is supported by consumer education programs and packaging innovations that simplify home preparation. Retailers are introducing pre-trimmed, portion-controlled brisket cuts and providing detailed cooking instructions to help consumers achieve better results. This growth aligns with consumer preferences for premium home dining experiences, as more individuals seek to recreate restaurant-quality meals at home. The availability of smart cooking devices and online cooking tutorials has further encouraged home cooks to experiment with brisket preparation.
Geography Analysis
North America maintains market leadership with 45.02% share in 2025, anchored by deep-rooted barbecue traditions and sophisticated foodservice infrastructure that supports brisket consumption across multiple channels. The region's dominance reflects established consumer familiarity with brisket preparation, extensive restaurant penetration, and retail distribution networks optimized for premium meat cuts. The region benefits from integrated supply chains spanning from ranch to retail, with major processors like JBS investing USD 200 million in Texas and Colorado facilities in February 2025 to enhance production capacity and efficiency. North American market maturity creates opportunities for premium positioning and value-added products, with grass-fed and organic segments showing particular growth potential as consumers increasingly prioritize sustainability and production transparency.
The Asia-Pacific region is projected to grow at a CAGR of 7.70% through 2031, making it the fastest-growing regional market. This growth stems from rapid economic development, urbanization, and changing dietary preferences toward protein-rich foods. India's improvements in beef production through enhanced breeding and management practices strengthen regional supply, while Indonesia demonstrates increasing protein demand. The region presents substantial opportunities for international exporters, with United States beef maintaining strong positions in Japan and South Korea while expanding into emerging markets through education and promotion initiatives.
The European Union demonstrates growth potential for United States beef exports, supported by increasing consumption of high-quality meat and trade agreements facilitating non-hormone-treated cattle imports. Middle Eastern markets show increased demand due to economic growth and higher oil prices, particularly in the foodservice sector, where hotels and restaurants seek premium protein offerings. South American markets exhibit a dual role, with countries like Brazil operating as major exporters while developing domestic premium beef consumption and exports. According to the Associação Brasileira das Indústrias Exportadoras de Carnes data from 2023, Brazil exported USD 554.44 million of beef and veal in European Union . The varying growth patterns across regions reflect differences in economic development, cultural preferences, and regulatory frameworks that influence market access and consumer demand for premium beef cuts, including brisket.

Competitive Landscape
The brisket market operates with fragmentation, creating significant opportunities for both established processors and emerging players to capture market share through differentiation strategies. Major meat processors, including Tyson Foods, JBS, and Cargill, dominate through vertical integration, extensive distribution networks, and processing scale that enables cost efficiency and consistent supply.
The competitive landscape is characterized by strategic investments in processing capacity, technology adoption, and supply chain optimization, with companies leveraging automation and cold chain innovations to improve operational efficiency and product quality. Emerging competitive dynamics include the rise of direct-to-consumer specialists like ButcherBox and Crowd Cow, which are capturing premium market segments through subscription models and specialized sourcing that provides access to unique cuts often unavailable in traditional retail channels.
Technology adoption is becoming a key differentiator, with companies implementing blockchain traceability, artificial intelligence-driven quality control, and automated processing systems to enhance food safety, reduce costs, and improve customer confidence. The competitive environment is further shaped by regulatory compliance requirements and sustainability pressures, creating barriers to entry for smaller players while rewarding companies that can demonstrate operational excellence and environmental responsibility. White-space opportunities exist in regional specialization, organic and grass-fed positioning, and innovative packaging solutions that extend shelf life and improve convenience for both retail and foodservice applications.
Brisket Industry Leaders
-
Conagra Brands
-
JBS USA Holdings
-
Hormel Foods Corporation
-
Cargill Inc.
-
Tyson Foods
- *Disclaimer: Major Players sorted in no particular order

Recent Industry Developments
- June 2025: Gleezy, a Charlotte-based food startup specializing in double-smoked brisket hot dogs, launched its products in Harris Teeter grocery stores across seven states and Washington, DC.
- April 2025: Freddy's Frozen Custard & Steakburgers introduced its new BBQ Brisket Steakburger and brought back the Key Lime Pie Concrete. The BBQ Brisket Steakburger will be available from April 30th, 2025, to August 26th, 2025. Customers can order these items at participating Freddy's locations across the United States through drive-thru, in-restaurant dining, pickup, or delivery via the Freddy's mobile app and website, freddys.com.
- September 2024: Chipotle launched a new range of smoked brisket products in the United States. The Brisket is made from Responsibly Raised Beef Brisket, freshly cut daily and seasoned with Mexican spices and Chipotle’s chili pepper BBQ sauce.


Global Brisket Market Report Scope
Global Brisket Market is segmented by type and product type. On the basis of type, the market is segmented into point cut and flat cut. On the basis of product type, the market is segmented into conventional brisket and organic brisket.Also, the study provides an analysis of the brisket market in the emerging and established markets across the globe, including North America, Europe, Asia-Pacific, South America, and Middle East & Africa.
| Point Cut |
| Flat Cut |
| Conventional Brisket |
| Organic Brisket |
| Box |
| Pouches |
| Others |
| Retail | Supermarkets/Hypermarkets |
| Butcher Shops and Specialty Stores | |
| Online Retail Stores | |
| Other Distribution Channels | |
| Foodservice |
| North America | United States |
| Canada | |
| Mexico | |
| Rest of North America | |
| Europe | Germany |
| United Kingdom | |
| Italy | |
| France | |
| Spain | |
| Netherlands | |
| Poland | |
| Belgium | |
| Sweden | |
| Rest of Europe | |
| Asia-Pacific | China |
| India | |
| Japan | |
| Australia | |
| Indonesia | |
| South Korea | |
| Thailand | |
| Singapore | |
| Rest of Asia-Pacific | |
| South America | Brazil |
| Argentina | |
| Colombia | |
| Chile | |
| Peru | |
| Rest of South America | |
| Middle East and Africa | South Africa |
| Saudi Arabia | |
| United Arab Emirates | |
| Nigeria | |
| Egypt | |
| Morocco | |
| Turkey | |
| Rest of Middle East and Africa |
| By Cut Type | Point Cut | |
| Flat Cut | ||
| By Product Type | Conventional Brisket | |
| Organic Brisket | ||
| By Packaging | Box | |
| Pouches | ||
| Others | ||
| By End-Use | Retail | Supermarkets/Hypermarkets |
| Butcher Shops and Specialty Stores | ||
| Online Retail Stores | ||
| Other Distribution Channels | ||
| Foodservice | ||
| By Geography | North America | United States |
| Canada | ||
| Mexico | ||
| Rest of North America | ||
| Europe | Germany | |
| United Kingdom | ||
| Italy | ||
| France | ||
| Spain | ||
| Netherlands | ||
| Poland | ||
| Belgium | ||
| Sweden | ||
| Rest of Europe | ||
| Asia-Pacific | China | |
| India | ||
| Japan | ||
| Australia | ||
| Indonesia | ||
| South Korea | ||
| Thailand | ||
| Singapore | ||
| Rest of Asia-Pacific | ||
| South America | Brazil | |
| Argentina | ||
| Colombia | ||
| Chile | ||
| Peru | ||
| Rest of South America | ||
| Middle East and Africa | South Africa | |
| Saudi Arabia | ||
| United Arab Emirates | ||
| Nigeria | ||
| Egypt | ||
| Morocco | ||
| Turkey | ||
| Rest of Middle East and Africa | ||


Key Questions Answered in the Report
What is the current value of the brisket market?
The brisket market size stands at USD 30.67 billion in 2026 and is projected to reach USD 38.42 billion by 2031 at a 4.59% CAGR.
Which segment holds the largest share of brisket sales?
Flat cut brisket leads with 64.62% of brisket market share, favored for its lean profile and consistent slicing performance.
Why is Asia-Pacific the fastest-growing region for brisket?
Rising disposable incomes, expanding foodservice chains, and growing barbecue culture drive a 7.70% CAGR for brisket across Asia-Pacific through 2031.
How does packaging innovation influence brisket sales?
Vacuum pouches and skin-pack solutions extend shelf life and reduce waste, helping retail brisket sales grow faster than foodservice demand.
Page last updated on:


