Market Overview
| Study Period | 2017 - 2029 |
|---|---|
| Forecast Data Period | 2025 - 2029 |
| Historical Data Period | 2017 - 2023 |
| Market Size (2025) | USD 131.1 Billion |
| Market Size (2029) | USD 166.7 Billion |
| Growth Rate (2025 - 2029) | 6.20% CAGR |
| Market Concentration | High |
Major Players*Disclaimer: Major Players sorted in no particular order Image © Mordor Intelligence. Reuse requires attribution under CC BY 4.0. | |

South America Passenger Cars Market Analysis by Mordor Intelligence
The South America Passenger Cars Market size is estimated at 131.1 billion USD in 2025, and is expected to reach 166.7 billion USD by 2029, growing at a CAGR of 6.20% during the forecast period (2025-2029).
The South American passenger cars market is experiencing a transformative phase driven by sustainable mobility initiatives and technological advancement. Major automotive manufacturers are making significant investments in the region, with Volkswagen announcing a ¬1 billion investment for growth in South America in 2023, targeting a 40% sales increase in Brazil by 2027. The region's automotive landscape is further enhanced by its strategic advantage in raw materials, particularly lithium reserves, with approximately 65% of the world's lithium deposits concentrated in South America Bolivia holding 21 million tons, Argentina possessing 19.3 million tons, and Chile containing 9.6 million tons. This abundance of critical battery materials positions the region favorably for electric passenger car production and export opportunities.
The market is witnessing a significant shift towards sustainable transportation solutions, particularly in urban mobility. Cities are taking decisive action, exemplified by São Paulo's landmark decision to ban diesel bus purchases and its ambitious plan to deploy 2,600 electric buses by the end of 2024. This transition is complemented by Brazil's leadership in biofuel adoption, where ethanol-based fuels demonstrate up to 90% lower emissions compared to traditional gasoline or diesel alternatives. The integration of sustainable fuel options, particularly sugarcane-derived ethanol, has become a distinctive feature of the South American passenger cars landscape.
Infrastructure development and government initiatives are playing crucial roles in market evolution. Colombia has set an ambitious target of putting 600,000 EVs on its roads by 2030, supported by comprehensive incentive programs and infrastructure development plans. This commitment is reflected across the region, with major automotive manufacturers adapting their strategies accordingly. Toyota, for instance, announced in 2023 a USD 338 million investment in Brazil specifically for manufacturing new hybrid and flex-fuel vehicles, demonstrating the industry's commitment to meeting evolving consumer preferences and regulatory requirements.
The market is experiencing a surge in technological innovation and manufacturing capabilities. Ford's expansion plans in South America, announced in 2023, include the introduction of new electric passenger car models and subscription services, aiming for 40% growth. Similarly, Volkswagen Group has established a biofuels R&D center in Brazil, focusing on developing ethanol-based biofuels for emerging markets utilizing hybrid technologies and clean energy for combustion. These developments are complemented by strategic partnerships between passenger cars manufacturers and local entities, fostering innovation in both traditional and alternative fuel technologies while strengthening the regional supply chain.
South America Passenger Cars Market Trends and Insights
Surging demand and government incentives propel South America's electric vehicle market
- Countries like Brazil and Argentina in South America show significant potential in the automobile market. The South American vehicle industry has witnessed notable growth in recent years. Notably, the region has seen a rising demand for electric vehicles (EVs), especially in the passenger car segment. This surge can be attributed to factors like heightened awareness, growing environmental concerns, and governmental initiatives promoting EV adoption. In fact, EV sales in the region saw a notable increase, growing by 17.95% in 2022 compared to 2021.
- South America, with its diverse markets, is poised for a surge in electric vehicles. Brazil, in particular, is eyeing a shift toward electric buses, driven by its focus on renewable power generation and its abundant reserves of niobium and lithium, crucial for EV battery development. A significant move in this direction came in December 2022 when Sao Paulo banned diesel bus purchases and announced plans to deploy 2600 electric buses by 2024-end. Similar trends in other South American nations are expected to drive vehicle electrification from 2024 to 2030.
- Government policies and incentive programs across South American nations are set to be key drivers for vehicle electrification in the region. Tax benefits, for instance, are playing a pivotal role. Colombia's government, for instance, is leveraging incentives and subsidies with an ambitious target of putting 600,000 EVs on its roads by 2030, aiming to tackle carbon emissions. With similar initiatives anticipated in other South American countries, the sales of EVs are expected to witness a surge from 2024 to 2030.


OTHER KEY INDUSTRY TRENDS COVERED IN THE REPORT
- South America's demographic narrative, represented by Brazil and Colombia, showcases a story of consistent growth, with Brazil experiencing a pronounced surge
- Brazil and Colombia are expected to see an increase in consumer spending for vehicle purchases (CVP), indicating a recovering automotive market and growing consumer confidence
- From 2017 to 2022, South American auto loan interest rates unveiled a diverse economic landscape. Argentina's rates, marked by turbulence, underscore the nation's economic instability. Meanwhile, Brazil's rates, though initially high, witnessed a decline, signaling stabilization efforts. In contrast, Colombia's rates remained moderate, mirroring an upward trajectory in its economic conditions
- South America is steadily building its EV infrastructure, with both slow and fast charging stations witnessing significant growth
- South America's electrification in the automotive sector shows fluctuating trends across vehicle segments
- South America witnessed significant fluctuations in diesel and gasoline prices due to the influence of external factors
- During 2017-2030, Brazil and Colombia displayed contrasting economic paths. While both faced downturns around 2020, Brazil's GDP per capita showed recovery by 2023, whereas Colombia witnessed a slight decline
- Projections indicate a trend toward economic stabilization and controlled inflation in the region, highlighting a concerted push to restore equilibrium and foster growth
- South American MaaS Sector: The shared mobility sector is witnessing a surge in opportunities and showcasing remarkable resilience
- South America’s surging demand for electric vehicle batteries: falling costs and strategic alliances
- As economic conditions stabilize and regional trade agreements become more favorable, South America's used car market is set to experience sustained growth
- Brazil and Argentina are undergoing shifts in their automotive markets
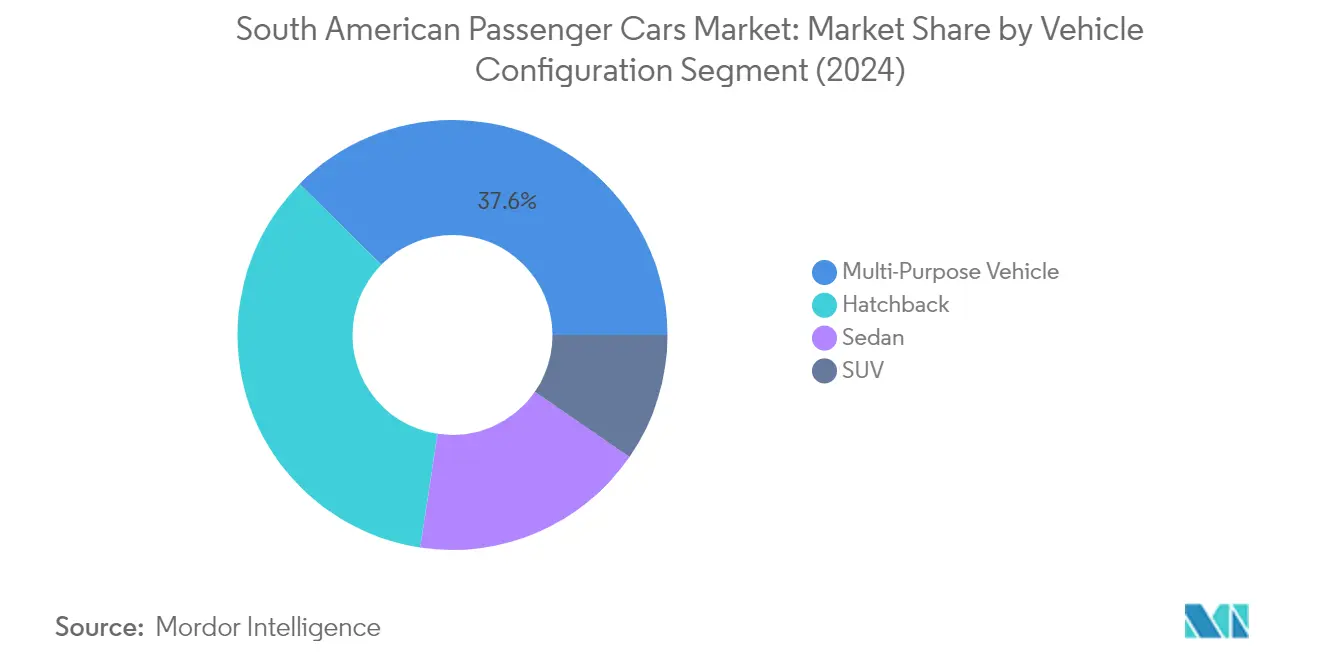
Segment Analysis: Vehicle Configuration
Multi-Purpose Vehicle (MPV) Segment in South American Passenger Cars Market
The Multi-Purpose Vehicle (MPV) segment dominates the South American passenger cars market, commanding approximately 38% market share in 2024. This significant market position can be attributed to the segment's ability to meet diverse consumer needs, particularly families and commercial users requiring spacious and versatile transportation solutions. MPVs have gained substantial traction in key markets like Brazil and Argentina, where their practical design, flexible seating configurations, and superior cargo capacity make them an attractive choice for both urban and suburban consumers. The segment's success is further bolstered by continuous innovations in comfort features, enhanced fuel efficiency, and the introduction of hybrid powertrains, making these vehicles more appealing to environmentally conscious consumers while maintaining their core utility value.

Sports Utility Vehicle (SUV) Segment in South American Passenger Cars Market
The Sports Utility Vehicle (SUV) segment is emerging as the fastest-growing category in the South American passenger cars market, with projections indicating robust growth through 2024-2029. This accelerated growth is driven by increasing consumer preference for vehicles offering higher ground clearance, a commanding driving position, and versatile performance capabilities suitable for both urban and rural environments. The segment's expansion is further supported by manufacturers introducing more fuel-efficient powertrains, compact SUV models, and advanced safety features. Additionally, the growing trend of lifestyle-oriented vehicles, coupled with improving economic conditions in key South American markets, is expected to sustain this growth trajectory. The introduction of electric and hybrid SUV variants is also contributing to the segment's appeal, particularly among environmentally conscious consumers seeking sustainable mobility solutions without compromising on utility and style.
Remaining Segments in Vehicle Configuration
The hatchback and sedan segments continue to play vital roles in the South American passenger cars market, each catering to distinct consumer preferences and needs. Hatchbacks maintain their appeal through superior urban maneuverability, fuel efficiency, and competitive pricing, making them particularly attractive to first-time car buyers and urban dwellers. Meanwhile, the sedan segment retains its position as a symbol of executive transportation, offering superior comfort and refined driving dynamics. Both segments are experiencing significant technological updates, including the integration of advanced safety features, improved connectivity solutions, and the gradual introduction of electrified powertrains, ensuring their continued relevance in the evolving automotive landscape.
Segment Analysis: Propulsion Type
ICE Segment in South America Passenger Cars Market
The Internal Combustion Engine (ICE) segment continues to dominate the South American passenger cars market, commanding approximately 82% market share in 2024. This substantial market presence can be attributed to several factors, including the well-established infrastructure for conventional fuel vehicles, lower upfront costs compared to alternative powertrains, and widespread availability of service networks across the region. The segment's strength is particularly evident in countries like Brazil and Argentina, where traditional fuel vehicles remain the preferred choice for consumers due to their reliability, familiarity, and the extensive network of fueling stations. Additionally, the segment benefits from the region's strong flex-fuel vehicle culture, especially in Brazil, where ICE vehicles capable of running on both gasoline and ethanol have gained significant traction.
FCEV Segment in South America Passenger Cars Market
The Fuel Cell Electric Vehicle (FCEV) segment is emerging as the fastest-growing propulsion type in the South American passenger cars market, with a projected growth rate of approximately 33% during 2024-2029. This remarkable growth trajectory is driven by increasing investments in hydrogen infrastructure, growing environmental consciousness, and supportive government policies promoting clean energy alternatives. The segment's expansion is further bolstered by technological advancements in fuel cell technology, making FCEVs more efficient and cost-effective. Major automotive manufacturers are increasingly focusing on FCEV development, introducing new models with improved range and performance capabilities, while also working on establishing hydrogen refueling infrastructure across key South American markets.
Remaining Segments in Propulsion Type
The remaining segments in the South American passenger cars market's propulsion types include various electrified powertrains such as Battery Electric Vehicles (BEV), Hybrid Electric Vehicles (HEV), and Plug-in Hybrid Electric Vehicles (PHEV). These segments are gaining momentum as automakers expand their electrified vehicle portfolios and governments implement supportive policies for electric mobility. The hybrid segment, in particular, serves as a crucial bridge between conventional ICE vehicles and fully electric options, offering consumers the benefits of improved fuel efficiency while maintaining the convenience of traditional fueling infrastructure. The growing acceptance of these alternative propulsion technologies is reshaping the market landscape, with manufacturers increasingly investing in research and development to enhance the performance and affordability of these vehicles.
South America Passenger Cars Market Geography Segment Analysis
South America Passenger Cars Market in Brazil
Brazil dominates the South American passenger cars market, commanding approximately 33% of the total market share in 2024. The country's automotive sector benefits from a robust manufacturing infrastructure, with several global automakers maintaining significant production facilities in key industrial hubs. Brazil's market leadership is reinforced by its comprehensive approach to sustainable urban mobility, particularly through its pioneering work in flex-fuel technology and a growing emphasis on electric vehicle adoption. The government's supportive policies, including tax incentives for eco-friendly vehicles and investments in charging infrastructure, have created a favorable environment for market growth. Additionally, Brazil's strategic focus on research and development, exemplified by its position as Volkswagen Group's biofuels R&D center, demonstrates its commitment to innovation in the automotive sector. The country's large consumer base, coupled with rising disposable incomes and increasing urbanization, continues to drive demand for passenger vehicles across various segments.
South America Passenger Cars Market in Argentina
Argentina's passenger cars market demonstrates remarkable resilience and adaptability, with projections indicating strong growth of approximately 11% from 2024 to 2029. The country's automotive sector is undergoing significant transformation, driven by evolving consumer preferences and technological advancements. Argentina's strategic position in the regional automotive supply chain, combined with its skilled workforce and established manufacturing capabilities, makes it an attractive destination for global automotive investments. The government's commitment to industrial development, evidenced by various incentive programs and regulatory frameworks, has created a conducive environment for market expansion. The country's focus on sustainable mobility solutions, including the gradual integration of electric and hybrid vehicles, reflects its alignment with global automotive trends. Furthermore, Argentina's robust dealer network and after-sales service infrastructure contribute to enhanced customer satisfaction and market stability.
South America Passenger Cars Market in Other Countries
The broader South American passenger cars market encompasses several emerging economies that contribute significantly to the region's automotive landscape. Countries like Colombia, Chile, Peru, and Uruguay each present unique market characteristics and opportunities. These markets are characterized by increasing urbanization, growing middle-class populations, and evolving consumer preferences toward more sophisticated and environmentally conscious vehicle choices. The automotive sectors in these countries benefit from regional trade agreements and improving economic conditions, which facilitate market access and growth. Governments across these nations are implementing various initiatives to modernize their automotive sectors, including investments in infrastructure and incentives for cleaner vehicles. The presence of established dealer networks and a growing emphasis on after-sales services further supports market development in these countries. Additionally, the increasing focus on electric mobility and sustainable transportation solutions is reshaping the automotive landscape across these markets.

Competitive Landscape
Top Companies in South America Passenger Cars Market
The South American passenger cars market is characterized by intense competition among major automotive manufacturers who are actively pursuing innovation and expansion strategies. Companies are increasingly focusing on developing electric passenger cars and hybrid vehicles while also maintaining their traditional internal combustion engine offerings to meet diverse consumer needs. Product enhancement remains a key trend, with manufacturers introducing new models with advanced features and improved fuel efficiency. Operational agility is demonstrated through flexible manufacturing processes and adaptable supply chain management, allowing companies to respond quickly to market demands. Strategic partnerships and collaborations, particularly in the electric vehicle segment, have become increasingly common as companies seek to share technology and reduce development costs. Market expansion efforts are primarily concentrated in Brazil and Argentina, with companies establishing new production facilities and strengthening their distribution networks across the region.
Market Dominated by Global Automotive Giants
The South American automotive market exhibits a high level of consolidation, with established global automotive manufacturers maintaining significant market presence through their extensive manufacturing capabilities and strong brand recognition. These multinational companies leverage their global expertise and resources to maintain competitive advantages, while also adapting their strategies to meet local market preferences and regulations. The market structure is characterized by a mix of traditional automotive conglomerates and specialized manufacturers, with the former holding dominant positions due to their broader product portfolios and established distribution networks. Local players maintain their relevance through strategic partnerships with global manufacturers and by focusing on specific market segments.
Merger and acquisition activities in the region have been primarily driven by global automotive companies seeking to strengthen their market position and expand their manufacturing capabilities. These strategic moves often involve acquiring local manufacturing facilities or forming joint ventures to enhance production capacity and market reach. Companies are increasingly focusing on vertical integration through acquisitions in the electric vehicle component supply chain, particularly in countries with significant lithium reserves like Argentina and Chile. The trend towards consolidation is expected to continue as companies seek economies of scale and enhanced operational efficiency in response to increasing competition and evolving market demands.
Innovation and Sustainability Drive Future Success
For incumbent companies to maintain and increase their market share, a multi-faceted approach combining technological innovation, sustainability initiatives, and market responsiveness is essential. Success factors include developing fuel-efficient vehicles, expanding electric vehicle offerings, and maintaining strong after-sales service networks. Companies must also focus on localizing their production to reduce costs and better serve regional markets. The ability to adapt to changing consumer preferences and regulatory requirements, particularly regarding emissions standards and safety regulations, will be crucial for maintaining competitive advantages. Investment in research and development, particularly in alternative fuel technologies and connected vehicle features, will become increasingly important for market leadership.
Contenders seeking to gain ground in the market must focus on identifying and exploiting niche segments while building strong dealer networks and after-sales service capabilities. Success will depend on their ability to offer competitive pricing while maintaining product quality and meeting local regulatory requirements. The risk of substitution from alternative transportation modes remains relatively low due to the region's geographic characteristics and limited public transportation infrastructure. However, emerging mobility solutions and changing consumer preferences towards sustainable transportation options could impact traditional private vehicle ownership patterns. Regulatory changes, particularly those related to emissions standards and electric vehicle incentives, will continue to shape market dynamics and influence competitive strategies.
South America Passenger Cars Industry Leaders
Fiat Chrysler Automobiles N.V
Ford Motor Company
GM Motor (Chevrolet)
Toyota Motor Corporation
Volkswagen AG
- *Disclaimer: Major Players sorted in no particular order


Recent Industry Developments
- September 2023: As of 2023, the company will start selling electrical vehicles in Latin America. This list is made up of Megane Etech Electric, KangooETech Electric and Master Electrical Technologies that are coming to Brazil, Argentina, Colombia and Mexico. Soon, we'll have other countries.
- September 2023: Renault has introduced the Renault e-tech range in the south american market.
- September 2023: Toyota introduces its Toyota Mobility Services (TMS) in Brazil, launching cutting-edge mobility solutions.


South America Passenger Cars Market Report Scope
Passenger Cars are covered as segments by Vehicle Configuration. Hybrid and Electric Vehicles, ICE are covered as segments by Propulsion Type. Argentina, Brazil are covered as segments by Country.Vehicle Configuration
| Passenger Cars | Hatchback |
| Multi-purpose Vehicle | |
| Sedan | |
| Sports Utility Vehicle |
Propulsion Type
| Hybrid and Electric Vehicles | By Fuel Category | BEV |
| FCEV | ||
| HEV | ||
| PHEV | ||
| ICE | By Fuel Category | Diesel |
| Gasoline | ||
| LPG |
Country
| Argentina |
| Brazil |
| Vehicle Configuration | Passenger Cars | Hatchback | |
| Multi-purpose Vehicle | |||
| Sedan | |||
| Sports Utility Vehicle | |||
| Propulsion Type | Hybrid and Electric Vehicles | By Fuel Category | BEV |
| FCEV | |||
| HEV | |||
| PHEV | |||
| ICE | By Fuel Category | Diesel | |
| Gasoline | |||
| LPG | |||
| Country | Argentina | ||
| Brazil | |||


Market Definition
- Vehicle Type - The category includes passenger cars.
- Vehicle Body Type - This include various body types such as Hatchbacks, Sedans, Sports Utility Vehicles, and Multi-purpose Vehicles.
- Fuel Category - The category includes various fuel types such as Gasoline, Diesel, LPG (Liquefied Petroleum Gas), CNG (Compressed Natural Gas), HEV (Hybrid Electric Vehicles), PHEV (Plug-in Hybrid Electric Vehicles), BEV (Battery Electric Vehicles), and FCEV (Fuel Cell Electric Vehicles)
| Keyword | Definition |
|---|---|
| Electric Vehicle (EV) | A vehicle which uses one or more electric motors for propulsion. Includes cars, buses, and trucks. This term includes all-electric vehicles or battery electric vehicles and plug-in hybrid electric vehicles. |
| BEV | A BEV relies completely on a battery and a motor for propulsion. The battery in the vehicle must be charged by plugging it into an outlet or public charging station. BEVs do not have an ICE and hence are pollution-free. They have a low cost of operation and reduced engine noise as compared to conventional fuel engines. However, they have a shorter range and higher prices than their equivalent gasoline models. |
| PEV | A plug-in electric vehicle is an electric vehicle that can be externally charged and generally includes all-electric vehicles as well as plug-in hybrids. |
| Plug-in Hybrid EV | A vehicle that can be powered either by an ICE or an electric motor. In contrast to normal hybrid EVs, they can be charged externally. |
| Internal combustion engine | An engine in which the burning of fuels occurs in a confined space called a combustion chamber. Usually run with gasoline/petrol or diesel. |
| Hybrid EV | A vehicle powered by an ICE in combination with one or more electric motors that use energy stored in batteries. These are continually recharged with power from the ICE and regenerative braking. |
| Commercial Vehicles | Commercial vehicles are motorized road vehicles designed for transporting people or goods. The category includes light commercial vehicles (LCVs) and medium and heavy-duty vehicles (M&HCV). |
| Passenger Vehicles | Passenger cars are electric motor– or engine-driven vehicles with at least four wheels. These vehicles are used for the transport of passengers and comprise no more than eight seats in addition to the driver’s seat. |
| Light Commercial Vehicles | Commercial vehicles that weigh less than 6,000 lb (Class 1) and in the range of 6,001–10,000 lb (Class 2) are covered under this category. |
| M&HDT | Commercial vehicles that weigh in the range of 10,001–14,000 lb (Class 3), 14,001–16,000 lb (Class 4), 16,001–19,500 lb (Class 5), 19,501–26,000 lb (Class 6), 26,001–33,000 lb (Class 7) and above 33,001 lb (Class 8) are covered under this category. |
| Bus | A mode of transportation that typically refers to a large vehicle designed to carry passengers over long distances. This includes transit bus, school bus, shuttle bus, and trolleybuses. |
| Diesel | It includes vehicles that use diesel as their primary fuel. A diesel engine vehicle have a compression-ignited injection system rather than the spark-ignited system used by most gasoline vehicles. In such vehicles, fuel is injected into the combustion chamber and ignited by the high temperature achieved when gas is greatly compressed. |
| Gasoline | It includes vehicles that use gas/petrol as their primary fuel. A gasoline car typically uses a spark-ignited internal combustion engine. In such vehicles, fuel is injected into either the intake manifold or the combustion chamber, where it is combined with air, and the air/fuel mixture is ignited by the spark from a spark plug. |
| LPG | It includes vehicles that use LPG as their primary fuel. Both dedicated and bi-fuel LPG vehicles are considered under the scope of the study. |
| CNG | It includes vehicles that use CNG as their primary fuel. These are vehicles that operate like gasoline-powered vehicles with spark-ignited internal combustion engines. |
| HEV | All the electric vehicles that use batteries and an internal combustion engine (ICE) as their primary source for propulsion are considered under this category. HEVs generally use a diesel-electric powertrain and are also known as hybrid diesel-electric vehicles. An HEV converts the vehicle momentum (kinetic energy) into electricity that recharges the battery when the vehicle slows down or stops. The battery of HEV cannot be charged using plug-in devices. |
| PHEV | PHEVs are powered by a battery as well as an ICE. The battery can be charged through either regenerative breaking using the ICE or by plugging into some external charging source. PHEVs have a better range than BEVs but are comparatively less eco-friendly. |
| Hatchback | These are compact-sized cars with a hatch-type door provided at the rear end. |
| Sedan | These are usually two- or four-door passenger cars, with a separate area provided at the rear end for luggage. |
| SUV | Popularly known as SUVs, these cars come with four-wheel drive, and usually have high ground clearance. These cars can also be used as off-road vehicles. |
| MPV | These are multi-purpose vehicles (also called minivans) designed to carry a larger number of passengers. They carry between five and seven people and have room for luggage too. They are usually taller than the average family saloon car, to provide greater headroom and ease of access, and they are usually front-wheel drive. |


Research Methodology
Mordor Intelligence follows a four-step methodology in all its reports.
- Step-1: Identify Key Variables: To build a robust forecasting methodology, the variables and factors identified in Step-1 are tested against available historical market numbers. Through an iterative process, the variables required for market forecast are set and the model is built based on these variables.
- Step-2: Build a Market Model: Market-size estimations for the historical and forecast years have been provided in revenue and volume terms. Market revenue is calculated by multiplying the sales volume with their respective average selling price (ASP). While estimating ASP factors like average inflation, market demand shift, manufacturing cost, technological advancement, and varying consumer preference, among others have been taken into account.
- Step-3: Validate and Finalize: In this important step, all market numbers, variables, and analyst calls are validated through an extensive network of primary research experts from the market studied. The respondents are selected across levels and functions to generate a holistic picture of the market studied.
- Step-4: Research Outputs: Syndicated Reports, Custom Consulting Assignments, Databases & Subscription Platforms.


