Braze Alloys Market Size and Share
Market Overview
| Study Period | 2021 - 2031 |
|---|---|
| Market Size (2026) | USD 2.58 Billion |
| Market Size (2031) | USD 3.16 Billion |
| Growth Rate (2026 - 2031) | 4.12% CAGR |
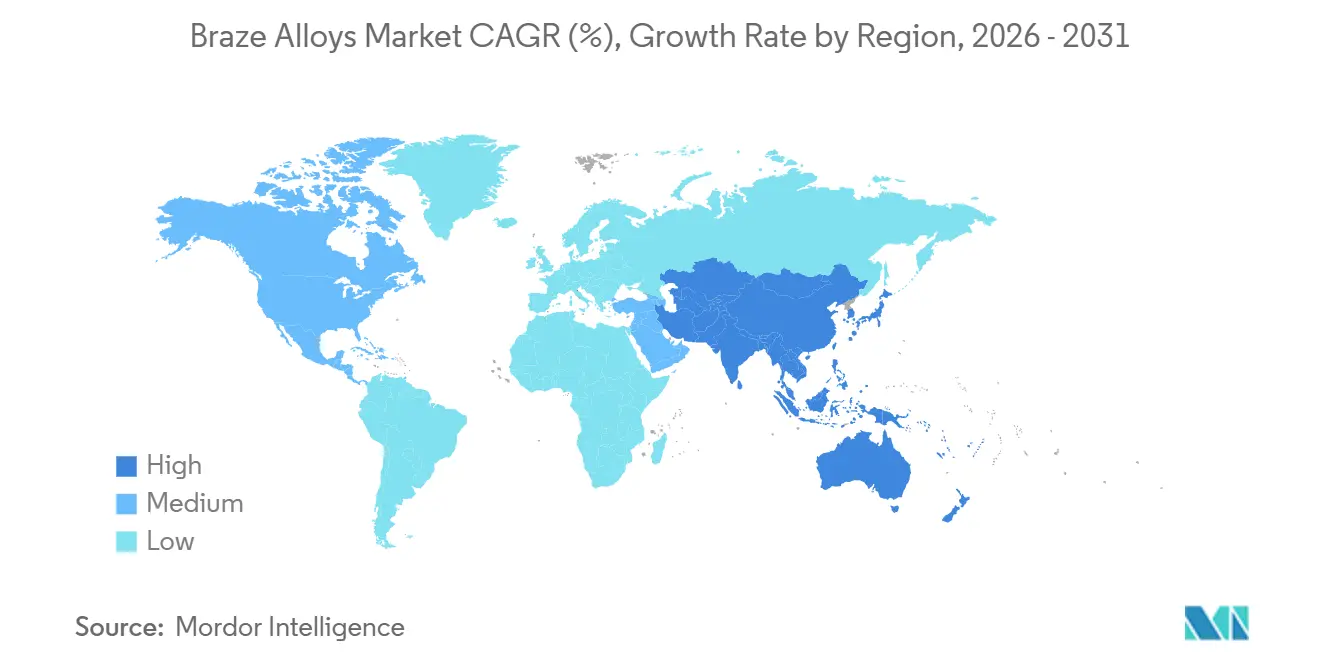
| Fastest Growing Market | Asia-Pacific |
| Largest Market | Asia-Pacific |
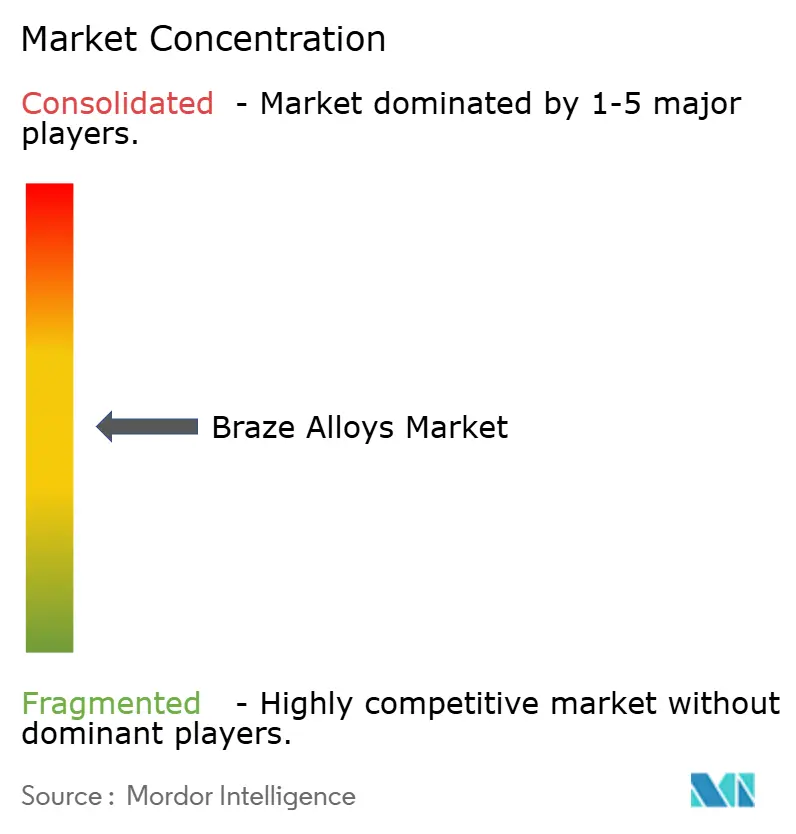
| Market Concentration | Medium |
Major Players *Disclaimer: Major Players sorted in no particular order Image © Mordor Intelligence. Reuse requires attribution under CC BY 4.0. | |

Braze Alloys Market Analysis by Mordor Intelligence
The Braze Alloys Market size is estimated at USD 2.58 billion in 2026, and is expected to reach USD 3.16 billion by 2031, at a CAGR of 4.12% during the forecast period (2026-2031). This measured trajectory reflects the transition from legacy joining techniques toward high-performance brazing solutions that tolerate higher service temperatures, tighter leak-rate limits, and multi-metal assemblies. Electric-vehicle battery cold plates, aerospace turbine-blade repairs, and compact HVAC-R heat exchangers are dictating new material specifications and production-line automation, reshaping procurement priorities for both OEMs and Tier-1 suppliers. Copper-based fillers retain cost leadership, yet nickel-cobalt blends are moving quickly into power electronics and extreme-temperature duties. At the same time, automation-friendly filler geometries such as rings and preforms are displacing manual rod and wire feeding, cutting cycle time, and scrap in lights-out manufacturing cells. Regionally, Asia-Pacific dominates value creation on the back of China’s EV supply chain and India’s heat-exchanger export boom, while Europe faces compliance pressures from stricter toxic-metal exposure limits.
Key Report Takeaways
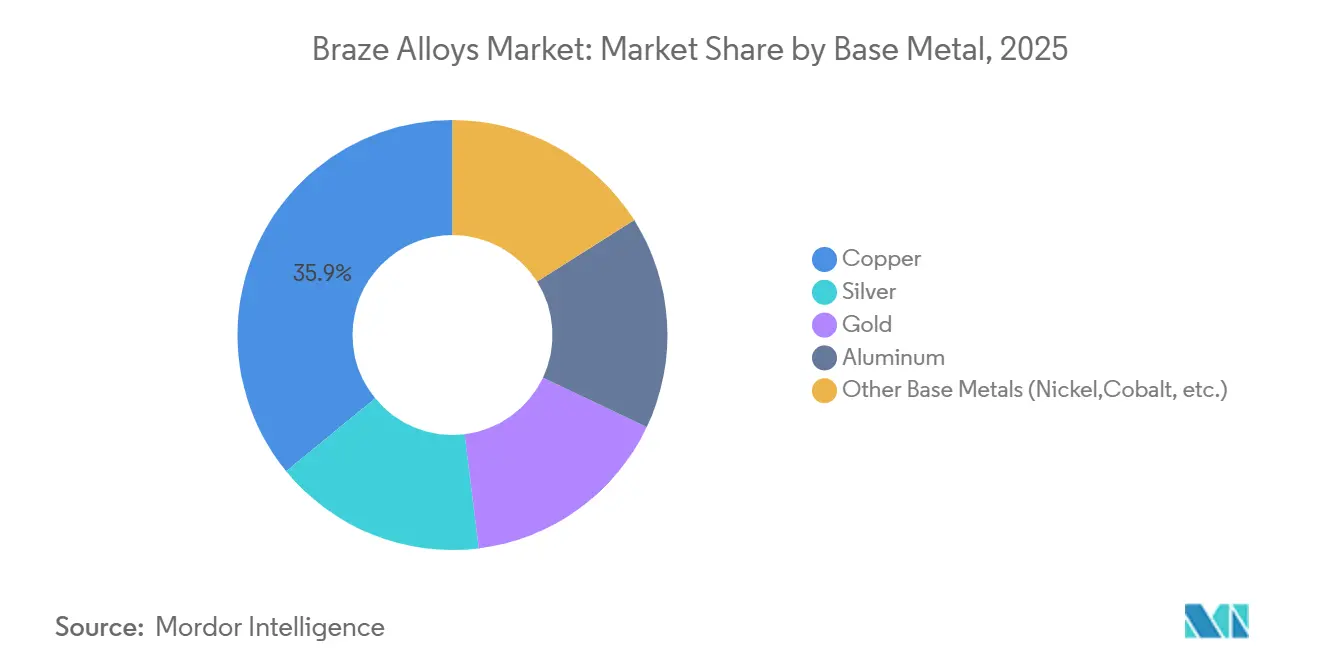
- By base metal, copper captured 35.92% of the braze alloys market share in 2025, whereas the other base metal segment is forecast to expand at a 4.82% CAGR through 2031.
- By filler form, rod and wire formats held 40.04% of 2025 revenue, while rings and preforms are set to post the fastest 5.04% CAGR over the same outlook.
- By temperature range, medium-temperature fillers commanded 50.65% of demand in 2025; high-temperature fillers will register the quickest 4.59% CAGR to 2031.
- By end-user industry, automotive applications accounted for 30.57% of 2025 consumption, but medical, energy, and other diversified uses are rising at a 4.93% CAGR.
- By geography, Asia-Pacific secured 46.38% of the 2025 value and is projected to advance at a 5.16% CAGR during 2026-2031.
Note: Market size and forecast figures in this report are generated using Mordor Intelligence’s proprietary estimation framework, updated with the latest available data and insights as of January 2026.
Global Braze Alloys Market Trends and Insights
Driver Impact Analysis*
| Drivers | (~) % Impact on CAGR Forecast | Geographic Relevance | Impact Timeline |
|---|---|---|---|
| Adoption of brazing over welding and soldering | +1.2% | Global, concentrated in North America and EU vehicle clusters | Medium term (2-4 years) |
| Surging demand for aluminum-based brazes in automotive heat exchangers | +1.0% | China, India, Thailand, spill-over to North America | Short term (≤ 2 years) |
| EV power-electronics uptake of nickel-based induction pastes | +0.9% | China, South Korea, United States, Germany | Medium term (2-4 years) |
| Growth of the HVAC-R industry raising braze consumption | +0.7% | India, Southeast Asia, Middle East, global export hubs | Long term (≥ 4 years) |
| Emergence of high-entropy braze alloys for extreme environments | +0.4% | U.S. and EU aerospace hubs, select APAC defense contractors | Long term (≥ 4 years) |
| Source: Mordor Intelligence | |||
Adoption of Brazing Over Welding and Soldering
Manufacturers are pivoting toward brazing because it secures joint strengths approaching 90% of parent-metal yield while avoiding heat-affected-zone cracking that often follows fusion welding. Controlled-atmosphere furnaces now dominate aluminum radiator production, cutting scrap from 8% to under 2% and saving up to USD 1.8 million per assembly line annually. Soldering cannot meet 150 °C under-hood duty cycles, so OEMs increasingly specify brazed busbars and cooling plates for electric-drive platforms. Equipment suppliers confirm that 60% of all new brazing furnace orders booked in 2025 were for automotive Tier-1 plants in China and Mexico, regions that previously relied on spot welding.
Surging Demand for Aluminum-Based Brazes in Automotive Heat Exchangers
Al-Si brazes in the 7–12 % silicon range remain the backbone of heat-exchanger cores, and battery electric vehicles multiply surface-area requirements two to three times versus internal-combustion layouts. A typical EV pack now houses up to six liquid-cooling circuits, each demanding leak-rate guarantees below 1 g/year over a 150,000 km service life[1]Society of Automotive Engineers, “Thermal Management in Electric Vehicles,” sae.org. India’s component exports grew 18% in fiscal 2025 as global OEMs diversified their supply chains. Alloy tweaks that add manganese and copper are extending fatigue life by 25% in accelerated thermal-shock tests, helping suppliers meet warranty targets.
EV Power-Electronics Uptake of Nickel-Based Induction Pastes
Silicon-carbide inverters run above 175 °C, forcing die-attach materials to endure up to 100,000 thermal cycles. Nickel-phosphorus brazes, heated by induction in under 60 s, cut intermetallic growth by 40% compared with silver-copper eutectics, extending module warranties to 12 years[2]IEEE Power Electronics Society, “Reliability of Nickel Brazes in SiC Modules,” ieee.org. Chinese module makers shipped more than 15 million SiC units in 2025, a 35% jump within one year, accelerating nickel-braze consumption.
Growth of the HVAC-R Industry Raising Braze Consumption
India’s HVAC market is forecast to exceed USD 10 billion by 2028, prompting domestic firms to add automated torch-brazing cells capable of sub-45-second joint cycles.
Restraint Impact Analysis*
| Restraints | (~) % Impact on CAGR Forecast | Geographic Relevance | Impact Timeline |
|---|---|---|---|
| Base-metal price volatility | -0.8% | Global, pronounced in silver-intensive segments | Short term (≤ 2 years) |
| Toxic-metal (Cd, Pb) regulatory bans | -0.5% | EU and North America, extending to export-oriented APAC plants | Medium term (2-4 years) |
| Shortage of furnace-qualified labour | -0.4% | Global | Medium term (2-4 years) |
| Source: Mordor Intelligence | |||
Base-Metal Price Volatility
Silver prices swung between USD 22 and USD 32 per troy ounce during 2024-2025. Every 10% uptick pushes finished alloy cost by up to 6%, yet annual contracts delay pass-through for nine months, pressuring margins. Copper prices likewise fluctuated from USD 8,200 to USD 10,500 per metric ton, hitting HVAC-R filler economics. Smaller suppliers lacking hedging programs defer research and development spending, slowing new alloy development.
Toxic-Metal (Cd, Pb) Regulatory Bans
EU Directive 2024/869 caps occupational lead exposure at 0.03 mg/m³ by 2029, compelling aerospace MRO shops to overhaul ventilation or shift to lead-free formulations. Cadmium-bearing brazes already face RoHS restrictions, yet replacing Cd with Zn or Sn changes wetting behavior, triggering 18-24 month requalification cycles for each of 40-plus legacy filler codes in a single engine platform. Compliance costs weigh heaviest on European alloy houses working under shorter enforcement deadlines.
*Our forecasts treat driver/restraint impacts as directional, not additive. The impact forecasts reflect baseline growth, mix effects, and variable interactions.
Segment Analysis
By Base Metal: Copper Dominates While Nickel-Cobalt Accelerates
Copper-based fillers captured 35.92% of the braze alloys market share in 2025, reflecting their low unit cost in HVAC-R coils and power-distribution busbars. The other base metals segment, including Nickel and cobalt systems, is forecast for a 4.82% CAGR, riding on aerospace turbine-blade refurbishment and SiC power module adoption. Gold and silver fillers occupy high-reliability niches where biocompatibility or thermal stability warrants premium pricing. Aluminum-silicon alloys underpin vehicle heat exchangers, with controlled-atmosphere brazing enabling thin-wall geometries and corrosion resistance.
Processability and temperature ceilings explain adoption curves. Copper-phosphorus compositions melt at 700–850 °C, balancing throughput and joint strength for refrigerant circuits. Nickel-chromium-boron blends withstand 1,000 °C and oxidative exhaust gases, suiting turbine repairs. These distinctions underpin the braze alloys market as manufacturers match performance envelopes to new duty cycles.


By Filler Form: Preforms Rise in Automated Cells
Rod and wire formats remained top-selling at 40.04% of the 2025 value, favored in manual torch operations and batch furnaces. However, rings and preforms are growing at 5.04% CAGR thanks to induction-brazing robotics in EV inverter assembly lines. Pre-shaped aluminum-silicon rings allow simultaneous joining of up to 16 cold-plate ports per furnace run, trimming takt time by 35% and lifting first-pass yield.
Powder and paste fillers dominate electronics and small-joint work, where screen-printing and dispensing heads deposit 0.05-gram charges with ±0.01-gram accuracy. Foil and ribbon variants address aerospace honeycomb structures, delivering uniform melt layers that avoid starved joints. The outcome is a diverse form-factor portfolio that keeps the braze alloys market responsive to automation trends.
By Temperature Range: Medium-Temperature Leads, High-Temperature Gains
Medium-temperature fillers (450–800 °C) generated 50.65% of 2025 demand, mirroring automotive radiator and HVAC-R coil volumes. Low-temperature alloys under 450 °C stay in niche electronics uses due to limited mechanical strength. High-temperature fillers, now expanding at 4.59% CAGR, support turbine-blade overhaul intervals extended to 30,000 flight hours and gas-turbine service life boosts to 32,000 operating hours.
NASA evidence of 400 MPa shear strength in high-entropy brazes speeds migration from legacy nickel-boron blends, opening headroom for future 1,200 °C engine cores. This shift secures long-run momentum for the braze alloys market size in repair and refurbishment workflows where component replacement costs surpass USD 5,000.
By End-User Industry: Automotive Anchors, Diversified Uses Expand
Automotive held 30.57% of 2025 consumption, anchored by aluminum heat-exchanger production for both internal-combustion and electric drivetrains. Diversified other end-user industries segment, which mainly includes medical instruments, concentrated solar receivers, and industrial heat transfer, is advancing at a 4.93% CAGR, insulating suppliers from vehicle-cycle volatility.
Medical devices rely on biocompatible gold or silver fillers that survive repeated steam sterilization, while solar tower receivers exploit nickel-based brazes for 650 °C service. Industrial plate-fin exchangers in chemical plants achieve 40% higher heat-flux density after vacuum brazing. This mix broadens the braze alloys industry revenue base and stabilizes demand.

Geography Analysis
Asia-Pacific commanded 46.38% of 2025 revenue and is projected to grow 5.16% annually through 2031, driven by China’s 9 million BEV output and India’s double-digit heat-exchanger export growth. Japan supplies precision nickel-based brazing for turbine components, whereas South Korea’s battery-pack lines demand tight-leak aluminum cold-plate joints. Southeast Asia captures production relocating from higher-cost Chinese provinces, with Vietnam scaling electronics contract manufacturing.
North America's braze alloys demand is led by aerospace MRO activity requiring high-temperature nickel fillers. Mexico exported USD 8 billion in thermal-management modules, leveraging trade agreements and near-shoring trends. The United States benefits from the Inflation Reduction Act, which funds domestic inverter and battery assembly, thereby enlarging local filler-powder demand.
Europe accounted for a considerable market share in 2025 but faces compliance costs tied to toxic-metal bans. Germany’s automotive sector drives copper and aluminum filler use, whereas France leans on nickel fillers for jet-engine parts. Nordic countries invest in vacuum-brazed marine heat exchangers. South America and the Middle East and Africa each supplied under 5% of value yet register steady growth tied to Brazilian vehicle output and Gulf HVAC construction.

Competitive Landscape
The braze alloys market is moderately consolidated, with the top five players collectively accounting for a significant market share of global capacity, signaling moderate concentration. Regional specialists such as Nihon Superior and Saru Silver Alloy maintain agile lead times and custom alloy menus, winning local contracts. Competition hinges on alloy customization, form-factor innovation, and process engineering support. Materion’s 2024 patent filing for a silver-copper-indium filler illustrates ongoing research and development to improve titanium wetting for medical implants.
Braze Alloys Industry Leaders
Lucas-Milhaupt Inc.
Umicore
The Lincoln Electric Company (Harris Products Group)
Prince & Izant Company
Johnson Matthey
- *Disclaimer: Major Players sorted in no particular order

Recent Industry Developments
- January 2025: Lucas-Milhaupt introduced Silvaloy 560, a cadmium-free silver filler meeting AWS A5.8 parameters, supporting EU lead-exposure compliance without furnace modifications.
- October 2024: Materion invested USD 12 million to expand eutectic powder output in Ohio, raising silver-copper capacity by 40% for EV inverter and aerospace demand.


Research Methodology Framework and Report Scope
Market Definitions and Key Coverage
Our study defines the braze alloys market as the annual sales, in value and volume terms, of metal filler materials specifically engineered to join dissimilar substrates at temperatures above 450 deg C yet below their melting points. Coverage spans copper, silver, gold, aluminum, and nickel-based alloys supplied as powders, pastes, foils, preforms, rods, wires, and rings across sixteen major manufacturing nations.
Scope exclusion: fluxes, solder alloys below 450 deg C, and service revenues linked to contract brazing are kept outside the sizing.
Segmentation Overview
- By Base Metal
- Copper
- Silver
- Gold
- Aluminum
- Other Base Metals (Nickel,Cobalt, etc.)
- By Filler Form
- Powder
- Paste
- Foil / Ribbon
- Rod / Wire
- Rings and Preforms
- By Temperature Range
- Low-Temperature (Less than 450 °C)
- Medium-Temperature (450-800 °C)
- High-Temperature (Greater than 800 °C)
- By End-User Industry
- Automotive
- Aerospace and Defense
- Electrical and Electronics
- Construction
- Other End-User Industries(Medical Devices, Energy and Power, etc.)
- By Geography
- Asia-Pacific
- China
- Japan
- India
- South Korea
- ASEAN Countries
- Rest of Asia-Pacific
- North America
- United States
- Canada
- Mexico
- Europe
- Germany
- United Kingdom
- France
- Italy
- Spain
- NORDIC Countries
- Rest of Europe
- South America
- Brazil
- Argentina
- Rest of South America
- Middle East and Africa
- Saudi Arabia
- South Africa
- Rest of Middle East and Africa
- Asia-Pacific
Detailed Research Methodology and Data Validation
Desk Research
We began by mapping production, trade, and end-use footprints through open datasets from sources such as UN Comtrade, the United States Geological Survey, Eurostat PRODCOM, and Japan's Ministry of Economy, Trade and Industry. Industry ratios were refined with insights from trade bodies, including the American Welding Society and the International Brazing & Soldering Association, as well as peer-reviewed articles capturing joint strength behavior by temperature range. Company 10-Ks, environmental filings, and select news archives on Dow Jones Factiva added shipment values, capacity changes, and alloy pricing trends. The sources listed illustrate, but do not exhaust, the secondary material reviewed.
Primary Research
Mordor analysts interviewed alloy producers, application engineers at automotive heat-exchanger plants, and procurement managers in aerospace MRO hubs across North America, Europe, China, India, and Brazil. These conversations clarified real purchase volumes, discount structures, and alloy substitution behavior, then verified our desk-based demand splits and regional growth assumptions.
Market-Sizing & Forecasting
A top-down construct starts with national production plus net imports of core base metals, which are then converted to potential filler-metal demand using prevalence factors for brazing-intensive components (radiators, turbine vanes, power-electronics substrates). Results are cross-checked through sampled average selling price x volume roll-ups from supplier disclosures. Key model drivers include automotive heat-exchanger output, civil aircraft deliveries, PCB fabrication square-meterage, HVAC equipment shipments, and silver price volatility. Forecasts employ multivariate regression with these variables alongside GDP and industrial production indices; scenario analysis adjusts for raw-material price shocks or EV adoption swings. Gaps in bottom-up estimates are reconciled through elasticities observed in primary interviews before figures are frozen.
Data Validation & Update Cycle
Outputs pass three layers of analyst review, variance thresholds against historical series, and anomaly flags versus trade statistics. We refresh every twelve months and issue interim updates if currency swings, trade policy shifts, or capacity announcements move the market materially. A final analyst pass occurs immediately prior to client delivery.
Why Mordor's Braze Alloys Baseline Earns Trust
Published values often differ because each publisher chooses its own alloy mix, application breadth, and currency timing.
By anchoring the model to verifiable production and trade signals, and by aligning our bottom-up checks to live supplier quotes, Mordor minimizes hidden assumptions that inflate or depress totals elsewhere.
Benchmark comparison
| Market Size | Anonymized source | Primary gap driver |
|---|---|---|
| USD 2.48 B (2025) | Mordor Intelligence | - |
| USD 3.81 B (2024) | Global Consultancy A | Includes solder alloys and fluxes; uses list prices rather than net ASPs |
| USD 2.81 B (2025) | Industry Journal B | Applies uniform growth rates, lacks regional production checks, updates biennially |
The comparison shows how scope creep, price assumptions, and slower refresh cycles widen divergence. By grounding every step in transparent variables and annual field validation, Mordor Intelligence delivers a balanced, decision-ready baseline that clients can replicate and defend.


Key Questions Answered in the Report
What is the 2026 value of the braze alloys market?
The braze alloys market size is estimated at USD 2.58 billion in 2026.
How fast will demand for high-temperature braze fillers grow?
High-temperature fillers are projected to register a 4.59% CAGR between 2026 and 2031.
Which region leads global consumption?
Asia-Pacific held 46.38% of 2025 demand and is the fastest-growing region at a 5.16% CAGR.
Why are nickel-based brazes gaining share?
Nickel-phosphorus pastes support SiC power modules operating above 175 °C, extending component warranties to 12 years.
What regulatory change is influencing alloy reformulation in Europe?
EU Directive 2024/869 imposes stricter lead-exposure limits effective 2029, forcing a switch to cadmium- and lead-free fillers.
Page last updated on:


