Neuroendocrine Tumor Treatment Market Size and Share
Market Overview
| Study Period | 2020 - 2031 |
|---|---|
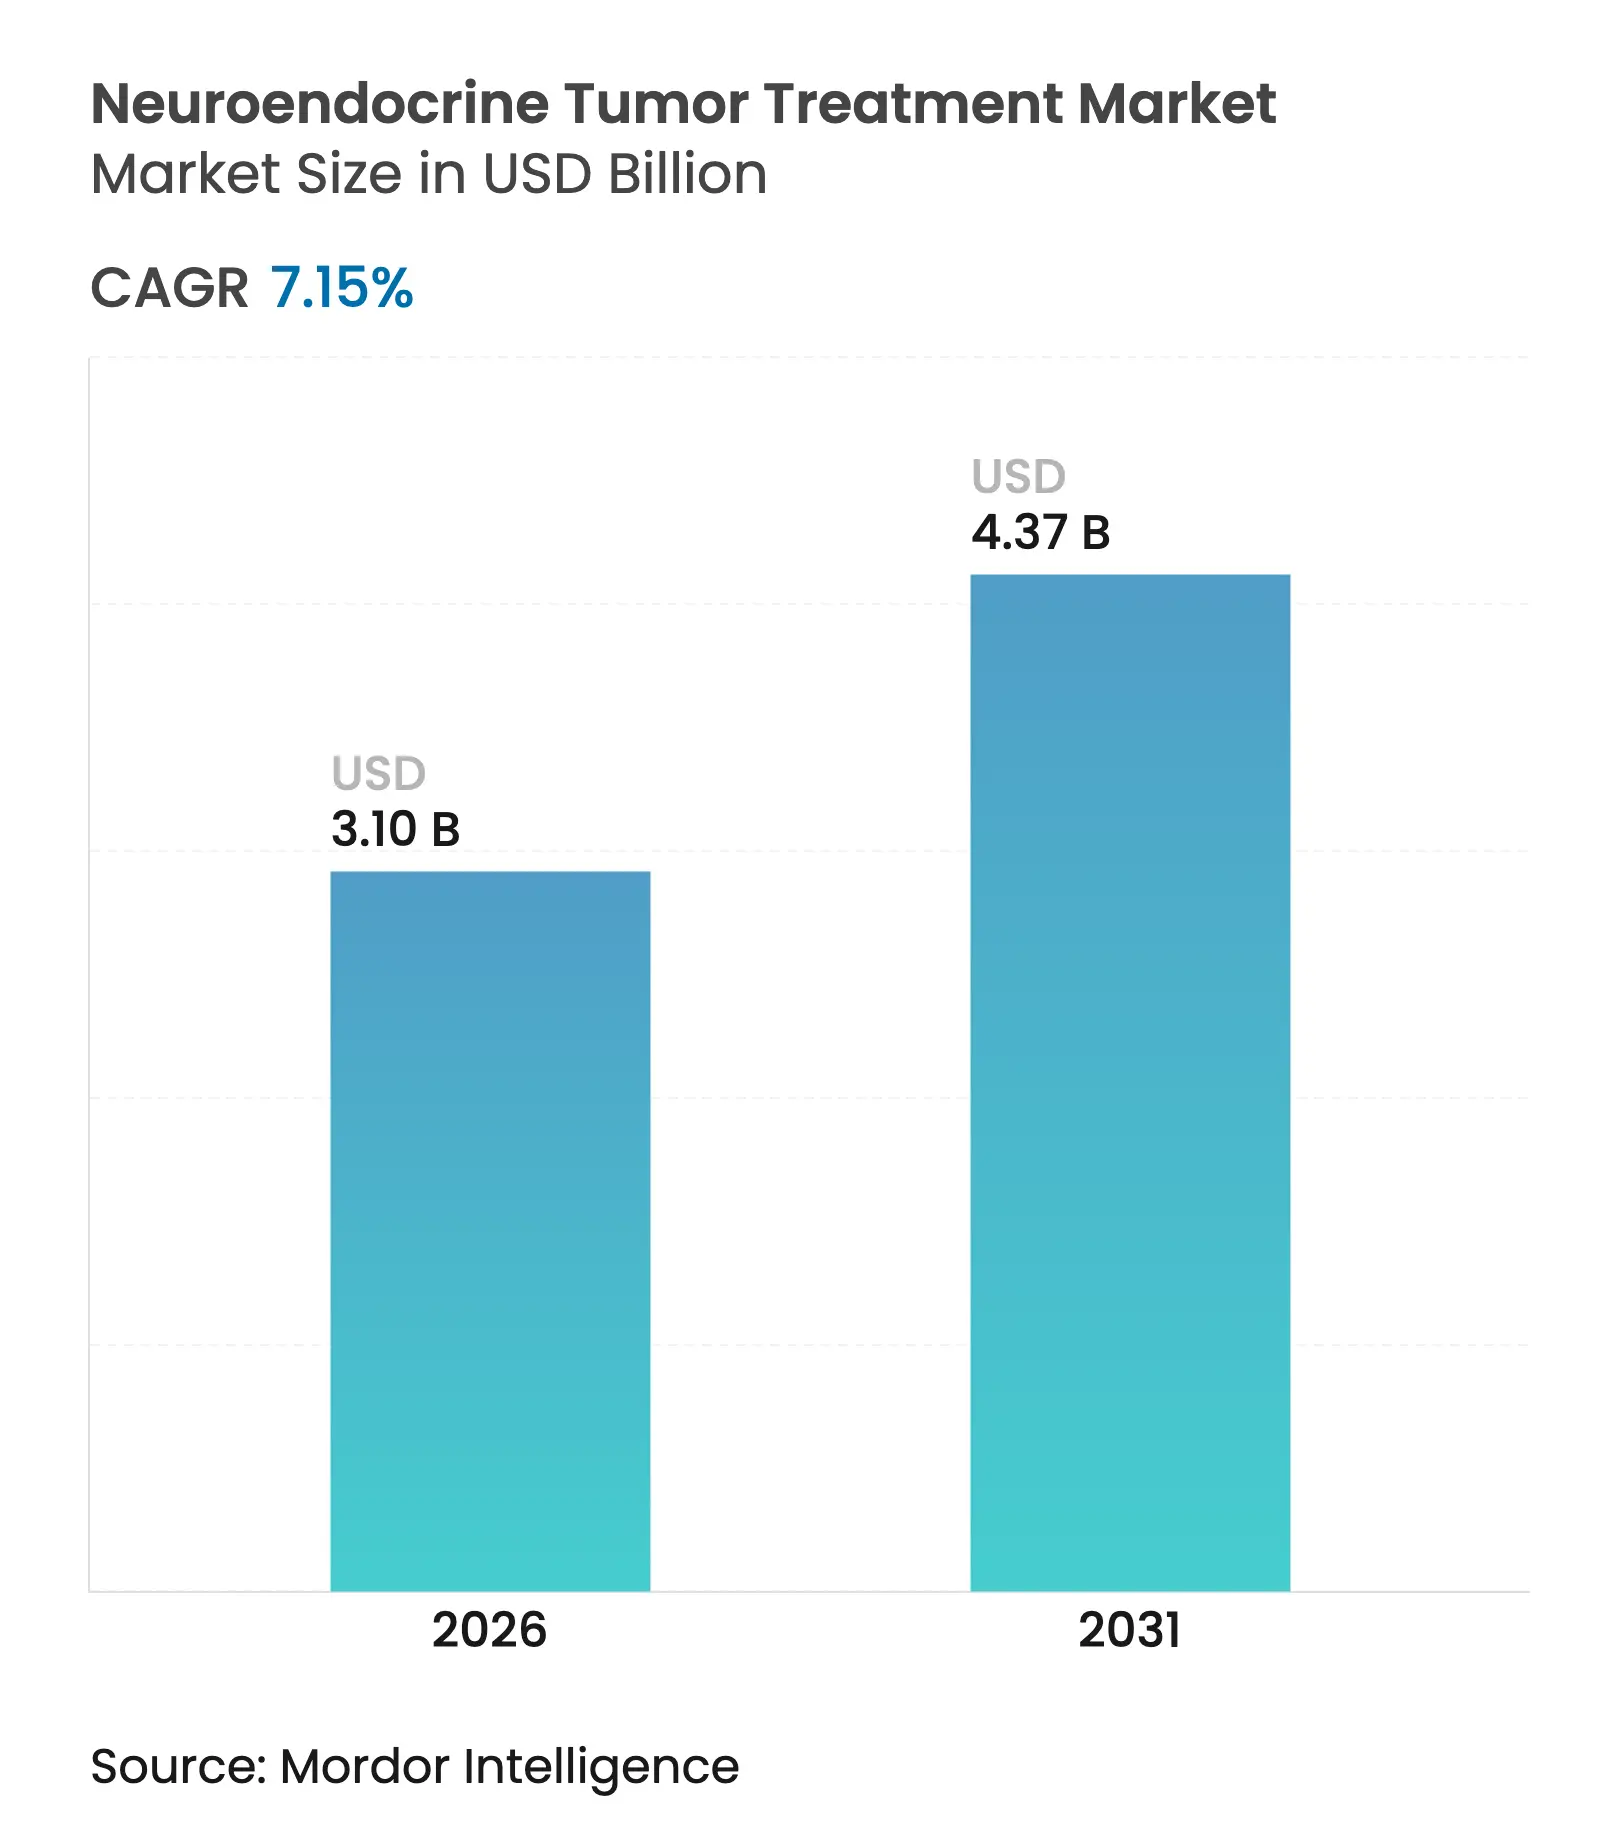
| Market Size (2026) | USD 3.1 Billion |
| Market Size (2031) | USD 4.37 Billion |
| Growth Rate (2026 - 2031) | 7.15 % CAGR |
| Fastest Growing Market | Asia Pacific |
| Largest Market | North America |
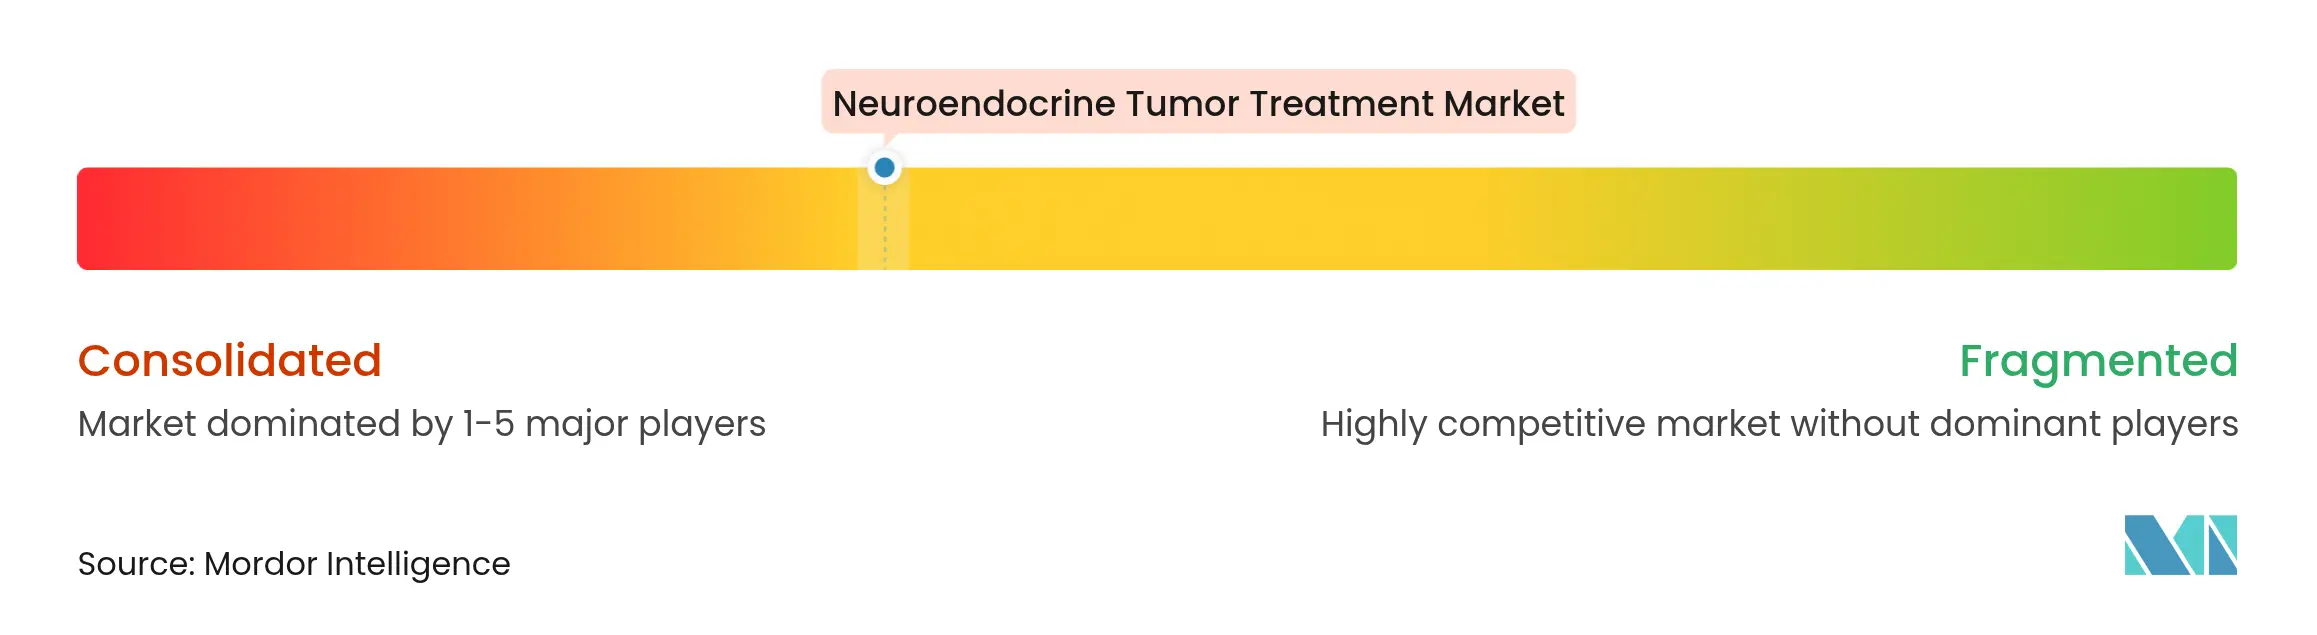
| Market Concentration | Medium |
Major Players *Disclaimer: Major Players sorted in no particular order. Image © Mordor Intelligence. Reuse requires attribution under CC BY 4.0. |
Neuroendocrine Tumor Treatment Market Analysis by Mordor Intelligence
The neuroendocrine tumor treatment market size is expected to grow from USD 2.89 billion in 2025 to USD 3.1 billion in 2026 and is forecast to reach USD 4.37 billion by 2031 at 7.15% CAGR over 2026-2031. Rapid capacity additions for medical isotopes, especially Lutetium-177, remove past supply bottlenecks and let hospitals adopt peptide receptor radionuclide therapy (PRRT) as a first-line option. Forthcoming PRRT guidelines, orphan-drug incentives and positive NETTER-2 data continue to widen clinical acceptance. Investors are backing vertically integrated radiopharmaceutical platforms, while liquid biopsy technologies such as NETest sharpen diagnosis and help match patients to targeted agents. Health systems also gain confidence from large deals—ITM’s NOVA plant and Curium’s Netherlands site—showing that the isotope supply chain can now scale.
Key Report Takeaways
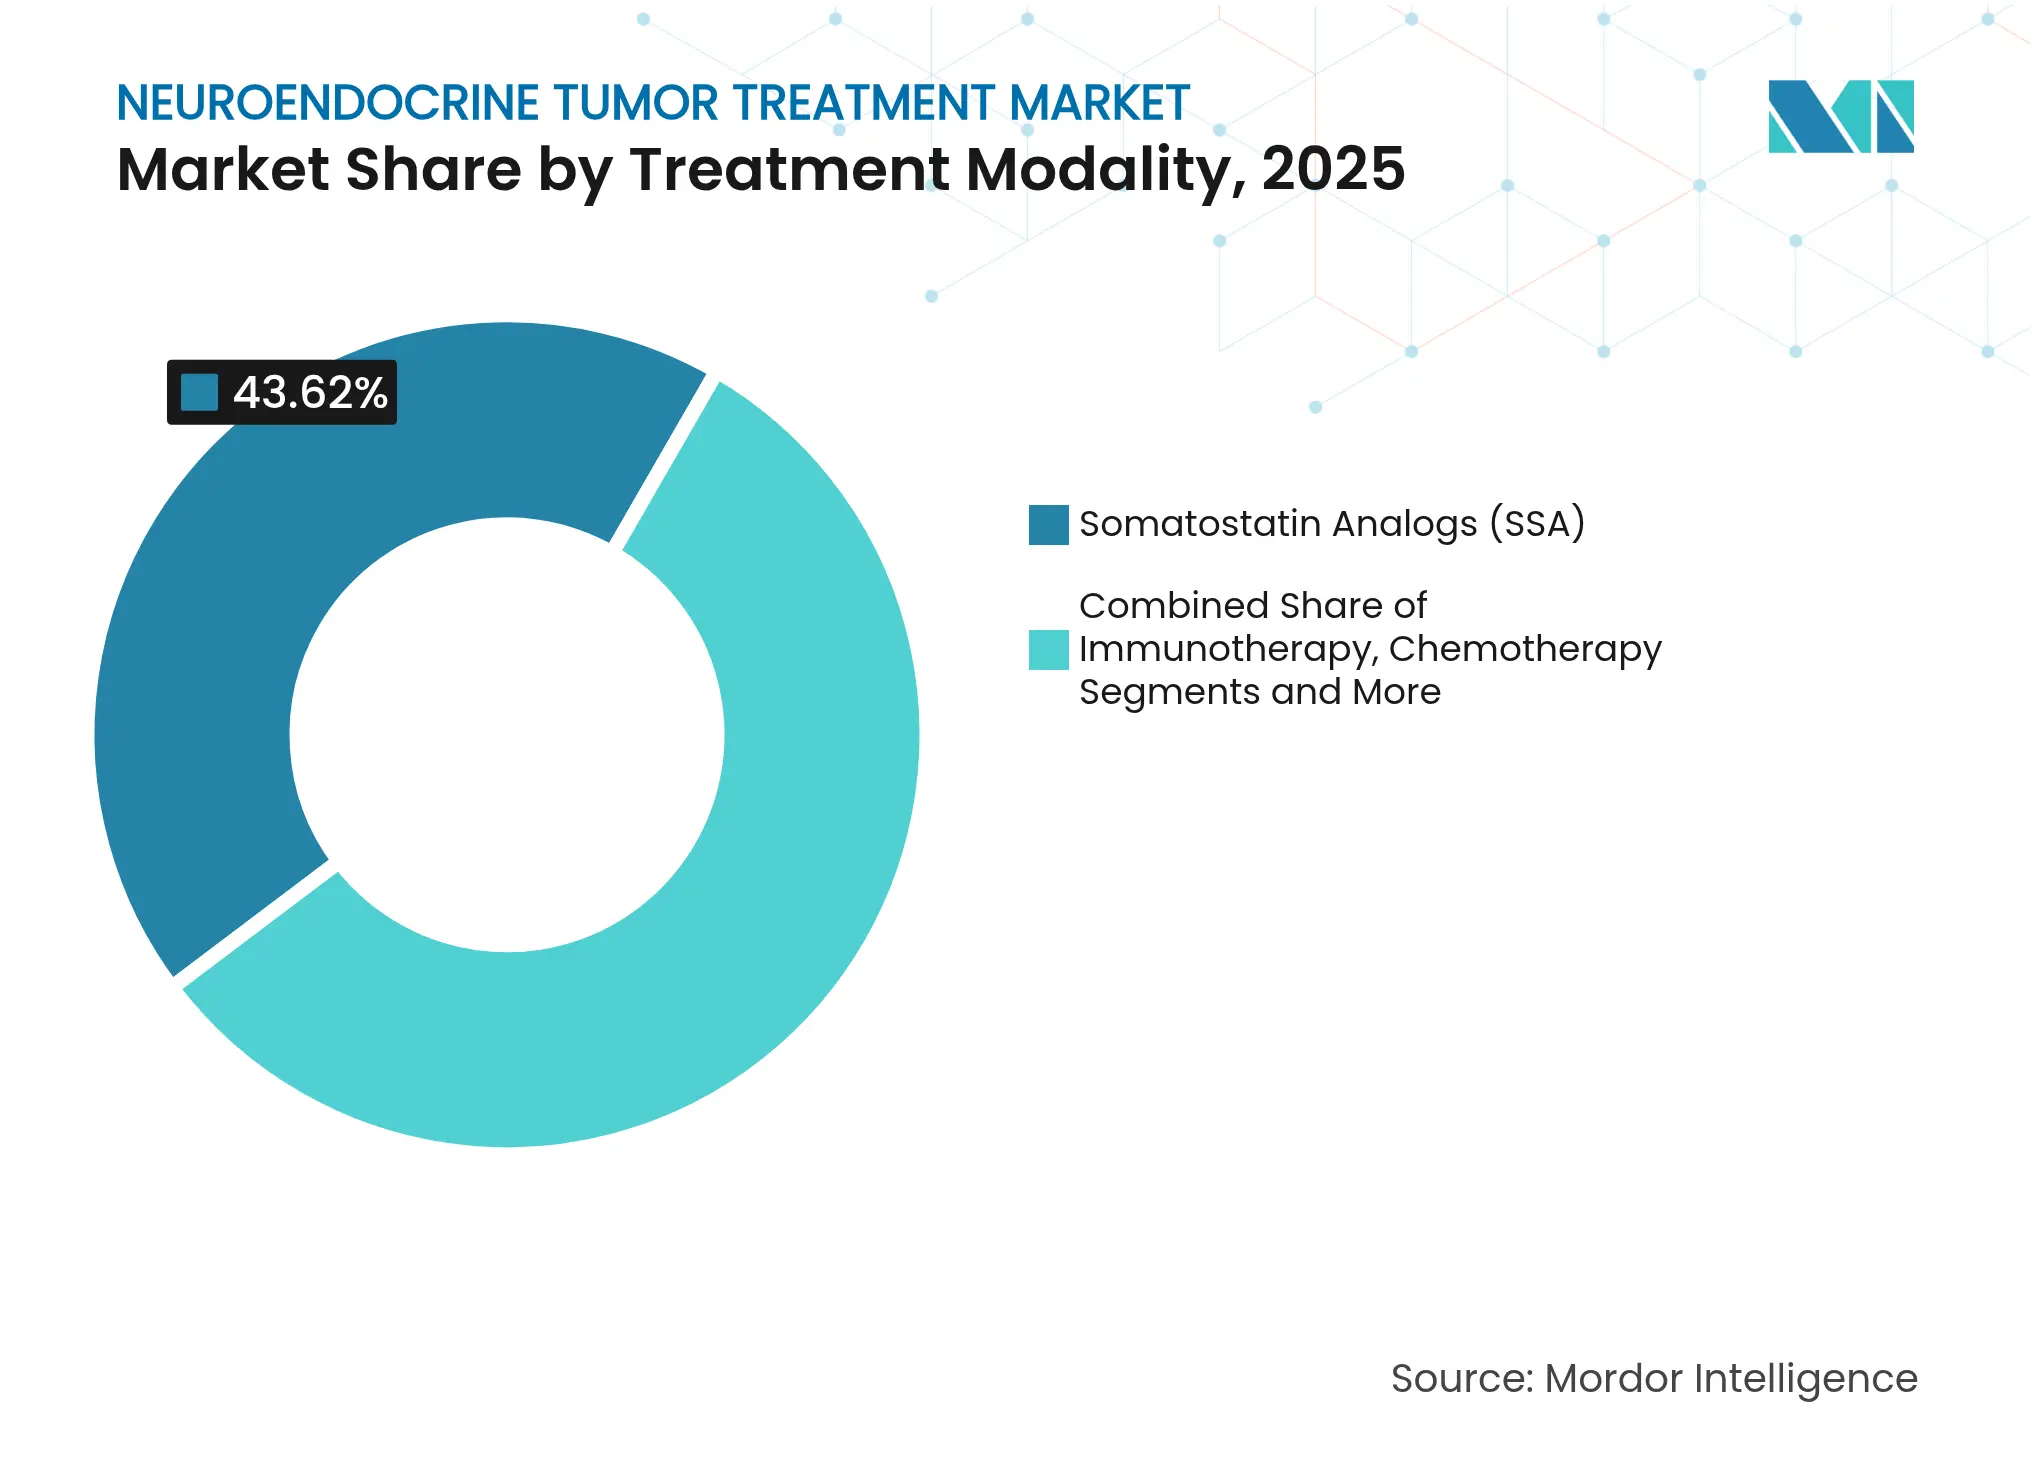
- By treatment modality, somatostatin analogs led with 43.62% of neuroendocrine tumor treatment market share in 2025, while PRRT is projected to advance at a 10.01% CAGR to 2031.
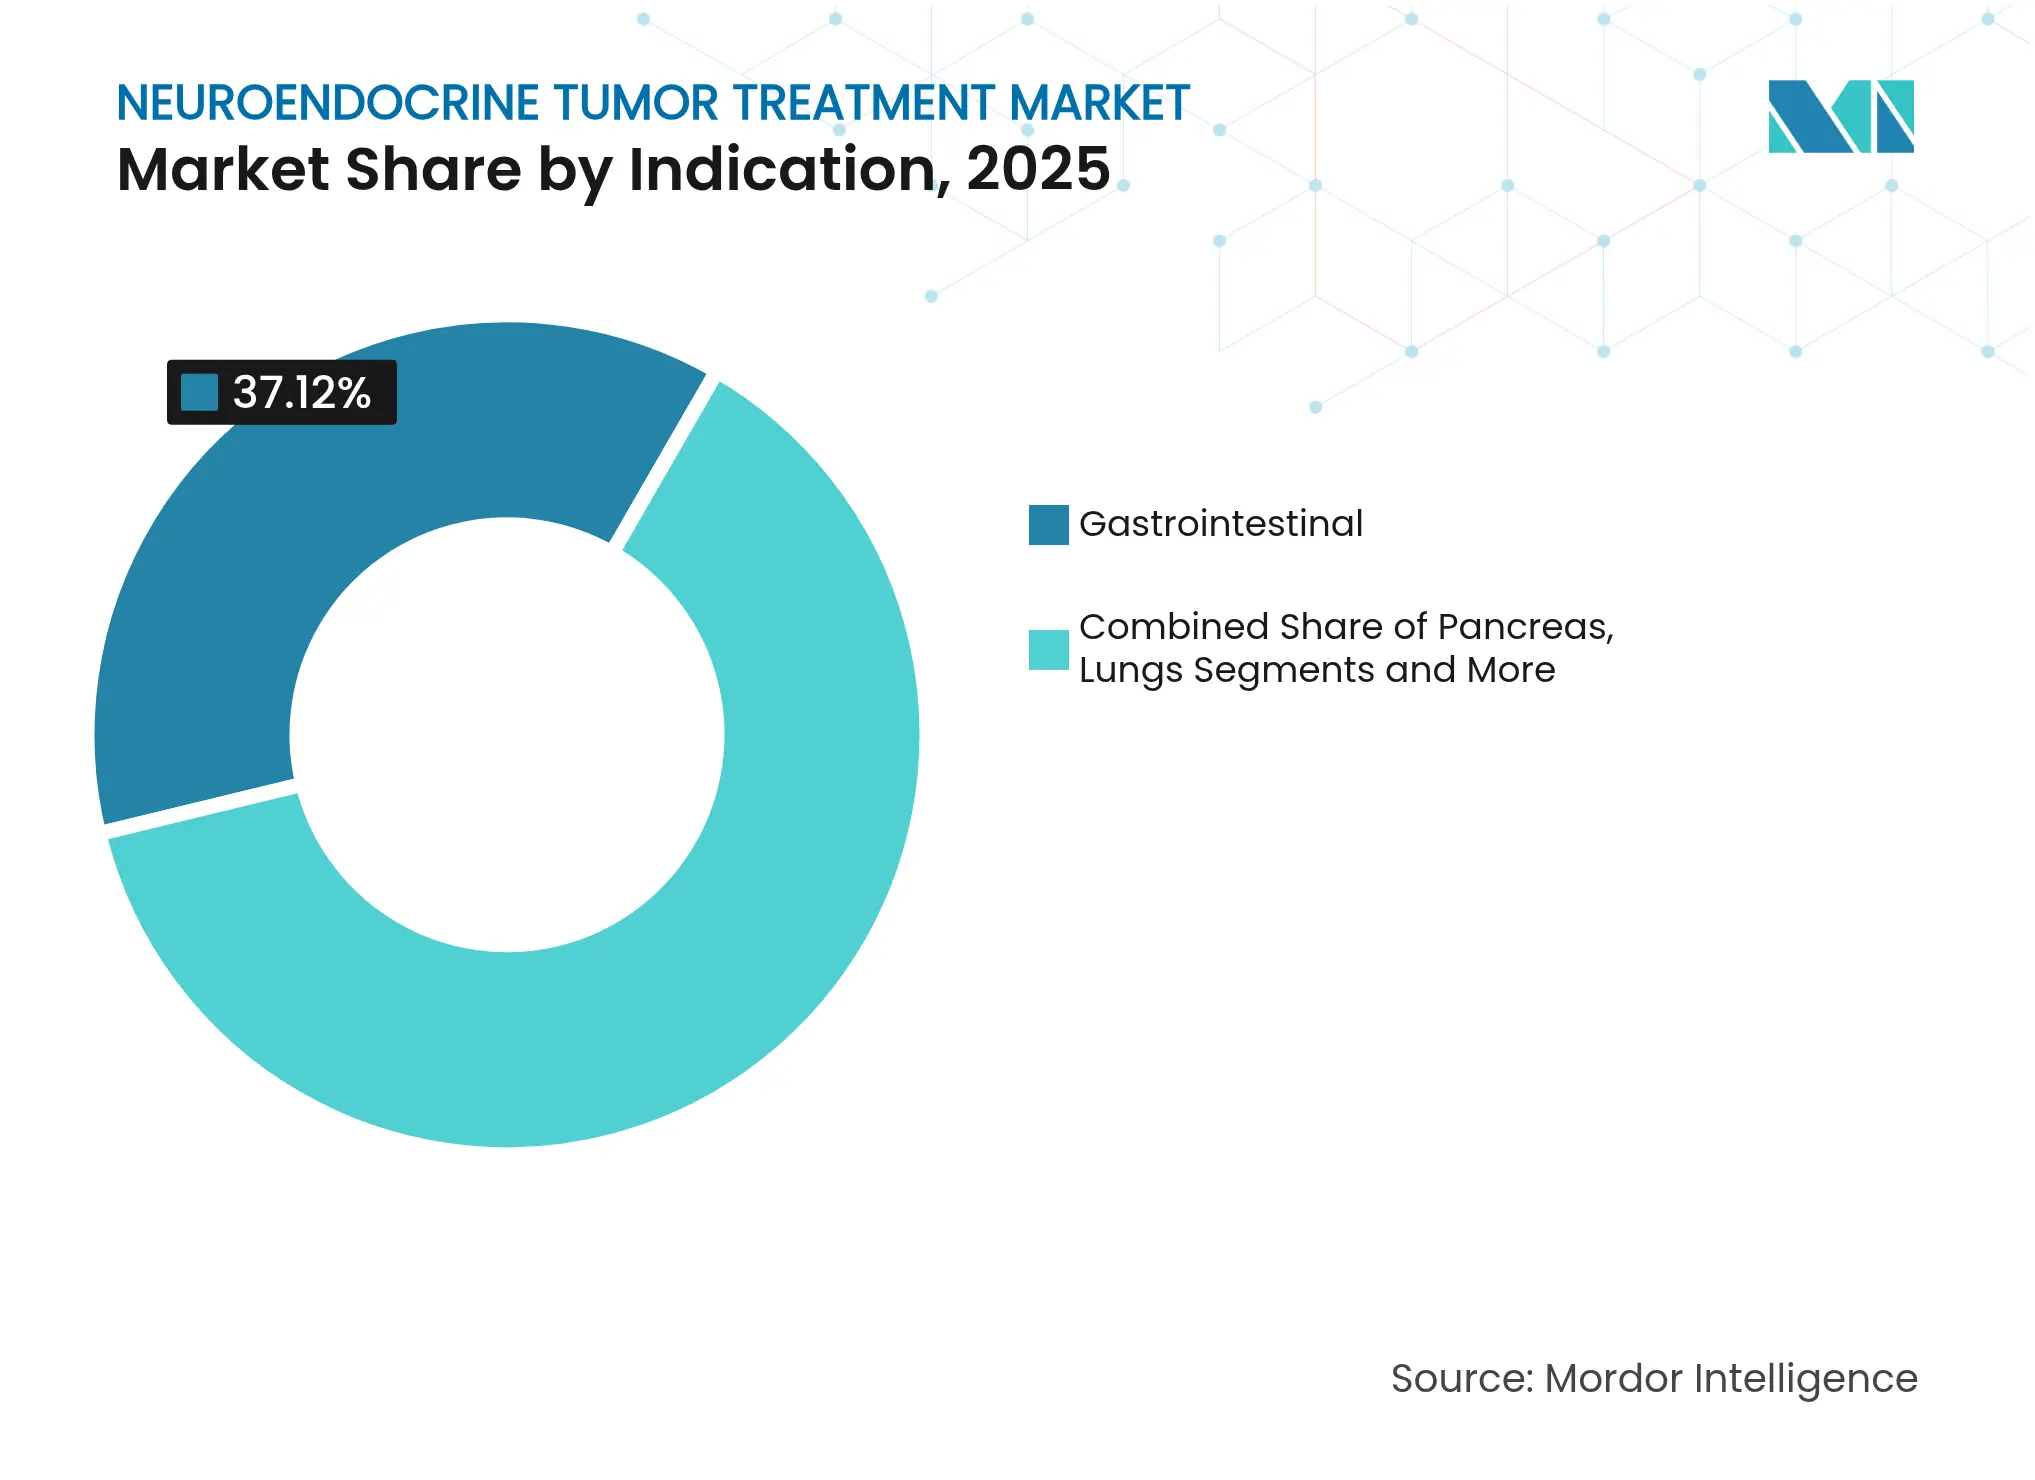
- By indication, gastrointestinal tumors accounted for 37.12% of the neuroendocrine tumor treatment market in 2025; pancreatic NETs are set to expand at an 11.45% CAGR through 2031.
- By end user, hospitals held 59.74% of the neuroendocrine tumor treatment market size in 2025, whereas ambulatory surgery centers will post the fastest 9.55% CAGR to 2031.
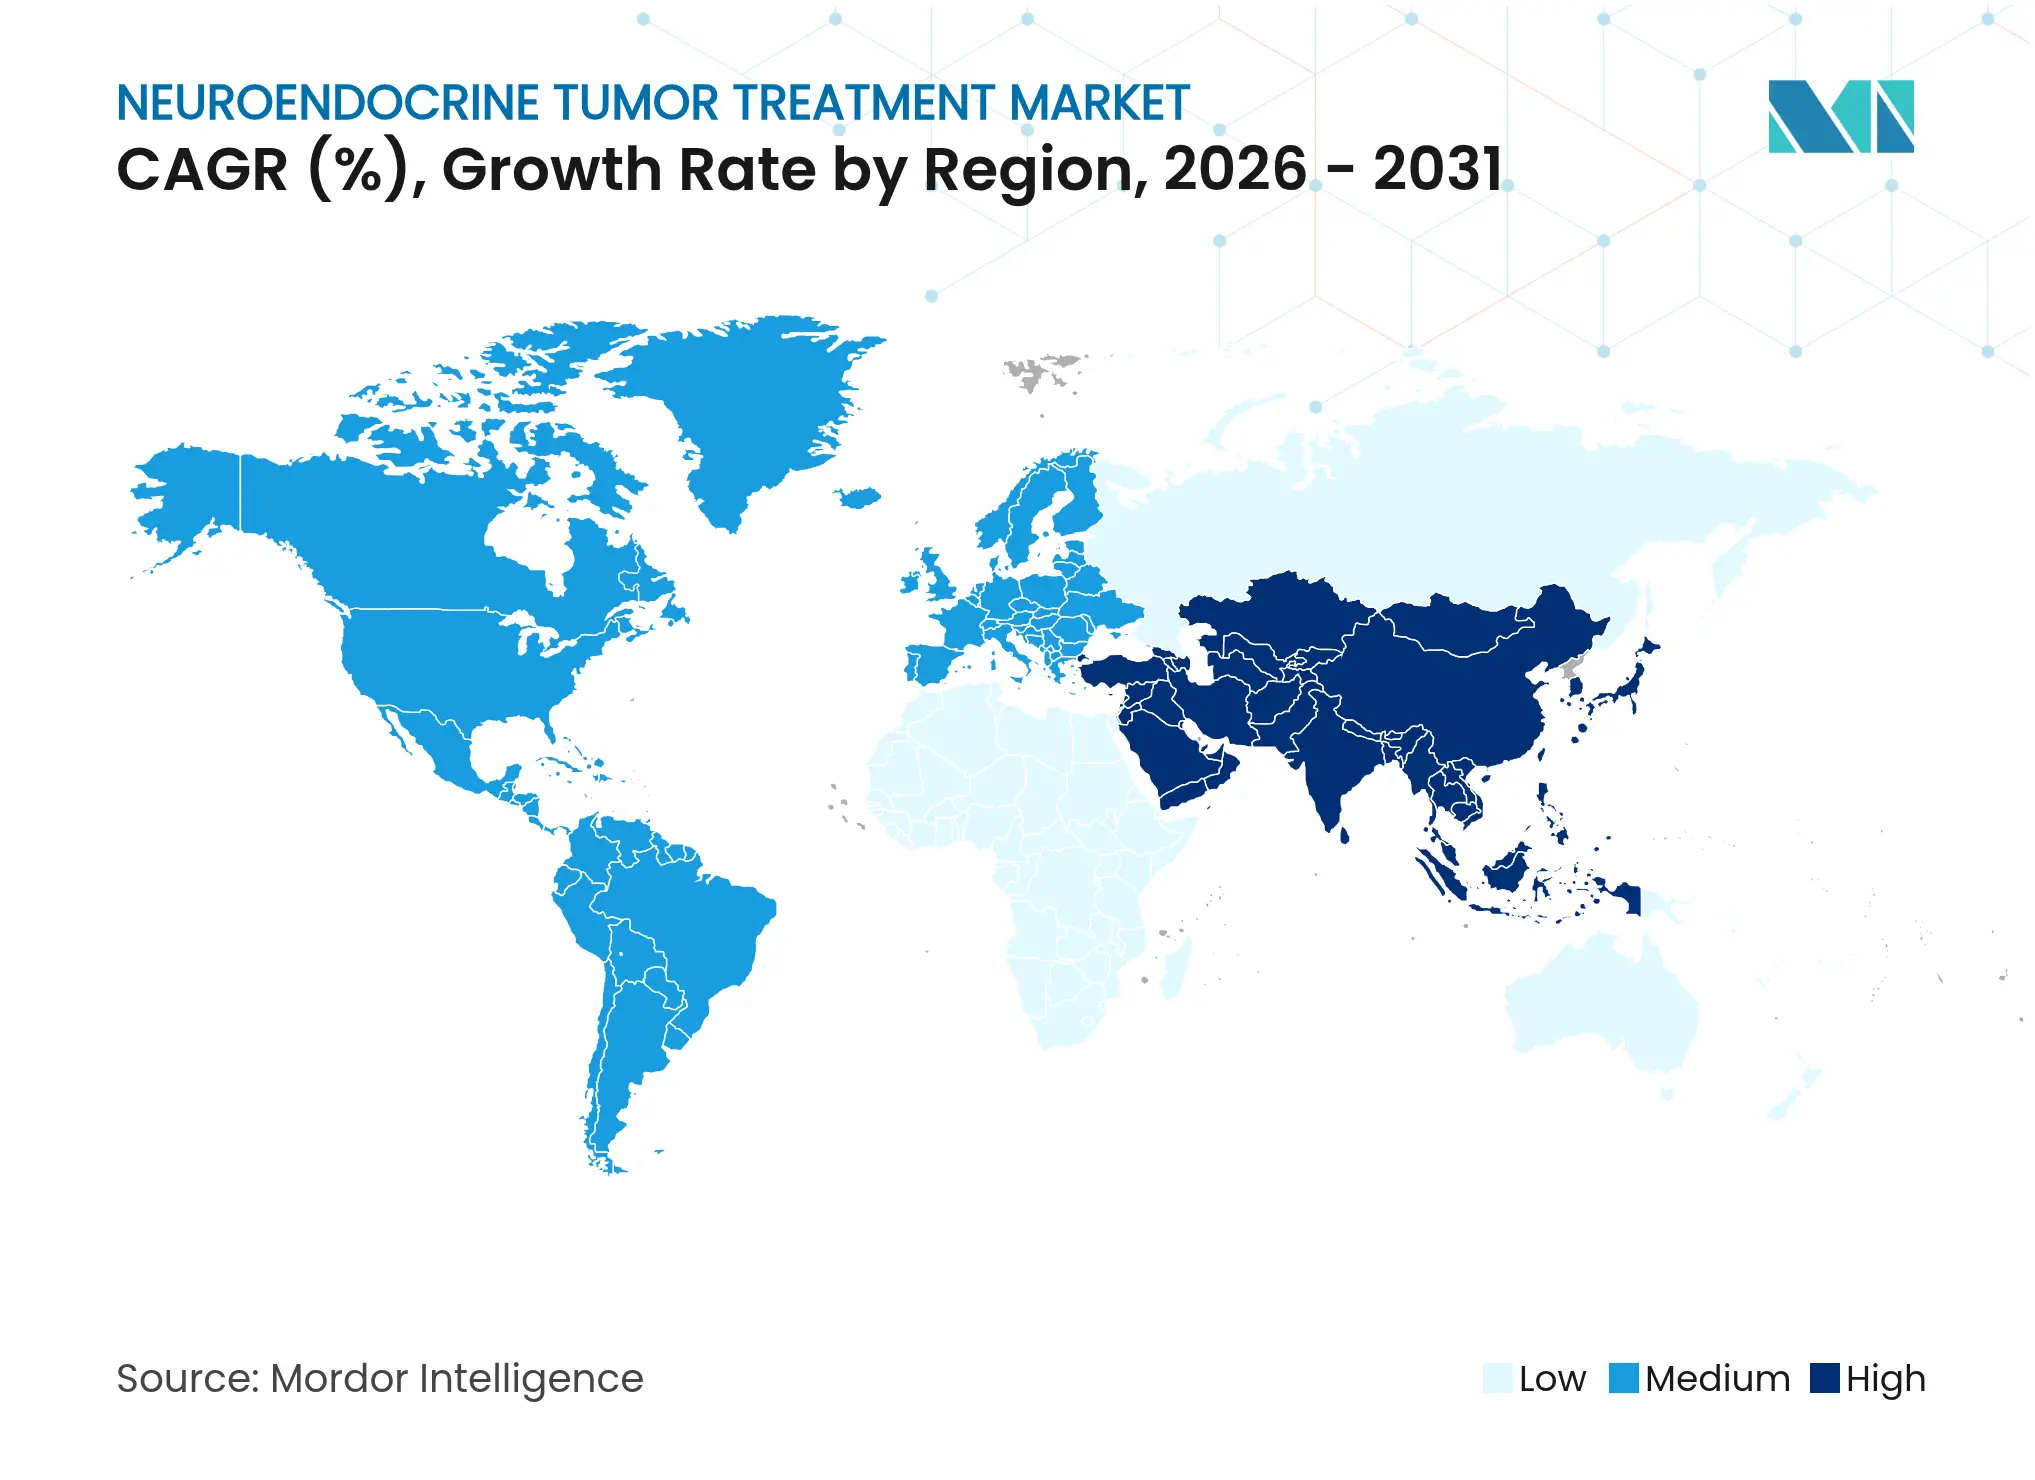
- By region, North America commanded 39.35% share of the neuroendocrine tumor treatment market size in 2025, while APAC shows the strongest 9.86% CAGR to 2031.
Note: Market size and forecast figures in this report are generated using Mordor Intelligence's proprietary estimation framework, updated with the latest available data and insights as of 2026.
Global Neuroendocrine Tumor Treatment Market Trends and Insights
Drivers Impact Analysis
| Driver | (~) % Impact on CAGR Forecast | Geographic Relevance | Impact Timeline | |||
|---|---|---|---|---|---|---|
Rising prevalence of NETs
Rising prevalence of NETs
| +1.2% | North America & Europe | Medium term (2-4 years) | (~) % Impact on CAGR Forecast:
+1.2%
|
Geographic Relevance
:
North America & Europe
|
Impact Timeline
:
Medium term (2-4 years)
|
Advances in imaging & diagnostics
Advances in imaging & diagnostics
| +0.8% | Europe and North America | Short term (≤ 2 years) | |||
Expansion of approved targeted &
PRRT drugs
Expansion of approved targeted &
PRRT drugs
| +1.5% | Early adoption in Europe | Medium term (2-4 years) | |||
Orphan-drug incentives &
favorable payment
Orphan-drug incentives &
favorable payment
| +0.9% | North America & EU, moving to APAC | Long term (≥ 4 years) | |||
Adoption of multi-analyte liquid
biopsy
Adoption of multi-analyte liquid
biopsy
| +0.6% | Europe and North America | Short term (≤ 2 years) | |||
Inclusion of NETs in
precision-oncology R&D
Inclusion of NETs in
precision-oncology R&D
| +0.7% | Developed markets | Long term (≥ 4 years) | |||
| Source: Mordor Intelligence | ||||||
Rising prevalence of NETs
Steadily improving imaging and population aging lift incidence, with Dutch registries counting nearly 1,000 new diagnoses in 2024. Health systems answer by launching specialist NET centers and funding isotope capacity. Clinical teams now detect earlier-stage disease, which broadens the candidate pool for PRRT and targeted agents. Industry surveys estimate 350,000 gastro-enteropancreatic NET patients across the EU and US who need long-term care. Multidisciplinary clinics thus adopt standardized pathways to manage rising caseloads efficiently.
Advances in imaging & diagnostics
NETest liquid biopsy tracks microscopic residual disease more accurately than legacy chromogranin A assays and is being validated across ENETS Centers of Excellence.[1]Sarah Hofland, “The NETest Liquid Biopsy Is Diagnostic for Gastric Neuroendocrine Tumors,” BMC Gastroenterology, bmcgastroenterol.biomedcentral.com When paired with high-resolution PET/CT, clinicians gain a near-real-time view of tumor biology and treatment response. This integration supports earlier therapy switches and underpins precision oncology programs now spreading from Europe to the United States. The upgrade shortens diagnostic delays, a long-standing barrier in NET care.
Expansion of approved targeted & PRRT drugs
EMA approval of Lutathera and positive NETTER-2 readouts shifted PRRT from salvage to frontline use, showing a 72% risk reduction in disease progression when combined with somatostatin analogs. Everolimus remains a backbone targeted option, while cabozantinib secured a positive CHMP opinion in June 2025, expanding choices for advanced disease. Trials now explore PARP-PRRT combos, signalling continued modality convergence.
Orphan-drug incentives & favorable reimbursement
Ten-year EU market exclusivity and US payment add-ons for diagnostic radiopharmaceuticals lower development risk for rare NET agents. CMS introduced separate payment when practical doses exceed the packaged threshold, smoothing hospital economics for new tracers. EMA’s simplified orphan pathway accelerates approvals for follow-on indications, encouraging sponsors to broaden label coverage.
Restraints Impact Analysis
| Restraint | (~) % Impact on CAGR Forecast | Geographic Relevance | Impact Timeline | |||
|---|---|---|---|---|---|---|
High cost of novel therapeutics
High cost of novel therapeutics
| −1.1% | Most pronounced in emerging markets | Medium term (2-4 years) | (~) % Impact on CAGR Forecast:
−1.1%
|
Geographic Relevance
:
Most pronounced in emerging markets
|
Impact Timeline
:
Medium term (2-4 years)
|
Limited physician awareness &
diagnostic lag
Limited physician awareness &
diagnostic lag
| −0.8% | Developing regions | Short term (≤ 2 years) | |||
Safety concerns with PRRT/chemo
regimens
Safety concerns with PRRT/chemo
regimens
| −0.5% | Regulatory focus in developed markets | Long term (≥ 4 years) | |||
Isotope (Lu-177/Ga-68) supply
bottlenecks
Isotope (Lu-177/Ga-68) supply
bottlenecks
| −0.9% | Acute in high-demand regions | Short term (≤ 2 years) | |||
| Source: Mordor Intelligence | ||||||
High cost of novel therapeutics
Lutathera infusions require shielded suites, radiation monitoring and specialist staff, pushing total treatment costs well above the drug price. Health technology assessment bodies in Europe now scrutinize cost-per-QALY results before adding agents to formularies. Multidisciplinary hubs are emerging to pool patient volumes, cut duplication and improve cost-effectiveness.
Isotope (Lu-177/Ga-68) supply bottlenecks
Although ITM’s NOVA plant is the largest producer worldwide, global demand still outpaces supply during maintenance outages. Projects like IHI-ILLUMINATE aim to recycle ytterbium feedstock and reduce upstream choke points. Meanwhile, ASP Isotopes is building an enrichment line for Yb-176 in South Africa, a move designed to diversify regional production aspisotopes.com.
Segment Analysis
By Treatment Modality: PRRT emerges as growth engine
Somatostatin analogs retained 43.62% share in the neuroendocrine tumor treatment market during 2025, reflecting long-standing use for symptom control and tumor stabilization. PRRT, buoyed by community uptake of [¹⁷⁷Lu]Lu-Oxodotreotide, is projected to log a 10.01% CAGR and stands out as the primary growth engine. PRRT protocols gained uniformity through the Italian Association of Nuclear Medicine’s new guidelines, encouraging broader European uptake. Parallel advances in manufacturing assure a reliable isotope stream, further sustaining momentum.
Clinical preference now shifts toward combination regimens—PRRT plus somatostatin analogs, or PRRT alongside DNA-repair inhibitors under investigation—thereby widening the addressable population. Chemotherapy preserves its role for poorly differentiated carcinomas, while emerging immunotherapy–chemotherapy trials explore synergy in high-grade disease. Targeted therapy, led by everolimus and cabozantinib, offers individualized options for patients unsuitable for radionuclide therapy, underscoring how the neuroendocrine tumor treatment market keeps diversifying.
Note: Segment shares of all individual segments available upon report purchase
By Indication: Pancreatic NETs drive innovation
Gastrointestinal tumors represented 37.12% of the neuroendocrine tumor treatment market in 2025, anchored by mature clinical pathways and routine use of somatostatin analogs. Pancreatic NETs are the growth frontier, exhibiting an 11.45% CAGR to 2031, supported by everolimus, cabozantinib and prospective PRRT studies targeting this subgroup. Lung and thymus NETs also see heightened research interest, with the LEVEL trial highlighting potential survival gains from ¹⁷⁷Lu-edotreotide.
Tumor biology varies widely across sites, prompting investigators to stratify trials by primary location. Midgut lesions often respond best to PRRT, while pancreatic primaries benefit from sequential targeted and surgical approaches. This heterogeneity drives continuous protocol refinement and fuels product development across the neuroendocrine tumor treatment industry.
Note: Segment shares of all individual segments available upon report purchase
By End User: Ambulatory centers gain momentum
Hospitals controlled 59.74% of the neuroendocrine tumor treatment market share in 2025 thanks to in-house nuclear medicine suites and multidisciplinary teams. Outpatient PRRT protocols, however, are shifting administration toward ambulatory surgery centers, which are forecast to grow at 9.55% CAGR. These centers leverage streamlined pathways that shorten patient stay and lower overhead. Specialty oncology clinics partner with isotope suppliers to embed theranostic services, further fragmenting the delivery landscape.
Academic hospitals remain innovation hubs, conducting pivotal trials that shape future standards. Their collaborations with commercial isotope producers ensure early access to next-generation compounds, allowing faster bench-to-bedside translation. This interplay sustains the neuroendocrine tumor treatment market’s technology pipeline while broadening community reach.
Geography Analysis
North America led with 39.35% share of the neuroendocrine tumor treatment market size in 2025. Medicare’s separate payment for high-cost tracers and the FDA’s track record of timely approvals underpin early adoption. Major US cancer centers already integrate PRRT with targeted and checkpoint inhibitors in trial settings, while Canada’s universal system reimburses core PRRT indications nationally.
Europe benefits from the EMA’s orphan-drug pathway and coordinated payer frameworks that streamline access to rare-disease therapies. Local isotope capacity, notably Curium’s Netherlands Lu-177 line, strengthens supply security. Germany, France and the United Kingdom host dense networks of ENETS-accredited centers, ensuring consistent quality across borders. Southern European nations expand capabilities through EU cohesion funds and shared training programs.
Asia-Pacific posts the highest 9.86% CAGR, powered by Japan’s swift regulatory clearance of diagnostic agents and China’s oncology infrastructure build-out. Australia subsidizes PRRT under the Pharmaceutical Benefits Scheme, while South Korea and India establish partnerships with European isotope firms. Regional manufacturers invest in domestic supply chains to avoid import delays, further accelerating neuroendocrine tumor treatment market penetration.

Competitive Landscape
Market Concentration
The neuroendocrine tumor treatment market shows moderate concentration as established pharmaceuticals race emerging radiopharmaceutical specialists. Lantheus deployed more than USD 1 billion on Evergreen Theragnostics and Life Molecular Imaging to secure isotope production and novel tracers. Novartis remains a cornerstone player, sustaining Lutathera post-marketing studies and combining assets with somatostatin analogs. Ipsen expanded its cabozantinib license following strong Phase III data in advanced NETs.
Specialists such as ITM, Curium and Eckert & Ziegler vertically integrate isotope enrichment and drug manufacturing, protecting margins and supply reliability. Crinetics pursues oral paltusotine for carcinoid syndrome, adding a non-radiopharmaceutical differentiator. Academic–industry consortia accelerate alpha-particle research, hinting at next-wave competition. Together, these moves keep pricing pressure in check while broadening therapeutic choices for clinicians worldwide.
Neuroendocrine Tumor Treatment Industry Leaders

*Disclaimer: Major Players sorted in no particular order
Recent Industry Developments
- June 2025: Ipsen received a positive CHMP opinion recommending Cabometyx for advanced pancreatic and extra-pancreatic NETs.
- March 2025: Exelixis gained FDA approval for CABOMETYX in adult and adolescent patients with previously treated well-differentiated pancreatic and extra-pancreatic NETs.
Table of Contents for Neuroendocrine Tumor Treatment Industry Report
1. Introduction
- 1.1Study Assumptions and Market Definition
- 1.2Scope of the Study
2. Research Methodology
3. Executive Summary
4. Market Landscape
- 4.1Market Overview
- 4.2Market Drivers
- 4.2.1Rising Prevalence Of Nets
- 4.2.2Advances In Imaging & Diagnostics
- 4.2.3Expansion Of Approved Targeted & PRRT Drugs
- 4.2.4Orphan-Drug Incentives & Favorable Reimbursement
- 4.2.5Adoption Of Multi-Analyte Liquid Biopsy (Netest)
- 4.2.6Inclusion Of Nets In Precision-Oncology Trials
- 4.3Market Restraints
- 4.3.1High Cost Of Novel Therapeutics
- 4.3.2Limited Physician Awareness & Diagnostic Delays
- 4.3.3Safety Concerns With PRRT/Chemo Regimens
- 4.3.4Isotope (Lu-177/Ga-68) Supply Bottlenecks
- 4.4Value / Supply-Chain Analysis
- 4.5Regulatory Landscape
- 4.6Technology Outlook
- 4.7Porter’s Five Forces Analysis
- 4.7.1Bargaining Power of Suppliers
- 4.7.2Bargaining Power of Buyers
- 4.7.3Threat of New Entrants
- 4.7.4Threat of Substitutes
- 4.7.5Intensity of Competitive Rivalry
5. Market Size and Growth Forecasts (Value-USD)
- 5.1By Treatment Modality
- 5.1.1Somatostatin Analogs (SSA)
- 5.1.2Peptide Receptor Radionuclide Therapy (PRRT)
- 5.1.3Targeted Therapy (TKI/mTOR)
- 5.1.4Immunotherapy (ICI)
- 5.1.5Chemotherapy
- 5.1.6Others (Interferons, Supportive)
- 5.2By Indication
- 5.2.1Gastrointestinal (Mid-gut)
- 5.2.2Pancreas
- 5.2.3Lung
- 5.2.4Other NET Sites
- 5.3By End User
- 5.3.1Hospitals
- 5.3.2Specialty/Oncology Clinics
- 5.3.3Ambulatory Surgery Centers
- 5.3.4Academic & Research Institutes
- 5.4By Geography
- 5.4.1North America
- 5.4.1.1United States
- 5.4.1.2Canada
- 5.4.1.3Mexico
- 5.4.2Europe
- 5.4.2.1Germany
- 5.4.2.2United Kingdom
- 5.4.2.3France
- 5.4.2.4Italy
- 5.4.2.5Spain
- 5.4.2.6Rest of Europe
- 5.4.3Asia-Pacific
- 5.4.3.1China
- 5.4.3.2Japan
- 5.4.3.3India
- 5.4.3.4Australia
- 5.4.3.5South Korea
- 5.4.3.6Rest of Asia-Pacific
- 5.4.4Middle East and Africa
- 5.4.4.1GCC
- 5.4.4.2South Africa
- 5.4.4.3Rest of Middle East and Africa
- 5.4.5South America
- 5.4.5.1Brazil
- 5.4.5.2Argentina
- 5.4.5.3Rest of South America
6. Competitive Landscape
- 6.1Market Concentration
- 6.2Market Share Analysis
- 6.3Company profiles (includes Global level Overview, Market level overview, Core Segments, Financials as available, Strategic Information, Market Rank/Share for key companies, Products and Services, and Recent Developments)
- 6.3.1Novartis AG
- 6.3.2Ipsen SA
- 6.3.3Pfizer Inc.
- 6.3.4F. Hoffmann-La Roche Ltd.
- 6.3.5Eli Lilly and Company
- 6.3.6Boehringer Ingelheim GmbH
- 6.3.7Bristol Myers Squibb
- 6.3.8Lantheus Holdings Inc.
- 6.3.9ITM Isotope Technologies Munich
- 6.3.10Crinetics Pharmaceuticals
- 6.3.11Camurus AB
- 6.3.12Tarveda Therapeutics
- 6.3.13Hutchmed (Hutchison MediPharma)
- 6.3.14Jubilant Radiopharma
- 6.3.15Peptidyne Therapeutics
- 6.3.16Avion Pharmaceuticals
- 6.3.17Exelixis Inc.
- 6.3.18Merck & Co.
7. Market Opportunities and Future Outlook
- 7.1White-Space and Unmet-Need Assessment
Research Methodology Framework and Report Scope
Market Definitions and Key Coverage
Segmentation Overview
- By Treatment Modality
- Somatostatin Analogs (SSA)
- Peptide Receptor Radionuclide Therapy (PRRT)
- Targeted Therapy (TKI/mTOR)
- Immunotherapy (ICI)
- Chemotherapy
- Others (Interferons, Supportive)
- Somatostatin Analogs (SSA)
- By Indication
- Gastrointestinal (Mid-gut)
- Pancreas
- Lung
- Other NET Sites
- Gastrointestinal (Mid-gut)
- By End User
- Hospitals
- Specialty/Oncology Clinics
- Ambulatory Surgery Centers
- Academic & Research Institutes
- Hospitals
- By Geography
- North America
- United States
- Canada
- Mexico
- United States
- Europe
- Germany
- United Kingdom
- France
- Italy
- Spain
- Rest of Europe
- Germany
- Asia-Pacific
- China
- Japan
- India
- Australia
- South Korea
- Rest of Asia-Pacific
- China
- Middle East and Africa
- GCC
- South Africa
- Rest of Middle East and Africa
- GCC
- South America
- Brazil
- Argentina
- Rest of South America
- Brazil
- North America
Detailed Research Methodology and Data Validation
Primary Research
Desk Research
Market-Sizing & Forecasting
Data Validation & Update Cycle
Why our Neuroendocrine Tumor Treatment Baseline is dependable
Benchmark comparison
| Market Size | Anonymized source | Primary gap driver | ||
|---|---|---|---|---|
US$ 2.89 Bn (2025) | Mordor Intelligence | - | Anonymized source:Mordor Intelligence | Primary gap driver:- |
US$ 2.66 Bn (2024) | Global Consultancy A | Uses list prices and omits PRRT revenue outside North America | ||
US$ 2.71 Bn (2024) | Industry Publisher B | Applies blanket uplift to historic sales and keeps incidence static |