
Botanicals Market Size and Share
Market Overview
| Study Period | 2021 - 2031 |
|---|---|
| Market Size (2026) | USD 128.57 Billion |
| Market Size (2031) | USD 174.08 Billion |
| Growth Rate (2026 - 2031) | 6.25 % |
| Fastest Growing Market | Asia Pacific |
| Largest Market | North America |
| Market Concentration | Medium |
Major Players
*Disclaimer: Major Players sorted in no particular order Image © Mordor Intelligence. Reuse requires attribution under CC BY 4.0. |
|
Botanicals Market Analysis by Mordor Intelligence
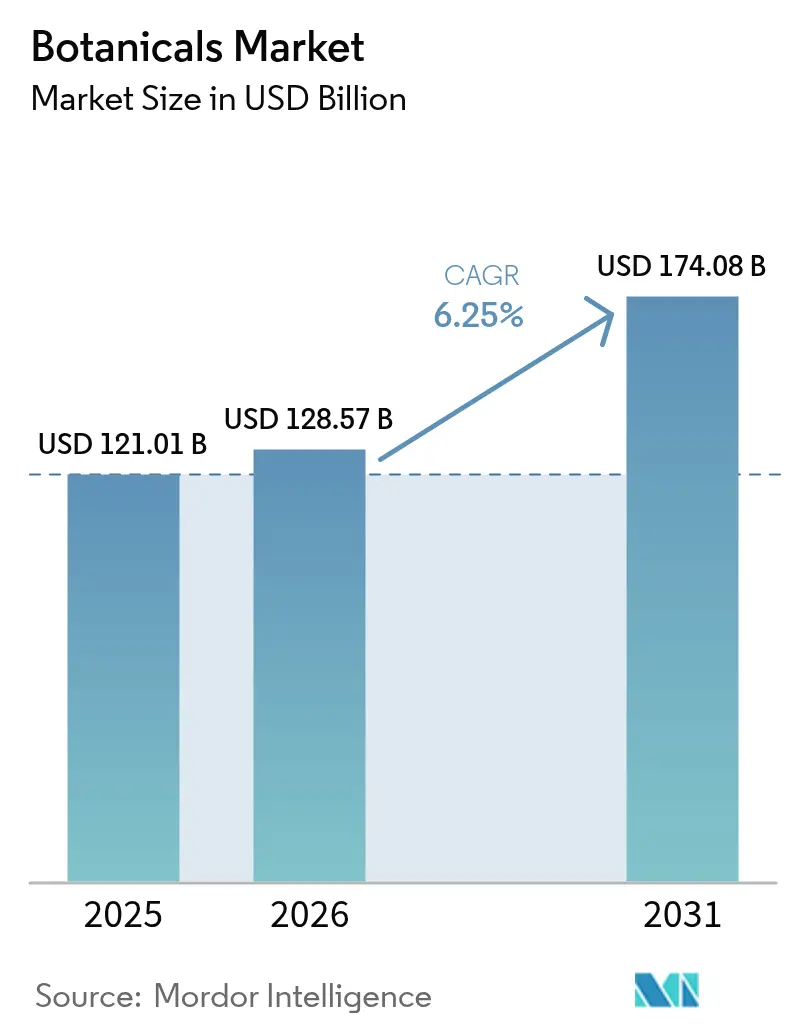
The botanicals market size was valued at USD 121.01 billion in 2025 and estimated to grow from USD 128.57 billion in 2026 to reach USD 174.08 billion by 2031, at a CAGR of 6.25% during the forecast period (2026-2031). This expansion is fueled by increasing demand for natural and traceable ingredients across food, nutraceuticals, pharmaceuticals, and personal care industries. Botanical supplements, particularly those supporting immunity, gut health, memory, and heart wellness, are gaining significant traction. The food and beverage sector is progressively incorporating botanical extracts for their flavor, nutritional, and functional properties. Interest in traditional medicine and ethnobotanical practices is driving broader adoption in pharmaceuticals and wellness applications. In the Asia-Pacific region, regulatory harmonization between traditional medicine systems and modern quality standards is strengthening long-term growth opportunities. Companies utilizing proprietary extraction technologies and blockchain-enabled supply chains are achieving premium pricing. However, the emergence of synthetic-biology substitutes is heightening competition at the commodity level. Climate-related supply disruptions are increasing the appeal of vertically integrated sourcing models that ensure quality and supply continuity. Furthermore, consumers' willingness to pay substantial premiums for verified clean-label products highlights the strategic importance of investing in authenticated botanicals.
Key Report Takeaways
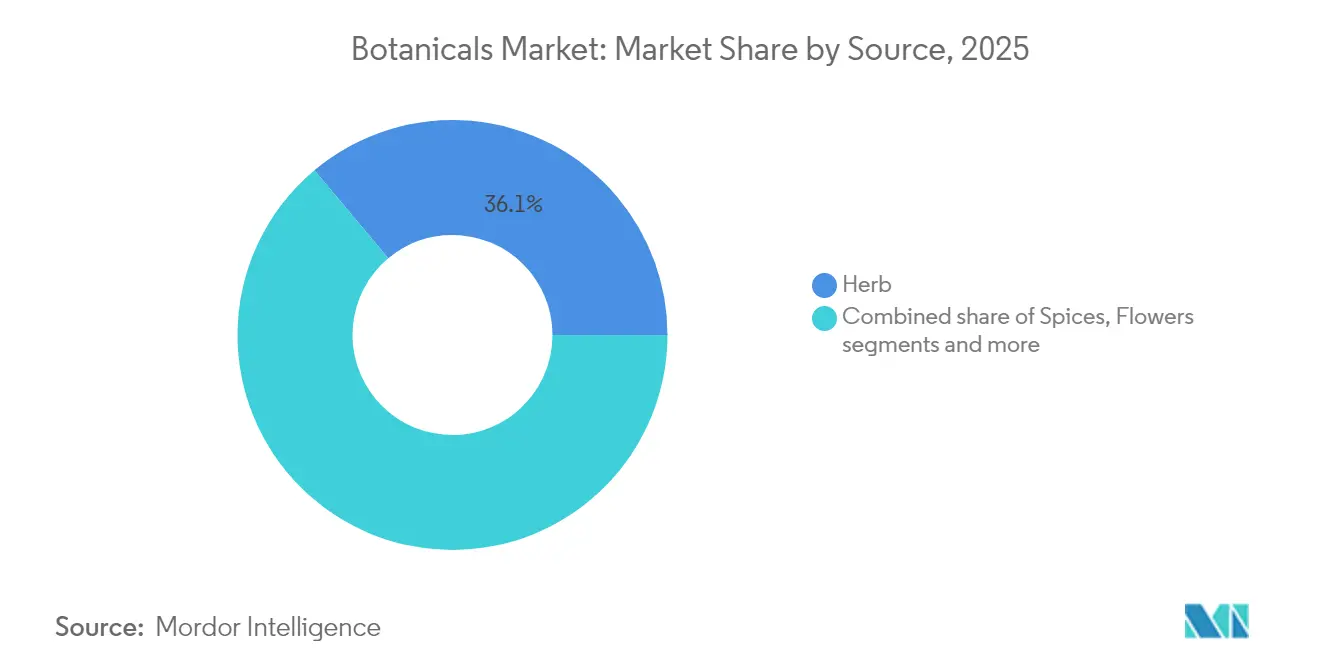
- By source, herbs led with 36.10% of botanicals market share in 2025, while flowers recorded the highest forecast CAGR at 6.62% through 2031.
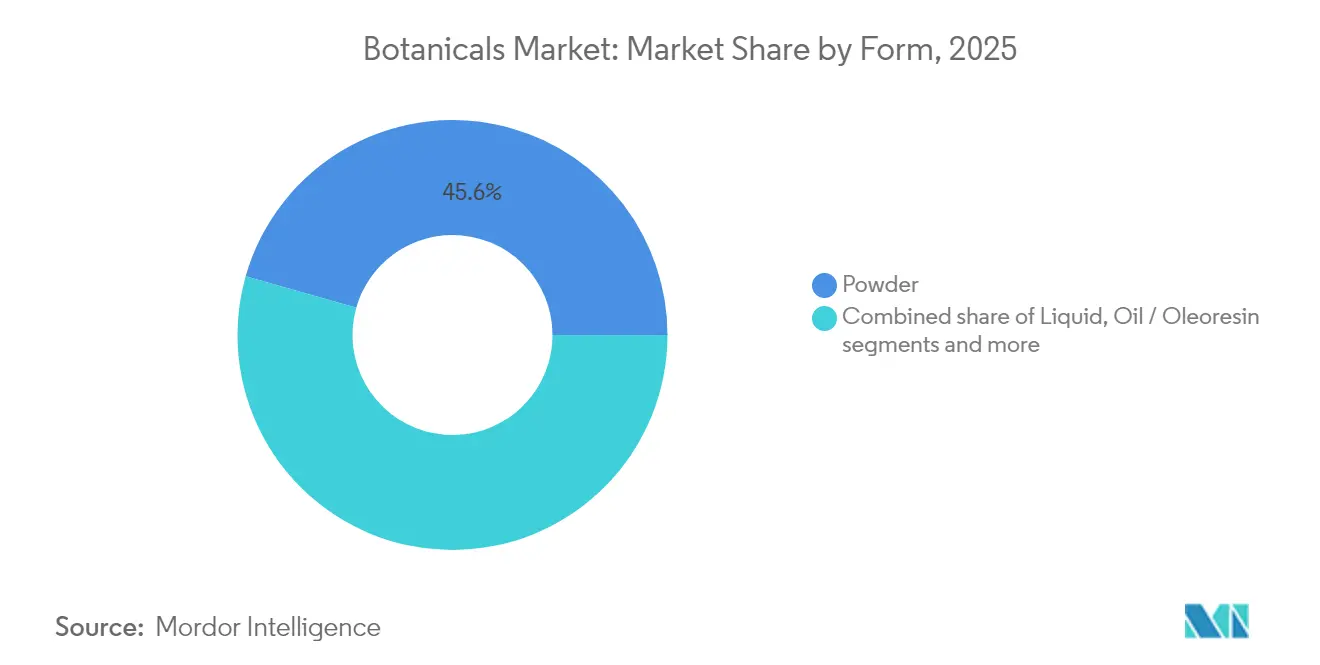
- By form, powder commanded 45.60% of the botanicals market size in 2025; liquid formulations are forecast to expand at a 6.95% CAGR between 2026-2031.
- By application, food and beverage accounted for 35.80% of the botanicals market size in 2025 and dietary supplements are advancing at a 7.05% CAGR through 2031.
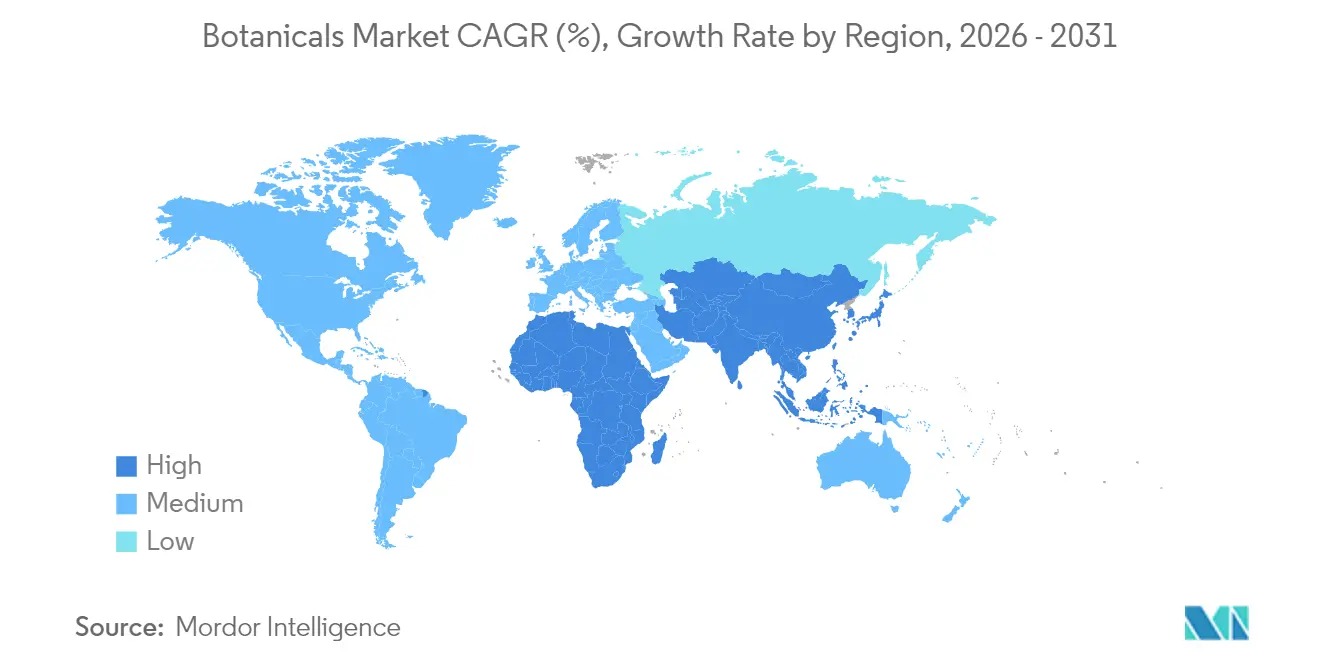
- By geography, North America held 33.90% of botanicals market share in 2025, whereas Asia-Pacific is projected to register the fastest 7.35% CAGR to 2031.
Note: Market size and forecast figures in this report are generated using Mordor Intelligence’s proprietary estimation framework, updated with the latest available data and insights as of 2026.
Market Trends and Insights
Drivers Impact Analysis of Botanicals Market*
| Driver | (~) % Impact on CAGR Forecast | Geographic Relevance | Impact Timeline |
|---|---|---|---|
| Clean-label and natural ingredient preference | +1.2% | North America and Europe | Medium term (2-4 years) |
| Functional food and beverage launch expansion | +1.0% | Asia-Pacific North America | Short term (≤2 years) |
| Regulatory support for traditional medicine | +0.9% | Asia-Pacific , Europe, Latin America | Long term (≥4 years) |
| Extraction and formulation technology advances | +0.8% | Developed markets | Medium term (2-4 years) |
| Blockchain-enabled traceability | +0.5% | North America and Europe | Medium term (2-4 years) |
| Up-cycling of plant by-products | +0.4% | Regions with agricultural waste | Long term (≥4 years) |
| Source: Mordor Intelligence | |||


Growing consumer preference for clean-label and natural ingredients
The clean-label movement goes beyond traditional organic certifications, prioritizing ingredient transparency while highlighting processing methods and supply chain origins. Consumers are increasingly choosing products with recognizable botanical ingredients instead of synthetic ones, driving reformulations in the food and personal care sectors. According to the International Food Information Council, 40% of U.S. consumers in 2023 regularly selected food or beverages based on natural labels[1]Source: International Food Information Council, "Food and Health Survey 2023", www.ific.org. This shift significantly impacts processed food manufacturers, who are replacing artificial flavors and preservatives with botanical extracts to maintain consumer trust. The trend not only increases demand for authenticated botanical ingredients but also enables clean-label products to command a 15-20% price premium over conventional alternatives. Regulatory frameworks, such as the EU's Farm to Fork Strategy and the FDA's voluntary clean-label guidelines, support this consumer-driven transformation, solidifying botanical ingredients as preferred substitutes for synthetic additives.
Rapid expansion of functional food and beverage launches
Botanicals such as turmeric, ginger, matcha, adaptogens, and functional mushrooms are increasingly popular in functional foods and beverages due to their health benefits, including anti-inflammatory, antioxidant, immune support, and cognitive enhancement properties. This rising demand is driving sales and fostering innovation among botanical ingredient suppliers. The trend highlights the integration of traditional wellness practices with modern nutritional science, creating new market opportunities. Beverage categories, particularly botanical-infused waters, teas, and functional drinks, are experiencing the strongest growth. These products appeal to younger consumers seeking natural energy solutions and stress management. Liquid botanical formulations are gaining popularity because of their superior bioavailability and flexibility compared to traditional powders. Additionally, the production of functional foods continues to grow, with South Korea's health functional food market valued at KRW 2.76 trillion in 2024, according to the Ministry of Food and Drug Safety[2]Source: Ministry of Food and Drug Safety (South Korea), "2024 Food and food additives statistics", www.mfds.go.kr. Moreover, clearer regulations on structure-function claims for botanical ingredients enable manufacturers to communicate health benefits more effectively, accelerating product development and market acceptance.
Regulatory support for traditional and herbal medicine integration
Government policies are increasingly recognizing traditional medicine systems as complementary to conventional healthcare, opening legitimate market opportunities for botanical ingredients with historical therapeutic applications. The WHO's Traditional Medicine Strategy 2024 establishes frameworks to integrate traditional practices into national health systems, particularly benefiting Asian markets where botanical medicine is culturally accepted. This regulatory shift allows pharmaceutical companies to develop botanical-based products with therapeutic claims, transitioning beyond dietary supplements into regulated drug markets. Countries such as India, China, and Germany are at the forefront of this integration, implementing specific regulatory pathways for traditional medicine products and setting examples for global harmonization. This trend especially favors botanicals with well-documented traditional use and growing clinical evidence, positioning them for pharmaceutical development rather than commodity ingredient applications.
Advances in extraction and formulation technologies
Supercritical CO2 extraction and ultrasound-assisted processing technologies produce cleaner botanical extracts while maintaining bioactive compounds that traditional solvent methods often degrade. A rise in patent filings for these extraction technologies highlights significant industry investment in processing innovation. These advancements resolve quality consistency issues, facilitating the increased use of botanical ingredients in regulated sectors such as pharmaceuticals and clinical nutrition. Additionally, these methods repurpose previously discarded plant materials, transforming agricultural waste into valuable botanical ingredients. Companies with proprietary extraction technologies gain a competitive edge by delivering superior ingredient quality and optimizing supply chains. As regulatory bodies increasingly approve these advanced methods, the market acceptance of technologically enhanced botanical ingredients continues to strengthen.
Restraints Impact Analysis of Botanicals Market*
| Restraint | (~) % Impact on CAGR Forecast | Geographic Relevance | Impact Timeline |
|---|---|---|---|
| Raw-material supply volatility and seasonality | -0.7% | Climate-vulnerable regions | Short term (≤2 years) |
| Quality variability and lack of standardization | -0.6% | Developing-market suppliers | Medium term (2-4 years) |
| Complex, inconsistent approval pathways | -0.4% | Global | Long term (≥4 years) |
| Synthetic-biology alternatives | -0.3% | Developed markets | Long term (≥4 years) |
| Source: Mordor Intelligence | |||
Raw-material supply volatility and seasonality
Botanical supply chains are increasingly affected by climate change, facing issues such as greater weather unpredictability, changes in growing seasons, and shifts in traditional cultivation areas. In 2024, disruptions were particularly evident during the growing season, with turmeric yields in India declining due to irregular monsoon patterns. According to India's Ministry of Agriculture and Farmers Welfare, turmeric production dropped from 1.17 million metric tons in 2023 to 1.06 million metric tons in 2024[3]Source: Ministry of Agriculture and Farmers Welfare, "Major spice/state wise area and production of spices" www.agriwelfare.gov.in. These supply disruptions have caused price volatility, complicating long-term contract negotiations between botanical suppliers and manufacturers. Seasonal constraints are driving manufacturers to maintain larger inventory reserves, which increases working capital needs and storage costs. The issue is especially significant for wild-harvested botanicals, where sustainable harvesting practices limit supply scalability. To address these challenges, companies are investing in controlled environment agriculture and diversifying supply chains, though these measures require substantial capital and time to become effective.
Quality variability and lack of global standardization
Manufacturers encounter significant challenges in maintaining consistency due to variations in the quality of botanical ingredients. These differences arise from factors such as cultivation practices, harvest timing, processing methods, and storage conditions. Regional disparities in quality standards further complicate compliance for global suppliers, with frameworks like the European Pharmacopoeia, USP, and various national standards adding to the complexity. Smaller botanical suppliers in developing regions, often constrained by limited resources, struggle to meet multiple quality standards simultaneously. Additionally, the absence of unified testing protocols for bioactive compounds fragments the market. While premium buyers require extensive analytical verification, commodity markets accept lower quality thresholds. Although organizations such as ICH and WHO are working towards global harmonization, progress remains slow. This persistent quality variability continues to restrict the adoption of botanical ingredients, particularly in applications subject to strict regulatory requirements.
*Our forecasts treat driver/restraint impacts as directional, not additive. The impact forecasts reflect baseline growth, mix effects, and variable interactions.
Botanicals Market Segment Analysis
By Source:
Herbs Dominate While Flowers Accelerate InnovationHerbs hold the largest market share at 36.10% in 2025, supported by a robust cultivation infrastructure and extensive traditional usage documentation that simplifies regulatory approvals. Spices, benefiting from their dual applications in food flavoring and functional ingredients, rank as the second-largest segment. Although the flowers segment currently accounts for a smaller share, it is projected to grow at the fastest rate, with a 6.62% CAGR through 2031. This growth is driven by increasing research into anthocyanins and flavonoids, which are gaining attention for their cognitive health and anti-aging benefits. Roots and rhizomes exhibit consistent growth, driven by the popularity of adaptogenic herbs. Algae and seaweed are emerging as promising opportunities in the marine-derived bioactives space.
Advanced extraction technologies are particularly advantageous for flower-based botanicals, as they ensure gentle processing to preserve the bioactivity of delicate compounds. In 2024, the FDA's expanded GRAS (Generally Recognized As Safe) status for flower extracts opened new application opportunities, accelerating commercial development. Other sources, such as bark, leaves, and seeds, maintain stable market positions through their specialized uses in pharmaceutical and cosmetic formulations. Sustainability initiatives within the supply chain increasingly favor cultivated sources over wild-harvested materials. This trend supports the growth of herbs and flowers but challenges traditional segments like roots and bark, which have historically relied on forest resources.


By Form:
Liquid Formulations Gain Bioavailability AdvantagePowder formulations command 45.60% market share in 2025, reflecting established manufacturing processes and cost advantages in storage and transportation. Powders offer easy mixing into beverages and recipes, appealing to busy consumers seeking customizable nutrition. However, liquid formulations emerge as the fastest-growing segment at 6.95% CAGR through 2031, driven by superior bioavailability profiles and formulation flexibility in beverage and nutraceutical applications. Oil and oleoresin forms maintain specialized positions in flavor and fragrance applications, while resin and gum segments serve niche pharmaceutical and industrial uses. The liquid segment's growth acceleration reflects technological advances in liquid extraction and stabilization methods that preserve bioactive compounds while extending shelf life.
Beverage industry adoption drives liquid botanical demand, with functional drink manufacturers preferring liquid extracts for consistent dosing and flavor integration. Regulatory frameworks increasingly recognize liquid formulations as preferred delivery systems for bioactive compounds, supporting market acceptance in clinical nutrition applications. Powder formulations retain advantages in dietary supplement manufacturing, where standardized dosing and cost efficiency remain paramount. The form segmentation reflects broader industry trends toward personalized nutrition and convenient delivery systems, positioning liquid formulations for continued growth despite higher production costs compared to traditional powder processing.
By Application:
Dietary Supplements Surge on Regulatory ClarityFood and beverage applications hold the largest market share at 35.80% in 2025, driven by established regulatory pathways and consumer acceptance of botanical ingredients in familiar formats. Dietary supplements are the fastest-growing segment, expected to grow at a 7.05% CAGR through 2031. This growth is supported by clearer regulatory guidelines on structure-function claims and increasing consumer interest in preventive health. Cosmetics and personal care exhibit steady growth, while pharmaceuticals, despite facing complex regulatory challenges, show potential for premium pricing. Additionally, the pet humanization trend is driving growth in animal feed and pet nutrition, as demand rises for natural ingredients in companion animal products.
The growth in dietary supplements stems from several converging market factors. Aging populations are increasingly seeking natural health solutions, and regulatory frameworks are enabling clearer health communications. In the food and beverage sector, functional beverages and dairy alternatives are experiencing the strongest growth, while traditional categories like bakery and confectionery maintain stable demand. Although pharmaceutical applications account for a smaller volume, they achieve premium pricing for botanicals with clinical validation and regulatory approval. This segmentation emphasizes the versatility of botanical ingredients across various markets, creating diverse revenue streams and reducing dependence on any single application.
Geography Analysis
North America Botanicals Market
North America commands a dominant 33.90% market share in 2025, owing to its well-established regulatory frameworks. These frameworks facilitate the commercialization of botanical ingredients in food, supplements, and pharmaceuticals. The FDA's broadened GRAS recognition and its guidance on dietary supplements pave the way for predictable approvals, spurring investments in botanical innovations. Moreover, as consumers increasingly embrace functional foods and preventive health, authenticated botanical ingredients command premium prices. Established distribution channels further bolster market penetration. Additionally, Canada's Natural Health Products Regulations amplify these opportunities, fostering a cohesive approach to botanical product development and marketing across North America.
APAC Botanicals Market
Asia-Pacific is on a rapid ascent, projected to grow at a 7.35% CAGR through 2031. This surge is largely attributed to government policies that validate traditional medicine systems as credible healthcare options. The WHO's Traditional Medicine Strategy, being rolled out across Asia, bolsters institutional backing for botanical ingredient development. Concurrently, a burgeoning middle class fuels the appetite for premium natural products. China's Belt and Road Initiative, with its emphasis on traditional medicine, bolsters the trade and development of botanical ingredients among its partner nations. Furthermore, India's Ayush Ministry's expansion and Japan's evolving functional food regulations carve out diverse market prospects, ensuring robust growth despite varied national regulatory landscapes.
EMEA and South America Botanicals Market
Europe's steady growth trajectory is anchored in its rigorous quality standards, which elevate the market positioning of botanical ingredients that align with European Pharmacopoeia benchmarks. Initiatives like the EU's Farm to Fork Strategy and the Green Deal champion sustainable sourcing of botanicals, granting an edge to traceable and eco-conscious ingredients. While Brexit has introduced some regulatory disparities between the UK and the EU, the overarching demand for premium botanical ingredients in Europe remains unwavering. Meanwhile, regions like South America, the Middle East, and Africa are emerging as potential hotspots, bolstered by maturing regulatory frameworks and heightened consumer awareness. However, their market evolution is somewhat stunted by infrastructural challenges and regulatory ambiguities in certain areas.

Regulatory Landscape
Regulation of botanicals varies by end use (food, supplements, additives, and drugs) and by region, which leads to multi-track compliance requirements for global suppliers. In the United States, botanical-sourced drug products follow the FDA CDER pathway (IND and NDA) under the same safety and efficacy standards applied to conventional drugs, which differs from dietary supplement frameworks. In March 2026, FDA held a public meeting (March 27, 2026) to discuss the scope of dietary supplement ingredients and interpretation of Section 201(ff)(1)(E) of the FD&C Act, and it reviewed nearly 1,000 public comments submitted by the April 27, 2026 deadline.
In the European Union, botanicals do not have a single centralized authorization route, and Member States play a key role under the General Food Law (Regulation (EC) No 178/2002), while EFSA supports with scientific tools such as the Compendium of Botanicals for hazard identification. In 2026, EU food additive rules were tightened for products intended for vulnerable populations through Regulations (EU) 2026/189 and 2026/196, published in January 2026 and entering into force on February 18, 2026. The updates introduce stricter purity and microbiological criteria for certain additive categories (including gums and starches) and phase in compliance from August 2026 to February 2028. EFSA also opened a consultation (June 8 to August 3, 2026) to modernize and merge botanical safety guidance into a single cross-sectoral framework, which points to more uniform evidence requirements for botanical preparations across EU uses.
Value Chain Analysis
The botanicals value chain typically runs from cultivation or wild collection, through primary processing (drying, milling, and stabilization), extraction and concentration (including solvent, supercritical CO2, and other advanced methods), and then standardization and quality testing. This is followed by formulation and blending, and downstream distribution to food and beverage, dietary supplement, cosmetics, and pharmaceutical manufacturers. Quality documentation and identity verification have become major value-adding steps, as buyers increasingly require batch-level specifications, contaminant controls, and traceability records alongside traditional pricing and availability considerations.
Bottlenecks are most visible upstream and midstream, where climate-driven variability can affect yield and phytochemical profiles, and where contamination and adulteration risks persist. Capacity constraints also matter for ingredients seeing faster demand growth when processing infrastructure lags. Industry practice is shifting toward deeper vertical engagement, including long-term grower relationships, field audits, and geographically diversified sourcing to reduce shocks and improve consistency. Associations and standards bodies influence chain behavior through Good Agricultural and Collection Practices and manufacturing guidance (for example, AHPA GACP and GMP guidance), while trade and policy engagement is increasingly visible as companies and industry groups manage cross-border flows and divergent requirements across jurisdictions.
Competitive Landscape
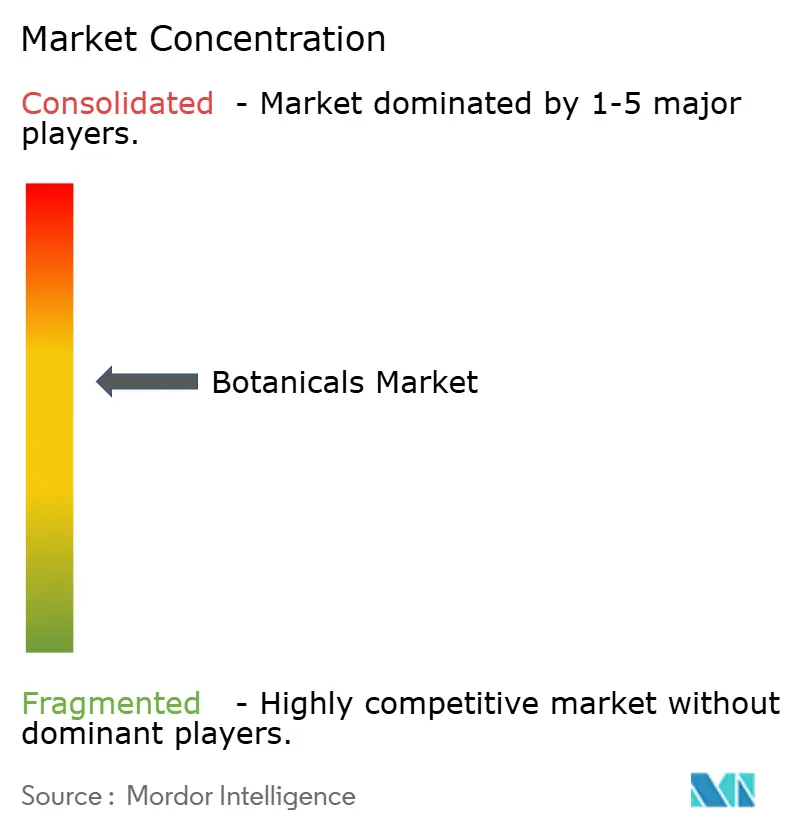
The botanicals market is moderately fragmented, with established multinational corporations competing alongside specialized extractors and emerging biotechnology firms. The market's concentration reflects its dual nature: commodity botanical ingredients face price competition, while premium, authenticated products achieve higher margins through proprietary extraction technologies and traceable supply chains. Major players such as Givaudan SA and DSM-Firmenich SA adopt vertical integration strategies, ensuring quality control from cultivation to final formulation. This approach creates competitive advantages through consistency and regulatory compliance. The competitive landscape focuses on technological innovation rather than traditional price competition, with companies heavily investing in advancements in extraction technology, blockchain traceability systems, and regulatory expertise to differentiate their offerings.
The global botanicals market is led by prominent players like International Flavors and Fragrances Inc., Archer-Daniels-Midland Company, Döhler GmbH, Symrise AG, and Givaudan SA. These companies drive the industry forward through continuous innovation and strategic expansion. Significant investments in research and development aim to create new botanical extracts and natural ingredients, with a particular focus on clean-label and sustainable products. The industry is also experiencing a strong trend of expanding production facilities and innovation centers across various regions to strengthen local presence and meet regional preferences. Strategic trends in the market reveal three distinct approaches: vertical integration by established players to control supply chains, horizontal expansion by ingredient suppliers diversifying across application markets, and technological disruption by biotechnology firms developing synthetic biology alternatives to natural botanicals.
Opportunities exist in authenticated traditional medicine botanicals with emerging clinical validation, marine-derived bioactives from sustainable sources, and circular economy applications that repurpose agricultural waste streams. The increase in patent filings for botanical extraction and authentication technologies highlights significant industry investment in proprietary capabilities. Additionally, expertise in regulatory compliance is becoming a critical differentiator, with companies adept at navigating complex approval pathways across multiple jurisdictions gaining a competitive edge over smaller specialized suppliers.
Botanicals Industry Leaders
-
Döhler GmbH
-
International Flavors and Fragrances Inc.
-
Givaudan SA
-
Symrise AG
-
Archer-Daniels-Midland Company
- *Disclaimer: Major Players sorted in no particular order
Botanicals Market Companies Covered in this Report
- Givaudan SA
- DSM-Firmenich SA
- Archer Daniels Midland Co.
- International Flavors and Fragrances Inc. (IFF)
- Dohler GmbH
- Martin Bauer Group
- Bell Flavors and Fragrances
- Sensient Technologies
- Synergy Flavors
- Prinova Group
- PT. Indesso Aroma
- Berje Inc.
- Blue Sky Botanics
- NutraSorb LLC
- Botanical Ingredients Ltd.
- Euroma Group
- Ingex Botanicals
- Bio-Botanica
- Carrubba Incorporated
- Sapphire Flavors and Fragrances

Market Opportunities and Future Outlook
Opportunities are expanding around regulatory-cleared differentiation and faster time-to-market for specific botanical preparations. In the EU, activity around novel foods and botanical assessment clarity is creating concrete pathways for compliant innovation, including the European Commission update to the Novel Food Catalogue in January 2026 covering several traditional botanical extracts, and the June 2026 authorization of rhamnogalacturonan-I enriched carrot extract as a novel food via Implementing Regulation (EU) 2026/1306. At the same time, EFSA opened a public consultation (June 8 to August 3, 2026) to move toward a modernized, cross-sectoral guidance approach for botanicals, which supports a clearer route for suppliers that can operationalize robust safety dossiers, analytical verification, and standardized specifications.
Supply-side resilience and discovery-led differentiation are also strengthening as opportunity areas. Companies are investing in controlled production and advanced discovery to counter raw-material volatility and improve repeatability of bioactive profiles, including bioreactor and indoor production approaches reported for precision botanicals. There is also evidence of active partnerships for new plant bioactives, such as Evra Ingredients collaboration with Brightseed (March 2026) to use AI-enabled discovery. On capacity and localization, BioVivo Science opened a 100,000-square-foot cGMP manufacturing facility in Jeffersonville, Indiana (May 2025), with minimum annual capacity of 2,000 tons of powdered botanical extracts, supporting North American supply-chain security. The site also provides a platform for contract manufacturing and private-label ingredient programs that require documented GMP controls.
Recent Industry Developments in Botanicals Market
- July 2026: International Flavors and Fragrances Inc. entered an agreement to sell its portfolio of botanical extracts, vitamins, minerals, and food enhancement activities to SuanNutra (Carbyne Equity Partners). The carve-out included activities reported at about USD 170 million in 2025 revenue, reshaping supplier options for buyers that source standardized botanical extracts within broader ingredient programs.
- May 2026: International Flavors and Fragrances Inc. signed an agreement to sell its Food Ingredients business to CVC Capital Partners in a USD 4.3 billion transaction. This deal reallocates assets away from commodity-style ingredient operations and can alter competitive intensity and sourcing relationships across food and beverage formulations that incorporate botanical-derived components.
- July 2024: GNT Group B.V. strengthened its natural colors production by adopting fermentation technology for colors derived from fruits, vegetables, and plants. The move supports scalability and supply consistency for plant-based color systems that are increasingly used alongside other botanical ingredients in clean-label food and beverage applications.


Botanicals Market Report Scope and Research Methodology
Market Definition and Coverage
For this study, the botanicals market covers plant-derived ingredients and extracts used for functional or sensory purposes in end products, across uses such as food, supplements, and personal care. We treat the market as a value pool created by traded and consumed botanical inputs, not finished branded goods.
Scope exclusions: We exclude synthetic or fully nature-identical substitutes when they are not sourced from botanical feedstock, and we do not count purely non-botanical actives.
Segments Covered in This Report
-
By Source
- Herbs
- Spices
- Flowers
- Roots and Rhizomes
- Algae and Seaweed
- Other Sources
-
By Form
- Powder
- Liquid
- Oil / Oleoresin
- Resin / Gum
-
By Application
-
Food and Beverage
- Bakery and Confectionery
- Sauces, Dressings and Condiments
- Functional Beverages
- Dairy and Plant-based Alternates
- Other Foods and Beverages
- Dietary Supplements
- Cosmetics and Personal Care
- Animal Feed and Pet Nutrition
- Pharmaceuticals
- Other Applications
-
Food and Beverage
-
By Geography
-
North America
- United States
- Canada
- Mexico
- Rest of North America
-
South America
- Brazil
- Argentina
- Colombia
- Chile
- Rest of South America
-
Europe
- United Kingdom
- Germany
- France
- Italy
- Spain
- Russia
- Sweden
- Belgium
- Poland
- Netherlands
- Rest of Europe
-
Asia-Pacific
- China
- Japan
- India
- Thailand
- Singapore
- Indonesia
- South Korea
- Australia
- New Zealand
- Rest of Asia-Pacific
-
Middle East and Africa
- United Arab Emirates
- South Africa
- Saudi Arabia
- Nigeria
- Egypt
- Morocco
- Turkey
- Rest of Middle East and Africa
-
North America
Data Sources, Market Sizing, and Validation
Desk Research
Desk work starts by mapping the supply chain from cultivation and primary processing through extracts and oils, and then linking it to the major consuming industries. We lean on public, repeatable reference points such as USDA crop and trade statistics, FAOSTAT production series, UN Comtrade import and export flows, and customs or tariff schedules that help keep product boundaries consistent.
To make the numbers usable for sizing, we also review sources such as FDA and EFSA public guidance for ingredient use constraints, Codex and other standards for botanical ingredient classifications, and peer-reviewed journals that clarify typical extraction yields and formulation use rates. Company filings, investor presentations, and reputable press were used to understand capacity additions, sourcing footprints, and pricing direction, supported by paid subscriptions for company financials, patent screening, and shipment-level import and export checks where available. These examples are not exhaustive, and many other public references were reviewed to collect data, validate assumptions, and clarify open questions.
Primary Interviews and Surveys
Primary conversations were used to pressure-test what desk sources cannot fully explain, such as real-world price corridors for common botanical forms, typical contract structures, and substitution patterns between plant sources and formats. We spoke with a mix of ingredient suppliers, processors, importers, and downstream users in food, dietary supplements, and personal care, and then used follow-up checks to settle differences in yield assumptions and application-level inclusion.
Distribution of primary research fieldwork respondents
| Company type | Respondent position | Region |
|---|---|---|
| Top tier: 26% | CXOs: 15% | APAC: 41% |
| Mid tier: 59% | Functional/Unit leaders: 33% | EMEA: 37% |
| Smaller Players: 15% | Managers: 52% | Americas: 22% |
Market-Sizing & Forecasting
Our core sizing logic is built from the demand side, where production and trade data reconstruct the available pool of botanical inputs, which is then filtered through the share that goes into end-use industries. Once that structure is in place, we add selective top-down and bottom-up checks, including rolling up a sample of supplier revenues in botanical ingredients and validating implied volumes using sampled price per kilogram (or liter) by form.
Key inputs used in the model include import and export momentum for botanical categories, cultivation and harvest trends for key plant sources, extraction yield ranges by form (powder, liquid, oils and oleoresins), typical inclusion rates in major applications, and observed pricing movement tied to crop seasonality and supply disruptions. When data gaps appear, we interpolate using nearest comparable plant sources or neighboring trade codes, then re-check implied consumption with interview feedback. Forecasts use scenario analysis supported by a short set of drivers, including end-market growth, expected price progression by form, and assumed normalization of supply constraints, so the final curve stays explainable and easy to update.
Data Validation & Update Cycle
Validation happens in layers, starting with basic checks on units, currency timing, and double counting between raw botanicals and processed extracts. We then compare outputs against independent signals such as trade intensity, crop availability direction, and visible pricing shifts, and any large variances are sent back for review before sign-off.
Analyst reviews are done in steps, where assumptions are challenged, the math is re-run, and outliers are either corrected or clearly explained. The work is refreshed annually, and interim updates are triggered when material events occur, such as major regulatory changes, sharp crop shocks, or meaningful capacity additions. Right before delivery, a final pass is completed so clients receive the most up-to-date view available.
Mordor Intelligence's Botanicals Market Sizing Compared With Other Published Estimates
Published botanicals market values often differ because the scope line is drawn differently, and because pricing and conversion logic varies by source. We also see differences when one estimate relies more on finished retail sales, and another stays closer to ingredient value, which can change totals quickly.
Trade-flow direction, crop availability signals, and application-level inclusion-rate checks are the evidence used to anchor Mordor Intelligence to an ingredient-demand pool that matches botanicals used in food and beverages, supplements, cosmetics and personal care, and animal feed. The biggest gaps usually come from mixing ingredients with finished products, using different base years, and applying a single average price without separating powders, liquids, and oils, followed by different currency timing and refresh cadence.
Benchmark comparison
| Source | Market Size | Gaps in Research Methodology |
|---|---|---|
| Mordor Intelligence | USD 121.01 B (2025) | |
| Global Consultancy A | USD 86.64 B (2025) | This figure sits lower mainly because the scope appears to emphasize a narrower botanical definition and a shorter forecast frame, and it also blends product and channel groupings that can leave out parts of the ingredient flow into cosmetics and animal nutrition. |
| Industry Association B | USD 13.23 B (2024) | This number reflects US retail sales of herbal dietary supplements only, and it excludes other botanicals applications such as food and beverage, cosmetics, and pet nutrition, so it is not comparable to a global ingredient market. |
Looking across the table, the spread is explained less by math and more by what is being counted, where it is being counted, and which price logic is applied. By keeping the value tied to ingredient movement indicators and by separating major botanical forms before applying prices, the estimate stays traceable to clear inputs and can be refreshed in a consistent way.


Key Questions Answered in the Report
How large will global demand for botanicals be by 2031?
Value is forecast to reach USD 174.08 billion, expanding at a 6.25% CAGR from 2026.
Which region is set to grow fastest in botanicals through 2031?
Asia-Pacific is projected to post a 7.35% CAGR, underpinned by traditional medicine integration.
What source category shows the highest future growth?
Flowers lead at a projected 6.62% CAGR due to rising use of anthocyanin-rich extracts in cognitive-health and beauty products.
Why are liquid botanical formats gaining popularity?
They deliver superior bioavailability, easy beverage integration, and steady flavor profiles, driving a 6.95% CAGR.
Page last updated on:


 Your data is secure and never sold or shared.


