Market Overview
| Study Period | 2021 - 2031 |
|---|---|
| Forecast Data Period | 2026 - 2031 |
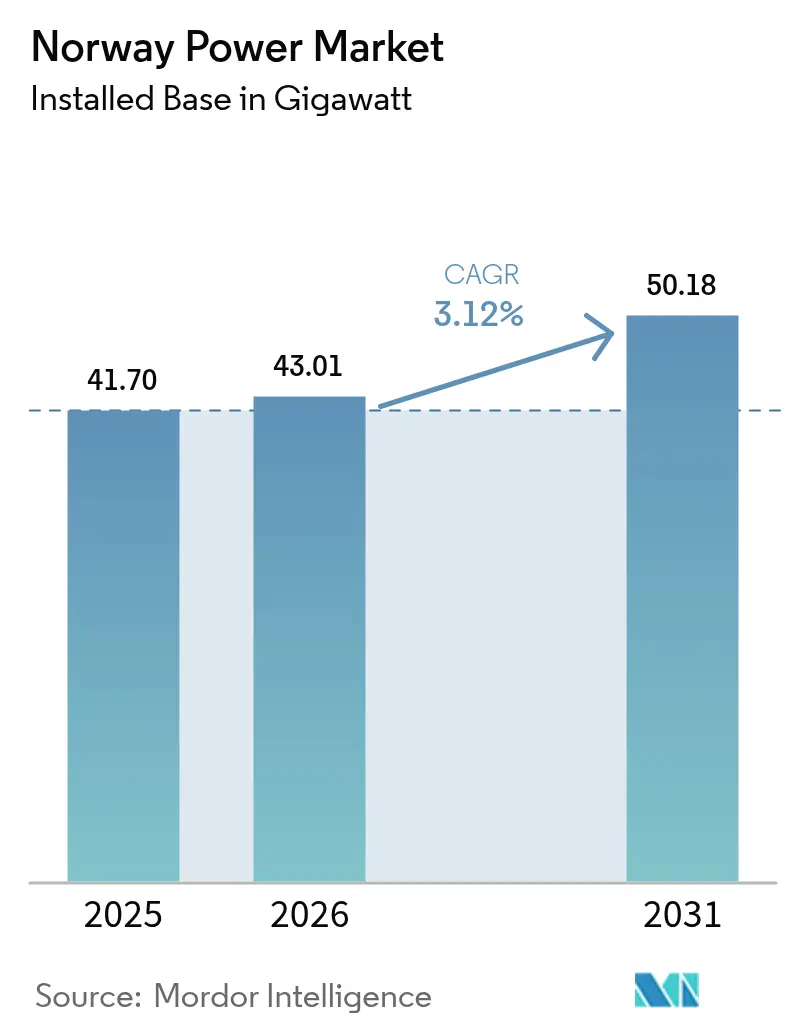
| Base Year Market Size (2025) | 41.70 gigawatt |
| Market Volume (2026) | 43.01 gigawatt |
| Market Volume (2031) | 50.18 gigawatt |
| Growth Rate (2026 - 2031) | 3.12% CAGR |
| Market Concentration | Medium |
Major Players *Disclaimer: Major Players sorted in no particular order Image © Mordor Intelligence. Reuse requires attribution under CC BY 4.0. | |
Norway Power Market Analysis by Mordor Intelligence
Norway Power Market size in 2026 is estimated at 43.01 gigawatt, growing from 2025 value of 41.70 gigawatt with 2031 projections showing 50.18 gigawatt, growing at 3.12% CAGR over 2026-2031.
Renewables already covered 98.8% of generation in 2024, reflecting a system in which incremental growth depends more on capacity additions than on fuel-switching. Hydro reservoirs continue to serve as the reliability core, while 1.5 GW of new offshore wind from the Sørlige Nordsjø II award and later auctions will extend Norway’s export headroom via the North Sea Link and NordLink HVDC cables. Electrification of oil platforms, rapid adoption of electric vehicles, and hyperscale data-center buildouts are turning low-carbon electricity into a strategic production input, lifting industrial and commercial demand at a 6.8% annual pace. Statnett’s NOK 40 billion (USD 3.8 billion) grid-reinforcement plan and AMS-enabled demand response moderate peak-hour stress but do not fully eliminate congestion risks when hydrology tightens. Overall, the Norway power market now competes less on fuel cost and more on flexibility, cross-border arbitrage, and behind-the-meter innovation.[1]Statkraft, “Annual Report 2025,” statkraft.com
Key Report Takeaways
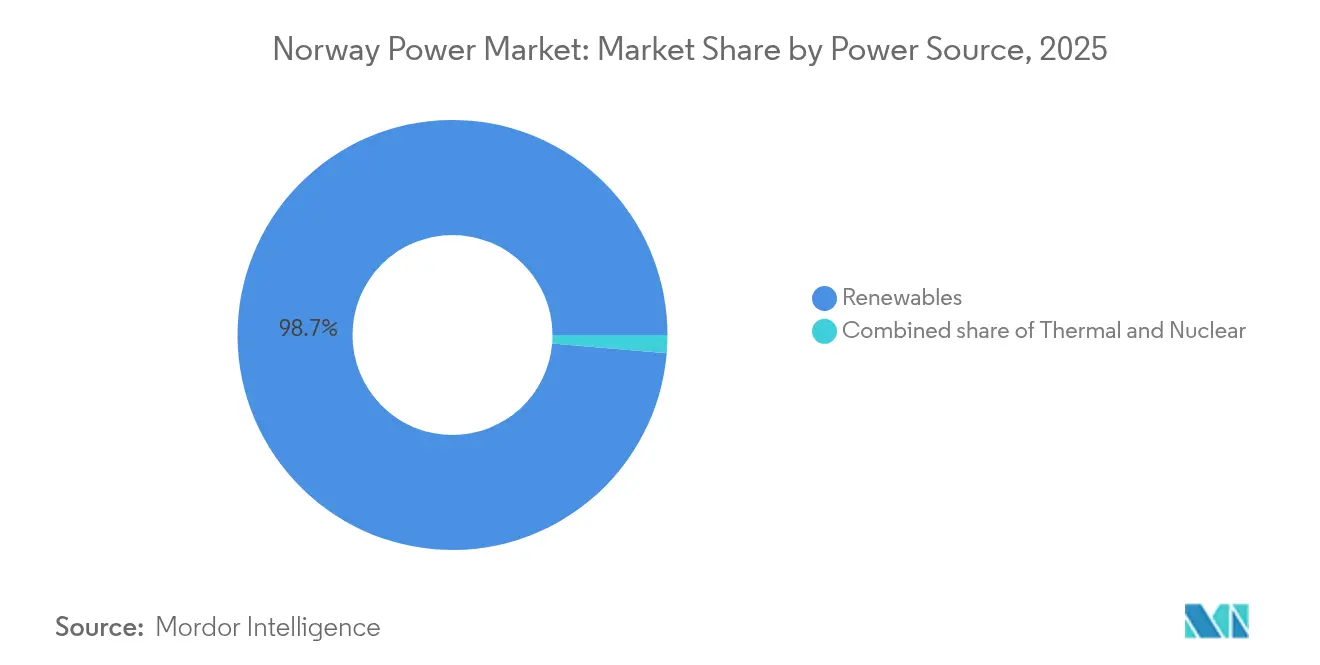
- By power source, renewables retained 98.65% of the Norway power market share in 2025, and the same is projected to expand at a 3.42% CAGR through 2031.
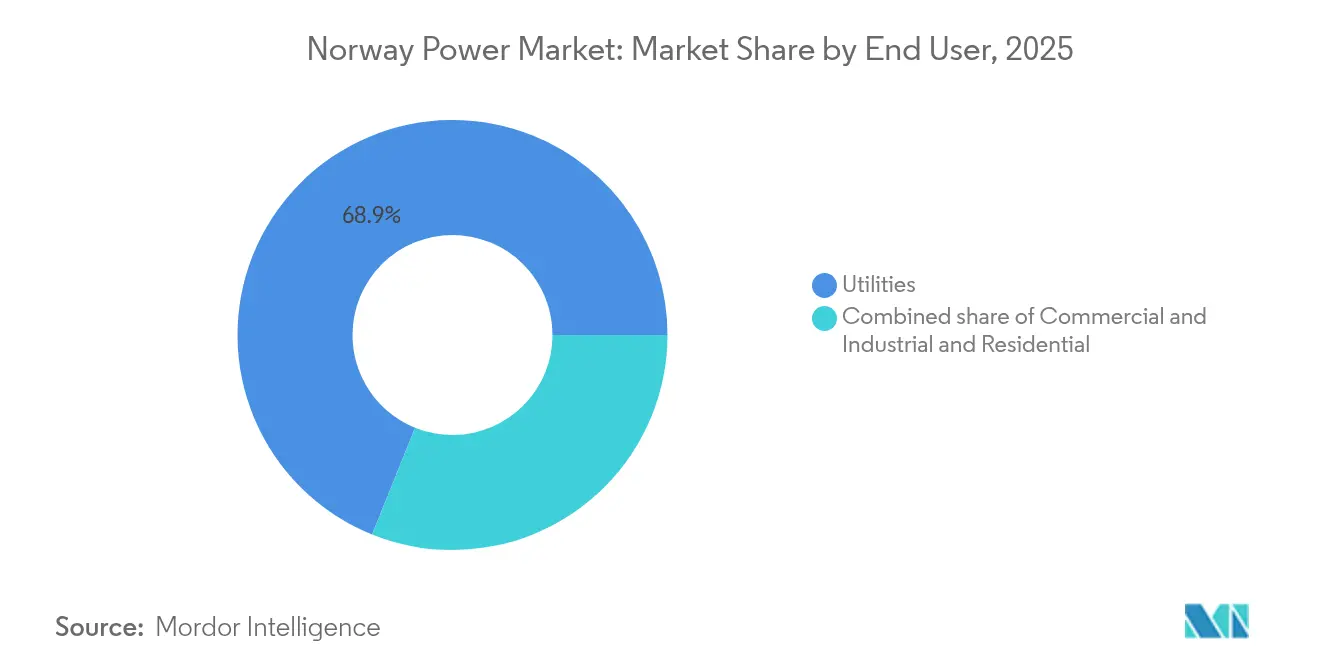
- By end user, utilities accounted for 68.90% of the Norway power market size in 2025, while commercial and industrial buyers are forecast to grow at a 6.52% CAGR to 2031, reflecting aggressive electrification of data centers, hydrogen plants, and platform loads.
Note: Market size and forecast figures in this report are generated using Mordor Intelligence’s proprietary estimation framework, updated with the latest available data and insights as of 2026.
Norway Power Market Trends and Insights
Drivers Impact Analysis*
| Driver | (~) % Impact on CAGR Forecast | Geographic Relevance | Impact Timeline |
|---|---|---|---|
| 2030 climate & renewable-energy targets | +0.7% | National, offshore wind clusters in North Sea | Long term (≥ 4 years) |
| Offshore-wind licensing on Norwegian Continental Shelf | +0.6% | Sørlige Nordsjø II, Utsira Nord, coastal shipyards | Medium term (2-4 years) |
| Electrification of oil & gas platforms and transport | +0.5% | North Sea platforms, urban EV corridors | Medium term (2-4 years) |
| Advanced metering and demand response roll-out | +0.3% | National distribution grids | Short term (≤ 2 years) |
| Growth of energy-intensive green data centers | +0.4% | Oslo–Stavanger corridor | Medium term (2-4 years) |
| New cross-border HVDC interconnectors | +0.5% | Southern bidding zones linked to UK and Germany | Long term (≥ 4 years) |
| Source: Mordor Intelligence | |||
2030 Climate & Renewable-Energy Targets
Norway’s pledge to cut economy-wide emissions 55% below 1990 levels by 2030 obliges utilities and heavy industry to integrate additional zero-carbon supply even though the existing fleet is already clean.[2]Norwegian Ministry of Energy, “Energy White Paper 2025,” regjeringen.no Budget allocations of NOK 3.5 billion (USD 330 million) for grid upgrades in 2024 accelerate sub-sea cable reinforcement, especially where hydro, offshore wind, and industrial loads converge. Stated ambitions for 30 GW of offshore wind by 2040 anchor long-cycle investment planning, giving turbine suppliers and shipyards multi-gigawatt order visibility. The EU taxonomy and Energy Performance of Buildings Directive add commercial pressure, making compliance with climate rules a revenue qualifier for export-oriented firms. Together, these measures raise the baseline growth of the Norway power market by pulling electrification into hard-to-abate sectors and boosting demand for balancing services.
Offshore-Wind Licensing on Norwegian Continental Shelf
The November 2024 Sørlige Nordsjø II auction awarded 1.5 GW at NOK 1.15 per kWh (USD 0.11 per kWh), proving that bottom-fixed arrays can clear the market without subsidies when cross-border trades underpin revenues via the North Sea Link. Investor appetite has pivoted toward shallow-water sites that offer near-term returns, while floating projects at Utsira Nord await extended environmental due diligence. Equinor’s 88 MW Hywind Tampen demonstrates offshore synergies with oil platforms, but further scale-up needs a predictable licensing cadence. The Norwegian Water Resources and Energy Directorate is drafting a consolidated impact-assessment framework to shorten the permitting cycle to 24 months, aiming to sustain momentum as the Norway power market diversifies beyond hydro.
Electrification of Oil & Gas Platforms and Transport
Shore-power links now feed 88 MW to Johan Sverdrup, eliminating 200,000 t of CO₂ a year that gas turbines emitted.[3]Equinor, “Hywind Tampen Fact Sheet,” equinor.com Similar retrofits planned for Troll and Oseberg will draw an additional 250 MW by 2028, creating a continuous baseload on coastal grids. Onshore, battery-electric vehicle penetration surpassed 90% of new car sales in 2024, and fjord ferry operators are switching to all-electric vessels to meet zero-emission rules. These overlapping loads reshape daily demand curves, with evening EV charging and midday ferry departures amplifying peak risk. Statnett’s NOK 40 billion (USD 3.8 billion) transmission blueprint targets 1.5 GW of new south-north transfer capacity, but substation congestions will persist until at least 2027. The electrification push, therefore, raises both volume and volatility in the Norway power market, rewarding flexible assets and dynamic pricing.
Advanced Metering & Demand Response Roll-Out
Norway finished installing 3.7 million AMS units by early 2024, activating hourly settlement for nearly every household. Time-of-use rates already shave 40% off-peak discounts, and pilot programs in Oslo and Bergen delivered a 12% cut in evening peaks without batteries. From 2026, locational tariffs will embed marginal congestion costs, nudging prosumers to install rooftop solar and shifting industrial batch processes to low-price windows. Rich meter data allows distribution operators to postpone physical upgrades by relying on digital load shifting, a model expected to save NOK 1.2 billion (USD 113 million) in Oslo alone. Consequently, the Norway power market is developing a two-layer architecture in which granular data and price signals complement hardware reinforcements.
Restraints Impact Analysis*
| Restraint | (~) % Impact on CAGR Forecast | Geographic Relevance | Impact Timeline |
|---|---|---|---|
| Grid-capacity bottlenecks and lengthy permitting | -0.4% | Oslo–Stavanger demand corridor | Medium term (2-4 years) |
| Local opposition to onshore wind installations | -0.2% | Trøndelag and Sami territories | Long term (≥ 4 years) |
| Hydrological variability affecting hydro reliability | -0.3% | National reservoirs, acute in south | Short term (≤ 2 years) |
| Wholesale-price cannibalization for new renewables | -0.2% | Southern bidding areas, interconnector nodes | Medium term (2-4 years) |
| Source: Mordor Intelligence | |||
Grid-Capacity Bottlenecks and Lengthy Permitting
Price spreads of NOK 0.80 per kWh between Norway’s northern and southern bidding zones in January 2024 underlined how transmission lags dampen the full value of abundant hydro. Statnett lists 15 critical corridors requiring upgrades, but environmental reviews and municipal appeals extend overhead-line approvals to nearly a decade. The Sima–Samnanger 420 kV rebuild, essential for landing Sørlige Nordsjø II output, slipped three years after landowners contested the routing. Until these lines materialize, large loads such as data centers must queue for connections or settle in less congested zones, slowing industrial electrification and trimming the Norway power market growth rate.
Local Opposition to Onshore Wind Installations
Indigenous Sami groups and rural municipalities halted several wind-farm applications in 2024, citing grazing-route disruption and visual impact.[4]Supreme Court of Norway, “Fosen Case Judgment 2024,” supremecourt.no The 1.06 GW Fosen complex was forced to relocate turbines, delaying full output and diluting investor trust. Municipal veto rights effectively shift permitting power to local councils, causing developers to divert capital toward offshore projects that avoid land-use disputes but command higher unit costs. If licensing reforms do not streamline community consultations, onshore build-outs could undershoot 2030 targets by up to 3 GW, limiting the diversity of renewable inflows into the Norway power market.
*Our forecasts treat driver/restraint impacts as directional, not additive. The impact forecasts reflect baseline growth, mix effects, and variable interactions.
Segment Analysis
By Power Source: Hydro Anchors, Offshore Wind Scales
Hydropower represented 87.9% of capacity and 98.65% of generation in 2025, anchoring reliability and granting Norway the lowest grid-emissions intensity in Europe. The segment’s 3.42% forecast CAGR shows incremental gains from life-extension projects, turbine upgrades, and potential reservoir height increases rather than greenfield dams. Offshore wind is set to add 3–4 GW by 2030, with the Sørlige Nordsjø II award alone translating into roughly 6 TWh of annual production. The Norway power market size attributed to offshore wind is projected to surpass USD 2.14 billion by 2031, accounting for a rising yet still minority share of total revenues. Solar photovoltaics remain small, but falling module prices and locational tariff incentives could lift residential and commercial roof installations in southern municipalities. Thermal capacity of 1.2 GW gas peakers, district-heating CHP, and waste-to-energy plants offers reserve during extreme cold snaps when hydro inflows dip. Biomass and waste-to-energy units in Oslo and Bergen supply both power and heat, enhancing circular-economy credentials. Overall, the portfolio mix is shifting from single-source dominance to a hydro-wind tandem that balances seasonal and diurnal variance for the Norway power market.
The emerging offshore wind subset holds the highest growth momentum, advancing at roughly 5.74% annually against hydro’s lower baseline. While hydro continues to provide inertia and ancillary services, floating arrays such as Utsira Nord will eventually broaden geographic generation footprints. Operators are exploring hybrid designs that pair floating turbines with battery modules, allowing offshore sites to export firm power blocks when interconnector spreads are most attractive. As a result, the Norway power market share of non-hydro renewables is poised to rise gradually, providing portfolio diversity and export arbitrage flexibility that hydro alone cannot reach.


By End User: Utilities Dominate, Industry Electrifies
Utilities retained 68.90% of the total offtake in 2025, reflecting historical ownership of municipal generation and grid assets. Nevertheless, commercial and industrial consumption is poised to expand at a 6.52% CAGR to 2031, outpacing the 1.42% growth expected for residential loads. The Norway power market size linked directly to data centers, electrolyzers, and battery plants could exceed USD 3.18 billion by decade-end, driven by 10–20-year PPAs that lock in zero-carbon credentials key to export competitiveness. Microsoft’s 500 GWh-per-year deal with Statkraft exemplifies the shift from passive tariff acceptance to strategic commodity sourcing. Aggregators bundle EV charging depots, municipal buildings, and small manufacturers into flexible pools that bid negative load into Nord Pool, monetizing price swings and reducing grid stress. Consequently, the utilities’ dominance will narrow as industrial self-procurement and microgrids expand their slice of the Norway power market.
Industrial electrification also acts as a balancing resource. Electrolyzers ramp up when spot prices turn negative, soaking up surplus wind and hydro and selling hydrogen to ammonia producers or fuel-cell ferry operators. This two-way interaction blurs the line between generation and load, integrating demand-side assets as virtual peakers. In parallel, households equipped with rooftop solar, 10 kWh batteries, and AMS-linked apps can modulate consumption, although their aggregate contribution to the Norway power market remains modest compared with industrial swing loads. Overall, end-user segmentation is evolving from a utility-led hierarchy to a multi-actor ecosystem in which flexible industrial demand anchors the next growth chapter.
Geography Analysis
Southern Norway, home to Oslo, Stavanger, and Kristiansand, captures roughly 54.60% of national electricity consumption and faces the tightest grid constraints. Statnett’s Sima–Samnanger 420 kV upgrade, budgeted at NOK 12 billion (USD 1.1 billion), will raise north-south transfer capacity 1.5 GW by 2029, easing price spreads that touched NOK 0.80 per kWh in January 2024. Offshore wind output from Sørlige Nordsjø II will land in this zone, increasing the Norway power market size associated with coastal provinces once the 1.5 GW comes online. Nevertheless, export-weighted opportunity costs keep spot prices volatile when German gas scarcity lifts continental benchmarks.
Central and northern regions possess the bulk of unutilized hydro potential and land for onshore wind, yet low population density means surplus often travels south via congested corridors. The Norway power market benefits from this surplus during wet years, but transmission bottlenecks can curtail up to 2 TWh annually. Sami reindeer-herding districts in Finnmark and Trøndelag impose stringent social-license requirements on wind projects, limiting local capacity additions. However, green-field data-center consortia are scouting Tromsø and Bodø for cold-climate efficiency, a development that could localize demand and flatten price divergence once sub-250 MW industrial loads come online.
Cross-border dynamics add a third geographic layer. The North Sea Link, NordLink, and planned Denmark cable position Norway as a balancing agent for the United Kingdom and continental Europe. Export volumes can exceed 25% of domestic generation during wet summers, underpinning revenue streams that fund grid expansion. Yet the same cables invite imports when hydro reservoirs dip, emphasizing how the Norway power market is now structurally interlaced with broader European electricity supply-demand patterns. Regulatory debates over winter export caps illustrate that geographic considerations now encompass both national bidding zones and the wider North Sea basin.
Competitive Landscape
The Norway power market is moderately concentrated. Statkraft operates more than 360 hydropower plants totaling 19 GW, making it Europe’s largest renewable generator and granting dispatch flexibility unmatched in the region. Equinor leverages decades of offshore engineering to pivot into wind, owning the 88 MW Hywind Tampen floating array and co-winning Sørlige Nordsjø II. Regional utilities such as Hafslund, Agder Energi, BKK, and Lyse control local distribution networks and retail books, but are integrating vertically into EV charging and smart-grid analytics to defend margins as wholesale spreads narrow.
Technology vendors, including Siemens Energy, ABB Norge, and Nexans, capture value through digital-twin deployment, HVDC converter platforms, and 525 kV subsea cable supply for interconnector projects. Statnett’s NOK 40 billion capex plan through 2030 represents a predictable pipeline for EPC contractors and environmental consultants accustomed to Norway’s stringent permitting norms. Meanwhile, venture-backed aggregators package residential solar-plus-battery fleets into virtual power plants that earn ancillary service fees, nibbling at revenue lines historically reserved for incumbent generators.
Competitive intensity may rise as foreign utilities eye offshore wind zones, but asset-specific knowledge of fjord hydrology, local permitting, and North Sea weather windows still favors domestic incumbents. Equinor and Statkraft signed a cooperation agreement in 2024 to explore joint bids on floating projects, signaling a pre-emptive alliance to keep foreign capital minority-positioned. At the same time, industrial buyers become market makers by underwriting multiyear PPAs, subtly shifting bargaining power away from generators. Thus, the Norway power market is transitioning from supply-side dominance to a more transactional landscape mediated by long-dated contracts and digital flexibility platforms.
Norway Power Industry Leaders
Statkraft AS
Agder Energi SA
Equinor ASA
Hafslund Eco
BKK (Bergen Kraft)
- *Disclaimer: Major Players sorted in no particular order

Recent Industry Developments
- April 2025: Itron and Norgesnett launched the Nordic region's first grid edge computing deployment, installing 10,000 DI-enabled smart endpoints to enhance grid visibility and control as part of Norgesnett's Advanced Metering Infrastructure modernization program targeting improved operational efficiency and renewable energy integration.
- February 2025: The Norwegian government announced new measures to reduce electricity bills and maintain control over national energy resources, implementing policy changes designed to balance consumer affordability with energy security objectives amid increasing European market integration and price volatility.
- January 2025: SBM Offshore signed an investment agreement with Norwegian company Ocean-Power, acquiring a minority stake to leverage carbon capture expertise for low-carbon electricity generation through the 'Blue Power Hub' concept that combines gas turbines with carbon capture and storage for offshore platform electrification.
- January 2024: Statkraft announced record investment plans of up to EUR 6 billion in Norwegian hydro and wind power, including EUR 1.8-3 billion for hydroelectric plant upgrades, EUR 1.2-2 billion for dam rehabilitation, and approximately EUR 1 billion for new onshore wind farms to double wind power production.


Norway Power Market Report Scope
Power is generated through various primary sources such as coal, hydro, solar, thermal, etc. In utilities, it's a step before its delivery to its end users. Then the process is followed by Transmission and distribution. Under this, the power generated is distributed via high-voltage lines (transmission lines) and low-voltage lines (distribution lines) as per the requirement of the end user.
The Norway power market report is segmented by power sources and end-user. By power sources, the market is segmented into thermal (Coal, Natural Gas, Oil, and Diesel), nuclear, renewables (Solar, Wind, Hydro, Geothermal, Biomass & Waste, Tidal). By end-user, the market is segmented into utilities, commercial and industrial, and residential. The market sizing and forecasts have been done based on electricity generation capacity (GW).
By Power Source
| Thermal (Coal, Natural Gas, Oil and Diesel) |
| Nuclear |
| Renewables (Solar, Wind, Hydro, Geothermal, Biomass & Waste, Tidal) |
By End User
| Utilities |
| Commercial and Industrial |
| Residential |
By T&D Voltage Level (Qualitative Analysis only)
| High-Voltage Transmission (Above 230 kV) |
| Sub-Transmission (69 to 161 kV) |
| Medium-Voltage Distribution (13.2 to 34.5 kV) |
| Low-Voltage Distribution (Up to 1 kV) |
| By Power Source | Thermal (Coal, Natural Gas, Oil and Diesel) |
| Nuclear | |
| Renewables (Solar, Wind, Hydro, Geothermal, Biomass & Waste, Tidal) | |
| By End User | Utilities |
| Commercial and Industrial | |
| Residential | |
| By T&D Voltage Level (Qualitative Analysis only) | High-Voltage Transmission (Above 230 kV) |
| Sub-Transmission (69 to 161 kV) | |
| Medium-Voltage Distribution (13.2 to 34.5 kV) | |
| Low-Voltage Distribution (Up to 1 kV) |


Key Questions Answered in the Report
How large is the Norway power market in 2026?
The Norway power market size stands near 43.01 GW in 2026, on track with the 3.12% CAGR that points toward 50.18 GW by 2031.
What portion of Norway's generation comes from renewables?
Renewables covered 94.8% of supply in 2024, led by hydropower and expanding offshore wind additions slated to raise total renewable output by another 6 TWh annually after 2028.
Which segment is growing fastest in electricity demand?
Commercial and industrial buyers, notably data centers and hydrogen plants, are forecast to grow at 6.52% annually, outpacing both utilities and residential loads.
How is Norway managing price volatility from cross-border trading?
HVDC links enable surplus exports but also import high-priced power during dry spells; Statnett balances the risk through reservoir management, dynamic tariffs, and a NOK 40 billion grid upgrade plan.
What role does offshore wind play in future supply?
At least 1.5 GW from Sørlige Nordsjø II and additional licenses could lift offshore wind capacity to 3-4 GW by 2030, adding diversity and export flexibility to the generation mix.
Who are the leading companies in Norwegian power generation?
Statkraft leads with 19 GW of renewables, followed by Equinor's growing offshore wind portfolio and regional utilities such as Hafslund, Agder Energi, and BKK that run local grids and retail arms.
Page last updated on:


