Blockchain-as-a-Service Market Size and Share
Market Overview
| Study Period | 2020 - 2031 |
|---|---|
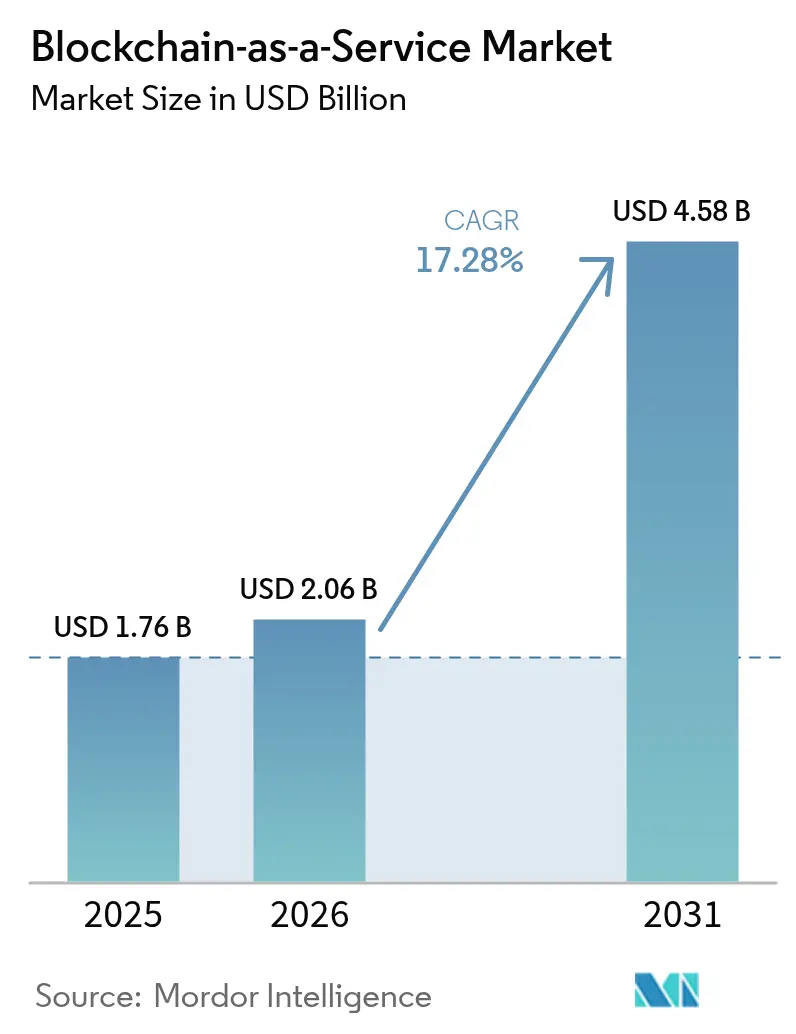
| Market Size (2026) | USD 2.06 Billion |
| Market Size (2031) | USD 4.58 Billion |
| Growth Rate (2026 - 2031) | 17.28% CAGR |
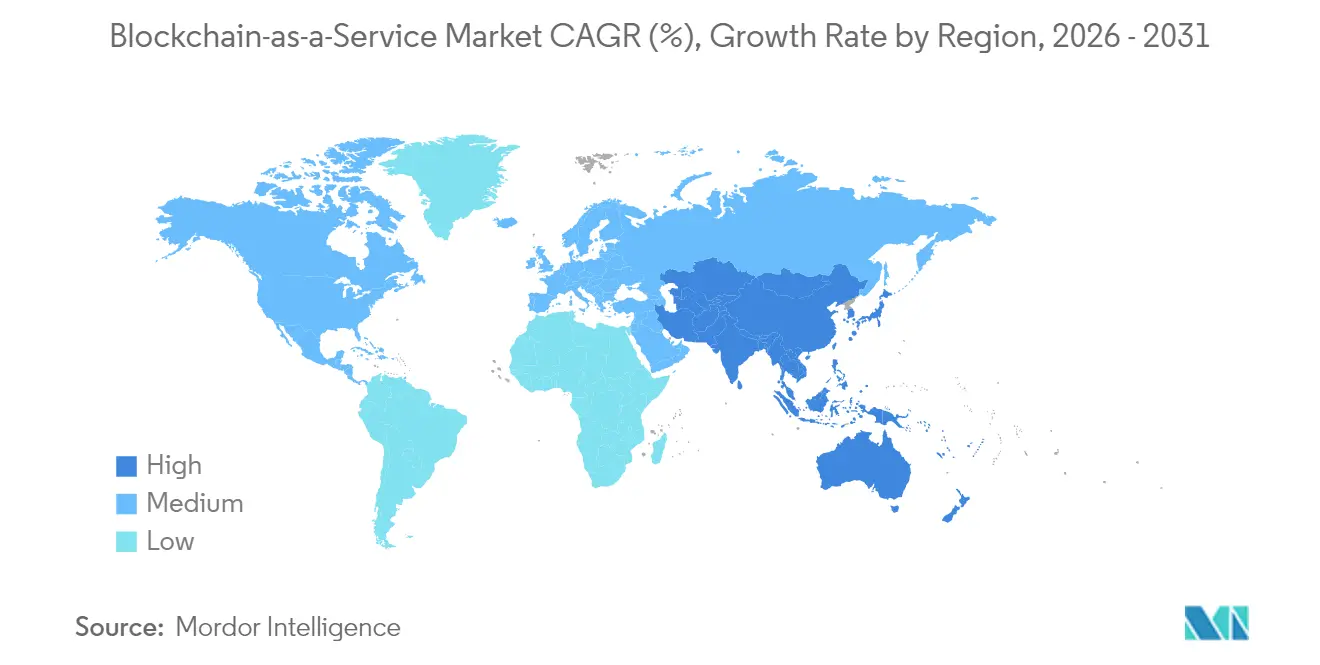
| Fastest Growing Market | Asia Pacific |
| Largest Market | North America |
| Market Concentration | Medium |
Major Players *Disclaimer: Major Players sorted in no particular order Image © Mordor Intelligence. Reuse requires attribution under CC BY 4.0. | |
Blockchain-as-a-Service Market Analysis by Mordor Intelligence
The Blockchain-as-a-Service market size is expected to grow from USD 1.76 billion in 2025 to USD 2.06 billion in 2026 and is forecast to reach USD 4.58 billion by 2031 at 17.28% CAGR over 2026-2031. The Blockchain-as-a-Service market is gaining momentum as enterprises move from small-scale proofs of concept toward production deployments, spurred by clearer regulations and cloud providers that embed distributed-ledger tools within broader infrastructure bundles. Central-bank digital-currency pilots, especially the Bank for International Settlements’ mBridge project, are generating downstream demand for enterprise blockchain platforms.[1]Bank for International Settlements, “Project mBridge: Minimum viable product,” bis.org Cloud hyperscalers’ bundled offerings reduce procurement friction, while regulatory frameworks such as the European Union’s Markets in Crypto-Assets regulation legitimize enterprise spending.[2]European Union, “Markets in Crypto-Assets Regulation,” eur-lex.europa.eu North American sandbox programs and Asia Pacific’s state-funded tokenization initiatives further accelerate uptake. At the same time, ongoing talent shortages and protocol-level interoperability gaps remain watchpoints that could temper short-term growth.
Key Report Takeaways
- By component, Platform-as-a-Service led with 37.30% revenue share in 2025, whereas Managed Services is forecast to expand at a 19.25% CAGR through 2031.
- By deployment model, Public Cloud captured 62.20% of the Blockchain-as-a-Service market share in 2025; Hybrid Cloud is projected to rise at a 21.35% CAGR to 2031.
- By organization size, Large Enterprises accounted for 60.60% of the Blockchain-as-a-Service market size in 2025, while Small and Medium Enterprises recorded the quickest growth at 23.90% CAGR.
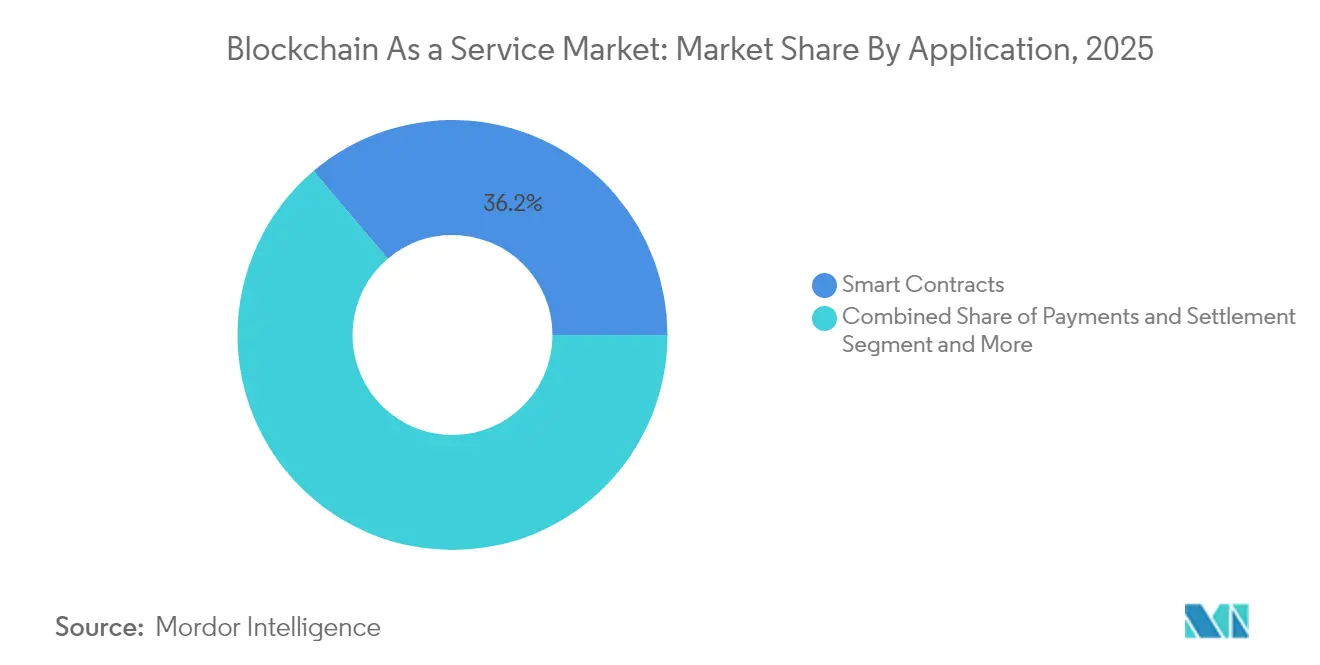
- By application, Smart Contracts commanded 36.20% of revenue in 2025, and Digital Identity and KYC is poised for a 24.70% CAGR through 2031.
- By end-user vertical, Banking, Financial Services, and Insurance held a 33.10% share in 2025; Healthcare and Life Sciences advanced fastest at 25.05% CAGR.
- By geography, North America led with a 40.40% share in 2025, whereas Asia Pacific shows the steepest trajectory at 18.20% CAGR.
Note: Market size and forecast figures in this report are generated using Mordor Intelligence’s proprietary estimation framework, updated with the latest available data and insights as of 2026.
Global Blockchain-as-a-Service Market Trends and Insights
Drivers Impact Analysis*
| Driver | ( ~ ) % Impact on CAGR Forecast | Geographic Relevance | Impact Timeline |
|---|---|---|---|
| Rising demand for tamper-proof data integrity across regulated industries | +3.2% | Global, with concentration in North America and EU | Medium term (2–4 years) |
| Cloud hyperscalers bundling BaaS into broader X-as-a-Service stacks | +2.8% | Global, led by North America, expanding to APAC | Short term (≤ 2 years) |
| Gradual regulatory clarity on tokenization and stablecoins | +2.1% | EU, selective US jurisdictions | Medium term (2–4 years) |
| Central-bank sandbox programs sourcing BaaS back-ends | +1.9% | APAC core, spill-over to MEA | Long term (≥ 4 years) |
| Explosion of enterprise-grade blockchain pilots post-2024 | +1.7% | Global | Short term (≤ 2 years) |
| Scope-3 emissions auditing via sustainability ledgers | +1.4% | EU, voluntary North America | Long term (≥ 4 years) |
| Source: Mordor Intelligence | |||
Rising demand for tamper-proof data integrity across regulated industries
Health, finance, and pharmaceuticals increasingly adopt blockchain to meet stringent audit-trail and provenance mandates. Change Healthcare’s Hyperledger Fabric deployment already processes about 50 million daily transactions while preserving immutable logs.[3]Hyperledger Foundation, “Change Healthcare case study,” hyperledger.org European pharmaceutical rules that track medicine provenance drive similar uptake. Financial institutions cut compliance workloads by recording regulatory data on chains that regulators deem trustworthy under MiCA. These sector mandates position the Blockchain-as-a-Service market as a compliance enabler, particularly as auditors begin to prefer immutable records over traditional databases. Demand, therefore, scales with every new data-integrity policy in advanced economies.
Cloud hyperscalers bundling BaaS into broader X-as-a-Service stacks
Microsoft integrates blockchain, AI, and IoT on Azure, letting clients activate ledgers through familiar portals and existing contracts. Amazon Web Services and Google Cloud follow, while Kaleido’s Azure tie-up offers more than 500 pre-built APIs that snap into enterprise tools. Bundling cuts procurement cycles, especially for mid-market firms without deep cryptography skills, and keeps operating costs variable instead of capital-intensive. This packaging strategy keeps the Blockchain-as-a-Service market visible to every customer managing cloud workloads, making adoption an incremental, rather than transformative, decision.
Gradual regulatory clarity on tokenization and stablecoins
EU MiCA rules effective December 2024, describe licensing, capital, and disclosure obligations for stablecoin issuers, which reassures banks exploring on-chain settlement. Mastercard’s 2025 deal with Fiserv to embed FIUSD across its card network highlights how clear guardrails unlock mainstream pilots. Central-bank experiments such as BIS Project Agorá give private providers technical blueprints for compliant back-end services. Each milestone reduces legal uncertainty, spurring enterprises to commit multi-year budgets.
Central-bank sandbox programs sourcing BaaS back-ends
The Hong Kong Monetary Authority’s Project Ensemble invites commercial ledgers to provide wholesale settlement rails. Thailand’s Retail CBDC pilot and the Bank of England’s Digital Securities Sandbox set interoperability and performance benchmarks that Blockchain-as-a-Service vendors must meet. Compliance within these sandboxes signals quality to commercial users, creating a pipeline of reference deployments across Asia Pacific and beyond.
Restraints Impact Analysis*
| Restraint | ( ~ ) % Impact on CAGR Forecast | Geographic Relevance | Impact Timeline |
|---|---|---|---|
| Fragmented standards and protocol interoperability gaps | -2.4% | Global, more acute for multi-region rollouts | Medium term (2–4 years) |
| Talent shortage in distributed-ledger engineering | -1.8% | Global, acute in North America and EU | Long term (≥ 4 years) |
| Uncertain jurisprudence on smart-contract enforceability | -1.3% | Global, varying by jurisdiction | Long term (≥ 4 years) |
| Rising cloud spend scrutiny dampening POC budgets | -1.1% | Global, cost-sensitive enterprises | Short term (≤ 2 years) |
| Source: Mordor Intelligence | |||
Fragmented standards and protocol interoperability gaps
IEEE and ISO continue to draft frameworks, yet no universal plug-and-play standard exists, forcing enterprises to custom-build cross-chain connectors iso.org. Sensors-journal research shows such architectures add complexity and new attack surfaces. Multinationals therefore hesitate to scale pilots across borders, which slows cumulative contract flow into the Blockchain-as-a-Service market. Until dominant interoperability protocols mature, vendors must allocate road-map resources to proprietary bridges that elevate costs and lengthen implementation timelines.
Talent shortage in distributed-ledger engineering
Blockchain roles in the United States command mean salaries near USD 146,250, reflecting scarcity.[4]Algorand Foundation, “Blockchain developer salary report,” algorand.foundationCryptography, consensus, and smart-contract skills remain rare in mainstream computer-science programs, so enterprises over-rely on small pools of senior engineers. Project delays and consultant premiums inflate the total cost of ownership, especially for small firms. This bottleneck affects the Blockchain-as-a-Service industry globally and is likely to persist beyond 2028 because university pipelines lag commercial demand.
*Our forecasts treat driver/restraint impacts as directional, not additive. The impact forecasts reflect baseline growth, mix effects, and variable interactions.
Segment Analysis
By Component: Managed Services Scale Faster Than Core Platforms
Platform-as-a-Service contributed 37.30% revenue in 2025, underpinned by integrated development environments and configurability that attract large corporations. Managed Services, however, grows fastest at 19.25% CAGR as organizations seek turnkey operations, security patching and 24/7 uptime without running nodes themselves. Large multinational treasury teams cite tangible savings; Siemens cut bank accounts by half and saved USD 20 million each year after migrating to managed ledgers for cross-border liquidity. Consulting and implementation work remains essential to bridge legacy ERP systems and to meet sector-specific regulations in finance and healthcare.
Enterprises also adopt Infrastructure-as-a-Service when they need granular control over consensus settings yet still prefer cloud billing. Meanwhile, software-as-a-service toolkits expose APIs that abstract smart-contract compilation, lowering entry barriers for small developers. Rising compliance workloads make immutable audit trails a default requirement, so even risk-averse boards now approve subscriptions. This persistent demand anchors the Blockchain-as-a-Service market across both greenfield and brownfield deployments.


By Deployment Model: Hybrid Cloud Balances Control and Flexibility
Public Cloud captured 62.20% of the Blockchain-as-a-Service market share in 2025 because hyperscalers provide elasticity and high service-level agreements. Still, Hybrid Cloud is on track for a 21.35% CAGR as financial institutions and pharmaceutical firms hold sensitive data on-premises to satisfy residency laws under MiCA and similar policies. Hybrid topologies keep production chains behind firewalls while using public cloud for development sandboxes, which speeds iteration.
Private Cloud persists where data sovereignty or classified workloads prohibit any external infrastructure. The European Union’s new operational-resilience rules further motivate contingency planning, making hybrid designs attractive. As a result, the Blockchain-as-a-Service market sees consistent architectural diversity: enterprises swap workloads between environments in response to cost audits or new compliance directives, ensuring long-run demand for orchestration tools.
By Organization Size: SMEs Harness User-Friendly Platforms
Large Enterprises generated 60.60% of the Blockchain-as-a-Service market size in 2025, reflecting deep budgets and multi-region supply chains. Small and Medium Enterprises, though, expand adoption at 23.90% CAGR thanks to template-driven platforms and managed nodes that hide complexity. Mid-sized importers can now trace shipments on a consortium ledger without recruiting cryptographers. Research shows blockchain can cut infrastructure costs by 43% in supply-chain scenarios, savings that resonate with cash-focused SMEs.
Enterprise pioneers such as Walmart demonstrated how traceability slashes recall times from days to seconds. SMEs emulate these benefits on narrower scopes, for example single-product lines. Cloud subscription pricing aligns with variable demand, allowing gradual expansion instead of disruptive capex. Talent shortages remain a challenge, but marketplace plug-ins and no-code smart-contract tools continue to lower the threshold for entry.
By Application: Digital Identity Advances at High Speed
Smart Contracts retained 36.20% revenue in 2025, underpinning automated invoicing, escrow and compliance verification workflows. Digital Identity and KYC accelerates at a 24.70% CAGR through 2031 because regulators tighten customer-due-diligence rules. The United Nations’ 2024 digital-ID rollout confirmed blockchain’s suitability for interoperable credentials across agencies. Supply-chain traceability also climbs as sustainability reporting and consumer provenance demands rise.
Payments and settlement workflows benefit from central-bank pilots that require robust ledger infrastructure. Stablecoin integrations such as Mastercard’s FIUSD project showcase live payment volumes on permissioned chains. Governance, risk and compliance applications close the loop by automating reporting, using immutable logs to speed audits and reduce manual reconciliations. Combined, these use cases diversify the Blockchain-as-a-Service market and cushion it against single-segment downturns.
By End-User Vertical: Healthcare Leads Growth Curve
Banking, Financial Services and Insurance owned 33.10% revenue in 2025, leveraging blockchain for 24/7 cross-border payments, trade-finance document tracking and digital-asset custody. Citi’s Token Services for Cash illustrates how tokenized deposits streamline treasury operations and meet near-time settlement demands. Healthcare and Life Sciences exhibits a 25.05% CAGR through 2031 as regulators enforce end-to-end drug traceability and push for interoperable patient records.
Manufacturing and energy companies implement ledgers to verify equipment provenance and carbon-credit transactions, aligning with emerging Scope-3 reporting duties. The public sector explores citizen ID, voting, and land registry pilots to cut fraud and improve transparency. Each vertical’s regulatory pain points map neatly to blockchain attributes, ensuring broad adoption momentum inside the Blockchain-as-a-Service market.
Geography Analysis
North America continued to dominate in 2025 with a 40.40% Blockchain-as-a-Service market share, buoyed by deep venture funding such as Digital Asset’s USD 135 million round led by Goldman Sachs and Citadel. US-based hyperscalers integrate ledger tools into mainstream cloud menus, allowing quick uptakes among existing clients. Regulatory sandboxes in several states accelerate production pilots, though nationwide policy fragmentation still injects compliance uncertainty that slows multi-state rollouts.
Asia Pacific records the steepest growth at an 18.20% CAGR through 2031. Government-backed CBDC and tokenization projects in Singapore and Hong Kong create visible proof points, drawing banks and fintechs onto commercial platforms. Manufacturing hubs across Japan, South Korea and China deploy blockchains for supply-chain and sustainability reporting use cases, leveraging intra-Asia trade corridors. Regional talent pools expand through university blockchain labs, helping offset developer shortages seen elsewhere.
Europe benefits from MiCA’s uniform rules that became fully effective in December 2024. Automotive, luxury and food companies implement provenance solutions to satisfy regulators and consumers, exemplified by Renault’s XCEED supply-chain systeM. The European Central Bank’s advocacy for digital-assets market integration encourages banks to modernize back offices with distributed-ledger infrastructure, sustaining near-term contract flow. Emerging markets in the Middle East and Africa experiment with blockchain for financial inclusion and carbon credit registries, yet overall adoption remains nascent due to limited technical capacity.

Competitive Landscape
The Blockchain-as-a-Service market shows moderate fragmentation. Hyperscalers compete on breadth: IBM claims more than 14,000 blockchain-related patent filings with 10,000 granted, fortifying its IP moat. Microsoft Azure and Amazon Web Services embed ledgers into developer-tool pipelines, locking in users through integrated identity, analytics, and security services. Specialized vendors such as Kaleido and R3 focus on low-code orchestration and compliance modules that cater to regulated sectors.
Financial institutions increasingly take equity stakes in infrastructure firms. Deutsche Bank joined JPMorgan and Standard Chartered in Partior’s USD 80 million Series B to secure influence over multi-currency settlement networks. Technology differentiation gravitates toward throughput, with Teranode architecture demonstrating 3 million transactions per second via horizontal sharding Vendors also explore blockchain-AI convergence for real-time fraud analytics and automated contract summarization. Despite consolidation pressure, plentiful niche opportunities remain in cross-chain gateways and ESG data orchestration, keeping competitive intensity high
Blockchain-as-a-Service Industry Leaders
Microsoft Corporation
Hewlett-Packard Enterprise
IBM Corporation
SAP SE
Stratis
- *Disclaimer: Major Players sorted in no particular order

Recent Industry Developments
- June 2025: Mastercard partnered with Fiserv to embed the FIUSD stablecoin across its global payment rails, enabling programmable on-chain commerce.
- June 2025: 0G Labs launched the Newton testnet for a modular AI chain rated at 50 Gbps throughput ahead of its Q3 2024 mainnet.
- June 2025: Digital Asset secured USD 135 million from Goldman Sachs and Citadel to scale the Canton Network for real-world-asset tokenization.
- May 2025: Zimbabwe opened a blockchain-enabled carbon-credit registry to enhance transparency for offset trading.


Global Blockchain-as-a-Service Market Report Scope
| Platform-as-a-Service (PaaS) |
| Infrastructure-as-a-Service (IaaS) |
| Software-as-a-Service (SaaS) SDKs and APIs |
| Consulting and Implementation Services |
| Managed/Operations Services |
| Public Cloud |
| Private Cloud |
| Hybrid Cloud |
| Large Enterprises |
| Small and Medium Enterprises |
| Smart Contracts |
| Supply-Chain Traceability |
| Digital Identity and KYC |
| Payments and Settlement |
| Governance, Risk and Compliance |
| Others |
| Banking, Financial Services and Insurance (BFSI) |
| Healthcare and Life Sciences |
| IT and Telecom |
| Retail and E-commerce |
| Manufacturing |
| Energy and Utilities |
| Government and Public Sector |
| Others |
| North America | United States | |
| Canada | ||
| Mexico | ||
| South America | Brazil | |
| Argentina | ||
| Chile | ||
| Rest of South America | ||
| Europe | Germany | |
| United Kingdom | ||
| France | ||
| Italy | ||
| Spain | ||
| Netherlands | ||
| Russia | ||
| Rest of Europe | ||
| Asia Pacific | China | |
| India | ||
| Japan | ||
| South Korea | ||
| ASEAN | ||
| Rest of Asia Pacific | ||
| Middle East and Africa | Middle East | GCC (Saudi Arabia, UAE, Qatar, etc.) |
| Turkey | ||
| Rest of Middle East | ||
| Africa | South Africa | |
| Nigeria | ||
| Kenya | ||
| Rest of Africa | ||
| By Component | Platform-as-a-Service (PaaS) | ||
| Infrastructure-as-a-Service (IaaS) | |||
| Software-as-a-Service (SaaS) SDKs and APIs | |||
| Consulting and Implementation Services | |||
| Managed/Operations Services | |||
| By Deployment Model | Public Cloud | ||
| Private Cloud | |||
| Hybrid Cloud | |||
| By Organization Size | Large Enterprises | ||
| Small and Medium Enterprises | |||
| By Application | Smart Contracts | ||
| Supply-Chain Traceability | |||
| Digital Identity and KYC | |||
| Payments and Settlement | |||
| Governance, Risk and Compliance | |||
| Others | |||
| By End-User Vertical | Banking, Financial Services and Insurance (BFSI) | ||
| Healthcare and Life Sciences | |||
| IT and Telecom | |||
| Retail and E-commerce | |||
| Manufacturing | |||
| Energy and Utilities | |||
| Government and Public Sector | |||
| Others | |||
| By Geography | North America | United States | |
| Canada | |||
| Mexico | |||
| South America | Brazil | ||
| Argentina | |||
| Chile | |||
| Rest of South America | |||
| Europe | Germany | ||
| United Kingdom | |||
| France | |||
| Italy | |||
| Spain | |||
| Netherlands | |||
| Russia | |||
| Rest of Europe | |||
| Asia Pacific | China | ||
| India | |||
| Japan | |||
| South Korea | |||
| ASEAN | |||
| Rest of Asia Pacific | |||
| Middle East and Africa | Middle East | GCC (Saudi Arabia, UAE, Qatar, etc.) | |
| Turkey | |||
| Rest of Middle East | |||
| Africa | South Africa | ||
| Nigeria | |||
| Kenya | |||
| Rest of Africa | |||


Key Questions Answered in the Report
What is the current value of the Blockchain-as-a-Service market?
The market is valued at USD 2.06 billion in 2026 and is projected to reach USD 4.58 billion by 2031.
Which segment grows fastest within the Blockchain-as-a-Service market?
Managed Services shows the highest component-level growth at a 19.25% CAGR through 2031.
Why is Hybrid Cloud deployment accelerating?
Enterprises adopt Hybrid Cloud to keep sensitive data on-premises for regulatory reasons while using public cloud capacity for development and scaling, driving a 21.35% CAGR.
Which region offers the strongest growth outlook?
Asia Pacific expands at an 18.20% CAGR due to government-backed CBDC pilots and large-scale tokenization projects in markets such as Singapore and Hong Kong.
What are the main restraints hindering market expansion?
Fragmented interoperability standards and a global shortage of skilled blockchain engineers remain the primary constraints, reducing the forecast CAGR by a combined 4.2%.
How concentrated is competition in the Blockchain-as-a-Service market?
The space scores 4/10 for concentration, with cloud hyperscalers leading but many specialist vendors still capturing significant shares.
Page last updated on:


