Hematology Market Size and Share
Market Overview
| Study Period | 2020 - 2031 |
|---|---|
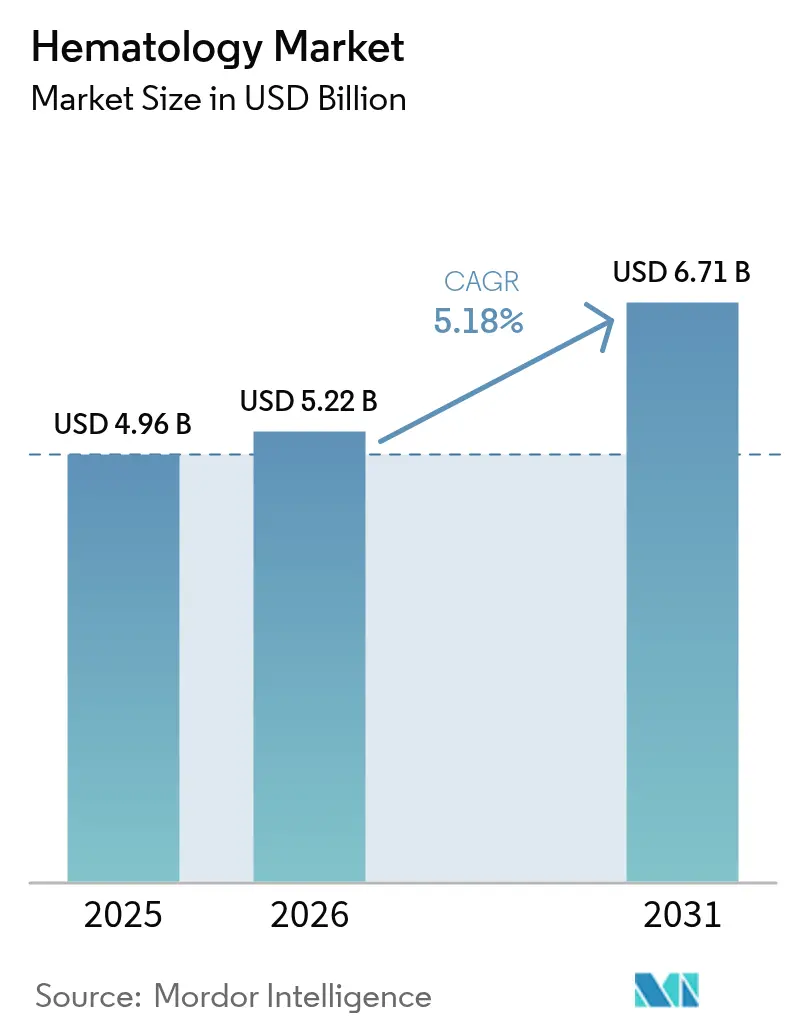
| Market Size (2026) | USD 5.22 Billion |
| Market Size (2031) | USD 6.71 Billion |
| Growth Rate (2026 - 2031) | 5.18% CAGR |
| Fastest Growing Market | Asia Pacific |
| Largest Market | North America |
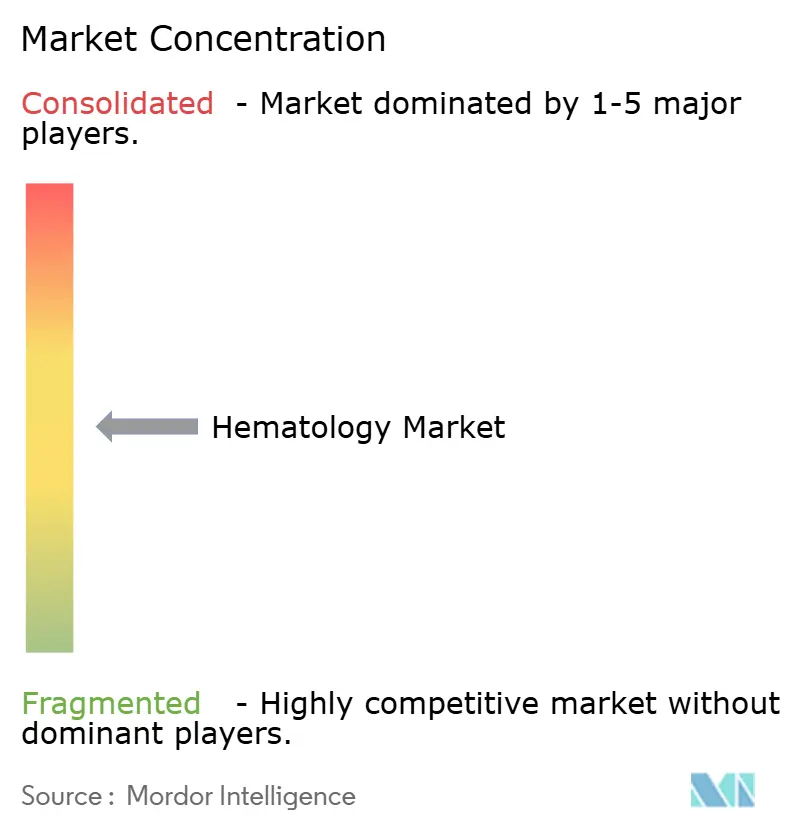
| Market Concentration | Medium |
Major Players *Disclaimer: Major Players sorted in no particular order Image © Mordor Intelligence. Reuse requires attribution under CC BY 4.0. | |
Hematology Market Analysis by Mordor Intelligence
The hematology market size in 2026 is estimated at USD 5.22 billion, growing from 2025 value of USD 4.96 billion with 2031 projections showing USD 6.71 billion, growing at 5.18% CAGR over 2026-2031. Demand is propelled by the rapid uptake of artificial-intelligence enabled automation, the growing burden of hematologic cancers and anemia, and wider availability of point-of-care (POC) testing platforms. Automated platforms boost laboratory throughput and cut human-error rates, while cloud-connected middleware helps laboratories offset skilled-labor shortages. At the same time, high-parameter flow cytometers improve measurable residual-disease detection, sustaining premium analyzer sales despite capital-intensity concerns. Supply-chain risks around porcine-sourced heparin and data-privacy regulations for connected instruments temper near-term momentum but are unlikely to derail the broader growth trajectory. North America retains volume leadership, yet Asia-Pacific is accelerating on the back of health-infrastructure upgrades and local production investments.
Key Report Takeaways
- By product, analyzers captured 37.09% of the hematology market share in 2025; flow cytometers are projected to expand at a 12.4% CAGR through 2031.
- By reagent, CBC and differential consumables accounted for 45.05% of the hematology market size in 2025, while flow-cytometry reagents are poised to grow at an 11.62% CAGR to 2031.
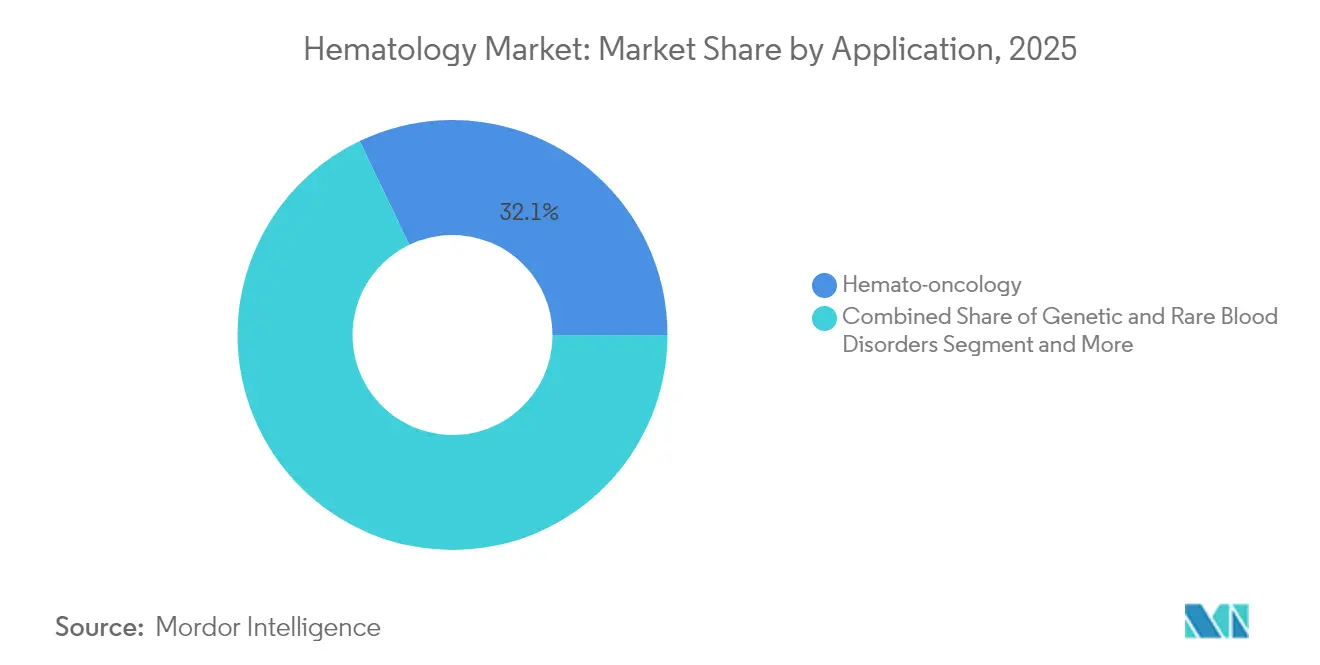
- By application, hemato-oncology commanded 32.11% share of the hematology market size in 2025; genetic and rare-disorder testing should advance at a 14.9% CAGR over the forecast horizon.
- By end user, hospital laboratories held 52.63% revenue share in 2025, whereas POC settings are set to record a 12.12% CAGR up to 2031.
- By geography, North America led with 37.74% share in 2025; Asia-Pacific is forecast to post an 11.4% CAGR between 2026 and 2031.
Note: Market size and forecast figures in this report are generated using Mordor Intelligence’s proprietary estimation framework, updated with the latest available data and insights as of 2026.
Global Hematology Market Trends and Insights
Drivers Impact Analysis*
| Driver | (~) % Impact on CAGR Forecast | Geographic Relevance | Impact Timeline |
|---|---|---|---|
| Growth In AI-Enabled Automated CBC Platforms | +1.2% | Global, with early adoption in North America & Europe | Medium term (2-4 years) |
| Rising Incidence Of Hematologic Cancers & Anemia | +1.0% | Global, highest impact in aging populations of developed markets | Long term (≥ 4 years) |
| Expansion Of Decentralized POC Hematology Testing | +0.8% | APAC core, spill-over to Latin America & MEA | Short term (≤ 2 years) |
| Surge In Complex Therapies Needing Advanced Blood Monitoring | +0.7% | North America & EU, expanding to APAC | Medium term (2-4 years) |
| Favourable Reimbursement For High-Throughput Analyzers | +0.5% | North America & select EU markets | Short term (≤ 2 years) |
| Growing Veterinary Diagnostics As A Parallel Revenue Stream | +0.3% | Global, concentrated in developed markets | Long term (≥ 4 years) |
| Source: Mordor Intelligence | |||
Growth in AI-enabled Automated CBC Platforms
Low-cost AI flow-cytometry prototypes developed at Rice University demonstrate performance comparable to high-end systems, lowering entry barriers for resource-constrained facilities. The FDA’s reclassification of automated hemoglobin systems to Class II further eases U.S. market access[1]U.S. Food and Drug Administration, “21 CFR 864.5620—Automated Hemoglobin System,” ecfr.gov. Machine-learning algorithms now deliver sub-second cell-morphology recognition, shrinking turnaround times and supporting adoption in high-volume hospitals. Cloud analytics also help labs benchmark quality metrics across networks, reinforcing procurement arguments. Collectively, these gains elevate analyzer utilization rates and underpin recurring reagent revenues, keeping the hematology market on a firm growth path.
Rising Incidence of Hematologic Cancers & Anemia
The Leukemia & Lymphoma Society counts 1.70 million U.S. residents living with blood cancers, with 187,740 new cases expected in 2024[2]The Leukemia & Lymphoma Society, “Facts 2023-2024,” lls.org. Ageing populations in developed economies drive prevalence, while improved survival extends monitoring cycles that rely on routine CBC and flow-cytometry panels. Progress in targeted therapies widens patient eligibility, lifting test volumes. Advanced economies shoulder the largest caseloads, yet emerging markets are catching up as diagnostic infrastructure expands. The sustained clinical burden translates into predictable demand, anchoring the hematology market against economic volatility.
Expansion of Decentralized POC Hematology Testing
The FDA cleared the first POC hepatitis C RNA assay in 2024, signaling regulatory support for near-patient diagnostics. Portable Hb devices such as Masimo’s SpHb monitor enable real-time hemoglobin tracking without venipuncture. CMS amended rules for rural clinics, removing obligatory hemoglobin tests from central-lab panels and freeing providers to adopt POC workflows. Tele-health integration allows remote specialists to review results instantaneously, shrinking treatment delays. These structural shifts move a share of volumes away from hospital cores into outpatient and community settings, broadening the hematology market footprint.
Surge in Complex Therapies Needing Advanced Blood Monitoring
CAR-T protocols and gene therapies demand 19-color flow panels for residual-disease tracking, pushing laboratories toward higher-parameter cytometers. The FDA approval of Duvyzat for Duchenne muscular dystrophy mandates platelet monitoring, reinforcing comprehensive hematology panels during therapy. Beckman Coulter’s DxFLEX clearance underscores industry responsiveness, bringing 13-color immunophenotyping into routine clinical use. As biopharma pipelines swell with precision treatments, real-time hematologic monitoring becomes integral, stimulating premium-segment growth within the hematology market.
Restraints Impact Analysis*
| Restraint | (~) % Impact on CAGR Forecast | Geographic Relevance | Impact Timeline |
|---|---|---|---|
| Capital-Intensive Next-Gen Analyzers & Reagent Contracts | -0.9% | Global, most acute in emerging markets | Medium term (2-4 years) |
| Data-Privacy Barriers To Cloud-Connected Lab Instruments | -0.6% | EU & North America, expanding globally | Short term (≤ 2 years) |
| Shortage Of Skilled Hematopathologists In LMICs | -0.5% | Low and middle-income countries | Long term (≥ 4 years) |
| Consumable Supply-Chain Fragility (Heparin, Antibodies) | -0.4% | Global, with regional concentration risks | Short term (≤ 2 years) |
| Source: Mordor Intelligence | |||
Capital-intensive Next-generation Analyzers & Reagent Contracts
Comprehensive hematology systems can exceed USD 500,000 per unit and require multi-year reagent tie-ins, straining budgets of mid-tier hospitals. Hidden costs include staff training, maintenance, and space retrofits, lengthening payback cycles. Emerging-market buyers lean toward refurbished units or staggered upgrades, slowing technology refresh rates. Service-leasing models offer relief but often translate into higher lifetime outlays. Consequently, procurement committees scrutinize large-scale roll-outs, moderating short-term expansion of the hematology market.
Data-privacy Barriers to Cloud-connected Lab Instruments
The U.S. Department of Health and Human Services proposes eliminating “addressable” safeguards in HIPAA, imposing uniform cybersecurity requirements that may cost USD 9.3 billion in year one. GDPR localization rules add complexity for multinational lab groups. Smaller facilities hesitate to adopt cloud-enabled analyzers amid regulatory uncertainty, stalling data-analytics deployments that could enhance throughput. Vendors must bolster encryption and audit features, inflating development spend and potentially raising list prices, a headwind for the hematology market.
*Our forecasts treat driver/restraint impacts as directional, not additive. The impact forecasts reflect baseline growth, mix effects, and variable interactions.
Segment Analysis
By Product: Automation Wave Elevates Analyzers
Analyzers generated 37.09% revenue in 2025, underscoring their role as the operational backbone of hospital laboratories. Integrated systems combining CBC, differential, and digital morphology shorten turnaround times and free technologists for complex tasks. Flow cytometers, projected to compound at 12.4% through 2031, gain traction as immunotherapy monitoring becomes mainstream. Rising deployment of middleware accelerates result-export to electronic medical records, enhancing decision-making speed across care teams.
Premium analyzers bundle quality-control algorithms that minimize repeat tests, supporting reagent pull-through. Meanwhile, slide stainers and centrifuges remain essential for blood-banking workflows, ensuring steady baseline demand. Vendors prioritize modular designs to ease future upgrades, protecting buyer investments and anchoring the hematology market.


By Reagent: CBC Consumables Retain Core Status
CBC reagents contributed 45.05% of the hematology market size in 2025, reflecting the universal role of CBC tests in patient triage. Stable pricing and high daily volumes make CBC consumables a predictable revenue engine. Flow-cytometry reagents are set to climb at an 11.62% CAGR, boosted by CAR-T and residual-disease applications. Emergence of 10-color and higher panels widens reagent pull-through, raising per-test values.
Controls and calibrators gain prominence as laboratories chase accreditation. Bioengineered heparin prototypes aim to mitigate porcine-supply risk, though full substitution will take several years. Overall reagent innovation balances cost containment with performance gains, reinforcing downstream stickiness in the hematology market.
By Application: Oncology Dominates, Genetics Accelerates
Hemato-oncology accounted for 32.11% of 2025 revenues, driven by climbing leukemia and lymphoma diagnoses plus expanding therapeutic monitoring needs. High-frequency follow-up testing sustains repetitive analyzer utilization. Genetic and rare-disorder testing, expanding at a projected 14.9% CAGR, leverages next-generation sequencing and specialized flow panels to detect subtle chromosomal anomalies.
Drug-development programs lean on toxicology blood panels, providing steady commercial-lab volumes. Sepsis detection and autoimmune panels maintain relevance amid broader antimicrobial-stewardship initiatives. The multi-faceted demand profile insulates the hematology market against cyclical downturns.
By End User: Hospitals Hold Core Share While POC Scales
Hospital labs captured 52.63% of 2025 spending, benefiting from bundled capital budgets that can absorb analyzer costs. Centralized labs also manage complex oncology and transplant panels, reinforcing reliance on high-parameter instruments. POC environments, set to rise 12.12% annually, align with outpatient care models that favor rapid results.
Reference labs offer overflow capacity and specialized tests, ensuring balanced market segmentation. Veterinary and research institutes represent emerging niches as cross-species diagnostics gain scientific traction. This user-diversity broadens the serviceable landscape for hematology market participants.
Geography Analysis
North America generated 37.74% of 2025 revenues on the strength of robust reimbursement and early AI adoption. Hospitals fast-tracked analyzer upgrades to mitigate staffing gaps, and national payers rewarded high-throughput platforms. Canada follows similar patterns, although procurement cycles lag the United States by one to two years.
Asia-Pacific advances at an 11.4% CAGR, underpinned by public-sector investments and chronic-disease prevalence. India and China spearhead analyzer installations as domestic manufacturers scale cost-efficient platforms. Regional governments increasingly mandate CBC screening in preventive-health programs, lifting daily test volumes.
Europe maintains steady, mid-single-digit growth as In-Vitro Diagnostic Regulation enforcement raises compliance thresholds. Laboratories consolidate purchases around established brands to simplify audit processes, indirectly benefiting large multinationals. Eastern European members allocate EU-funded grants to modernize provincial labs, expanding the addressable hematology market.
South America records moderate gains; Brazil and Mexico drive bulk demand as private insurers widen coverage for advanced flow cytometry. Currency volatility occasionally delays tenders but has not altered long-term adoption curves.
Middle East and Africa remain nascent yet promising, with Gulf Cooperation Council states piloting national cancer-screening initiatives that rely on CBC and flow cytometry. Donor-funded infrastructure projects bolster basic hematology services in sub-Saharan Africa, creating footholds for future analyzer placements.


Competitive Landscape
The hematology market displays moderate fragmentation; no single player surpasses a significant global share. Sysmex posted 19.2% growth in hematology sales in fiscal-Q1 2025 on the back of AI-enhanced analyzers. Danaher channeled USD 1.5 billion into R&D in 2024, with diagnostics automation a priority. Abbott earmarked USD 500 million for Illinois-based manufacturing upgrades tied to transfusion diagnostics, signaling confidence in blood-safety demand.
Vendors differentiate through software ecosystems that fuse workflow management with decision-support analytics. Cloud-ready platforms promise predictive maintenance and reagent-inventory optimization, though data-privacy regulations shape roll-out strategies. Strategic alliances with telecom providers and cybersecurity firms emerge as a new competitive dimension.
Local manufacturers in India and China target mid-tier hospitals with cost-optimized analyzers, intensifying price competition in Asia-Pacific. Meanwhile, multinational suppliers leverage service networks and reagent breadth to protect share. Patent activity centers on multi-parameter flow cytometry and AI-driven morphology, suggesting incremental rather than disruptive innovation over the next five years.
Hematology Industry Leaders
Thermo Fisher Scientific Inc
Bio-Rad Laboratories, Inc
Siemens Healthineers AG
Danaher Corp.
Abbott Laboratories
- *Disclaimer: Major Players sorted in no particular order

Market Opportunities and Future Outlook
Hematology laboratories are rebalancing investment toward digitized, connected workflows that reduce manual review time and help offset staffing constraints, creating whitespace beyond core CBC throughput. AI-enabled digital morphology and whole-slide review platforms such as CellaVision and Scopio Labs and cloud-connected middleware are moving from pilot use into routine operations where they can standardize smear interpretation across networks and shorten turnaround times. The opportunity concentrates in upgrades that bundle analyzers with software and governance features (audit trails, cybersecurity controls, validated QC) as health systems seek scalable standardization alongside high-volume testing.
Higher-complexity monitoring needs in hemato-oncology and advanced therapies keep demand anchored for high-parameter flow cytometry, while decentralized testing expands where care pathways reward fast results in outpatient and rural settings. At the same time, buyers are scrutinizing total cost of ownership for capital-intensive next-generation analyzers and multi-year reagent contracts, opening space for flexible commercialization models such as reagent-rental, managed services, and modular upgrades that protect installed-base investments. Industry deal activity also signals continued portfolio expansion around adjacent high-value diagnostics and pathology workflows, highlighted by Agilent completing its Biocare Medical acquisition in June 2026 and ARCHIMED acquiring coagulation specialist Stago in April 2026, actions that can broaden bundled offerings sold into the same laboratory customer base.
Recent Industry Developments
- July 2026: Siemens Healthineers expanded its hematology portfolio with U.S. availability of the Atellica HEMA 580 Analyzer, enabling automation-ready workflows with middleware connectivity and options for remote digital slide review. The launch targets high-volume laboratories seeking more consistent results and lower hands-on time, and it intensifies competition for premium analyzer placements with integrated software ecosystems that influence long-term reagent pull-through.
- June 2026: Agilent completed the acquisition of Biocare Medical, adding clinical pathology capabilities to its Life Sciences and Diagnostics Markets Group portfolio. The integration broadens Agilent's offerings across anatomic and clinical pathology workflows used alongside hematology and hemato-oncology diagnostics while expanding cross-selling potential into hospital and reference laboratories.
- March 2024: Beckman Coulter secured FDA 510(k) clearance for the DxFLEX Clinical Flow Cytometer, bringing 13-color immunophenotyping into routine diagnostics. The clearance expands access to higher-content flow testing that supports residual disease assessment and therapy monitoring, reinforcing the shift toward advanced cytometry platforms in hemato-oncology labs.


Research Methodology Framework and Report Scope
Market Definition and Coverage
For this study, the hematology market is defined as the global demand for hematology testing products used to assess blood cells and related parameters in clinical and lab settings, captured in USD value across major regions.
Scope exclusions: The sizing excludes broader therapeutic hematology drugs and non-hematology general lab consumables that are not used for hematology testing.
Segmentation Overview
- By Product
- Hematology Analyzers
- Flow Cytometers
- Coagulation Analyzers
- Slide Stainers
- Centrifuges & Blood Processing Systems
- Hemoglobinometers
- Software & Middleware
- Other Products
- By Reagent
- Coagulation Reagents
- Flow Cytometry Reagents & Kits
- Immuno-hematology Reagents
- CBC & Differential Reagents
- Controls & Calibrators
- Other Reagents
- By Application
- Drug Discovery & Toxicology
- Auto-immune Diseases
- Hemato-oncology
- Diabetes Management (HbA1c)
- Infectious Diseases & Sepsis
- Genetic & Rare Blood Disorders
- Other Applications
- By End User
- Hospital Laboratories
- Reference & Clinical Testing Labs
- Point-of-Care Settings
- Blood Banks & Transfusion Centers
- Other End Users (Academic & Research Institutes, Veterinary Diagnostics Labs, and Others)
- Geography
- North America
- United States
- Canada
- Mexico
- Europe
- Germany
- United Kingdom
- France
- Italy
- Spain
- Rest of Europe
- Asia-Pacific
- China
- Japan
- India
- Australia
- South Korea
- Rest of Asia-Pacific
- Middle East and Africa
- GCC
- South Africa
- Rest of Middle East and Africa
- South America
- Brazil
- Argentina
- Rest of South America
- North America
Data Sources, Market Sizing, and Validation
Desk Research
Desk research was used to set the market context, create a clean list of indicators, and anchor assumptions that later get tested in interviews. We referenced public sources such as the World Health Organization, the World Bank, the US CDC, OECD health statistics, and peer reviewed medical journals to understand disease burden, testing adoption, and lab capacity signals by region. We also reviewed regulatory and product standard references, along with annual reports, investor presentations, and reputed press coverage to track product launches and installed base direction.
To make the model more measurable, we added structured datasets from paid subscriptions that cover company financials and intelligence, news and financials, and patent databases so product pipelines and pricing moves could be sanity checked. Trade and shipment references were also consulted where available through an import or export shipment level database to sense cross border equipment movement. These sources are illustrative and not exhaustive, and many other public documents and datasets were used for data collection, cross checks, and clarification.
Primary Interviews and Surveys
Primary work focused on validating what is actually purchased and used in routine hematology workflows, and then testing assumptions on utilization, replacement cycles, and reagent pull through. We spoke with hospital laboratory staff, independent labs, distributors, and product specialists across APAC, EMEA, and the Americas so regional practice patterns and procurement constraints could be reflected. Where gaps remained, follow up questions were used to reconcile differences between public indicators and on ground experience before finalizing totals.
Distribution of primary research fieldwork respondents
| Company type | Respondent position | Region |
|---|---|---|
| Top tier: 27% | CXOs: 13% | APAC: 45% |
| Mid tier: 58% | Functional/Unit leaders: 40% | EMEA: 34% |
| Smaller Players: 15% | Managers: 47% | Americas: 21% |
Market-Sizing & Forecasting
The market was first reconstructed using a top-down approach where diagnostics demand pools were built from region level testing volumes and lab capacity indicators, which were then translated into value using typical price and mix assumptions for instruments and reagents. To keep the totals realistic, we corroborated the output with selective bottom-up approximations such as sampled average selling price (ASP) times unit shipments, distributor channel checks, and partial supplier revenue roll ups, and then adjusted where gaps were repeatedly flagged by interviews.
Key inputs used in the model included installed base and replacement cycles for analyzers, reagent consumption per test and the share of automated versus manual workflows, average tests per patient visit in key care settings, procurement cycles in hospital labs versus independent labs, and region level disease and screening signals that influence CBC and differential testing. For forecasting, scenario analysis was used first to translate adoption of automation, point of care expansion, and lab staffing constraints into growth paths, and then a light multivariate regression was applied as a cross check on the direction and pace. Where bottom-up inputs were missing for smaller countries, ratios were bridged from comparable markets using population and lab infrastructure proxies, followed by interview based validation.
Data Validation & Update Cycle
Validation was done through a stepwise set of checks so the final number does not depend on one dataset or one assumption. We compared model outputs with independent signals such as analyzer placement trends, reagent pull through logic, and healthcare diagnostic spend direction, and then investigated outliers that did not match what respondents described. Before sign-off, the model and key assumptions go through multi step analyst reviews, and follow up calls are triggered when a variable moves materially or a regional split looks inconsistent.
Reports are refreshed annually, and interim updates are made when major events materially affect demand, supply, or pricing. Right before delivery, a final pass is completed so the latest public releases and confirmed interview feedback are reflected in the published view.
Mordor Intelligence's Global Hematology Market Market Size Measured Against Other Published Estimates
Published hematology market values often do not match, even when the titles look similar, because the included product set and the timing of the base year can change the total quite a lot. Differences also come from how ASP increases are handled, whether utilization is assumed to rebound quickly, and how much of the value chain is counted.
Therapeutic hematology drugs sit outside Mordor Intelligence's scope here, and that single inclusion choice can materially raise totals on pages that blend diagnostics with treatment revenue. Other gaps usually come from grouping coagulation and broader clinical chemistry into one bucket, using aggressive penetration assumptions for point of care testing, or applying currency conversions using different average year rates and refresh dates.
Benchmark comparison
| Source | Market Size | Gaps in Research Methodology |
|---|---|---|
| Mordor Intelligence | USD 5.22 B (2026) | |
| Global Consultancy A | USD 9.87 B (2024) | Often presented as a wider hematology umbrella that can combine multiple lab categories and broader applications, and the earlier base year can also embed a different pricing level and utilization point. |
| Industry Research Desk B | USD 10.54 B (2024) | The scope is commonly expanded to include therapy and services linked to blood disorders, which inflates the value pool versus a diagnostics and testing focused definition, and growth math may lean on condition prevalence without matching to test volumes. |
The table shows that the spread is mostly explained by what gets counted, and by which year is used as the starting point for pricing and utilization. By keeping the scope tied to measurable testing products and then cross checking the model with practical demand indicators, our estimate stays easier to reproduce and audit across regions.


Key Questions Answered in the Report
What is the projected value of the hematology market by 2031?
The hematology market is estimated to reach USD 6.71 billion by 2031.
Which region is expected to grow fastest through 2031?
Asia-Pacific is forecast to post an 11.4% CAGR, the highest among all regions.
Which product category leads current revenues?
Analyzers account for 37.09% of global sales, the largest share among products.
Which application is expanding most rapidly?
Genetic and rare-disorder testing is projected to grow at a 14.9% CAGR.
How large is the hospital laboratory segment?
Hospitals held 52.63% of 2025 spending, retaining top end-user status.
What is a major supply-chain risk for reagents?
Heavy dependence on porcine-sourced heparin poses potential disruption risks.
Page last updated on:


