
Bio-polylactic Acid (PLA) Market Size and Share
Market Overview
| Study Period | 2021 - 2031 |
|---|---|
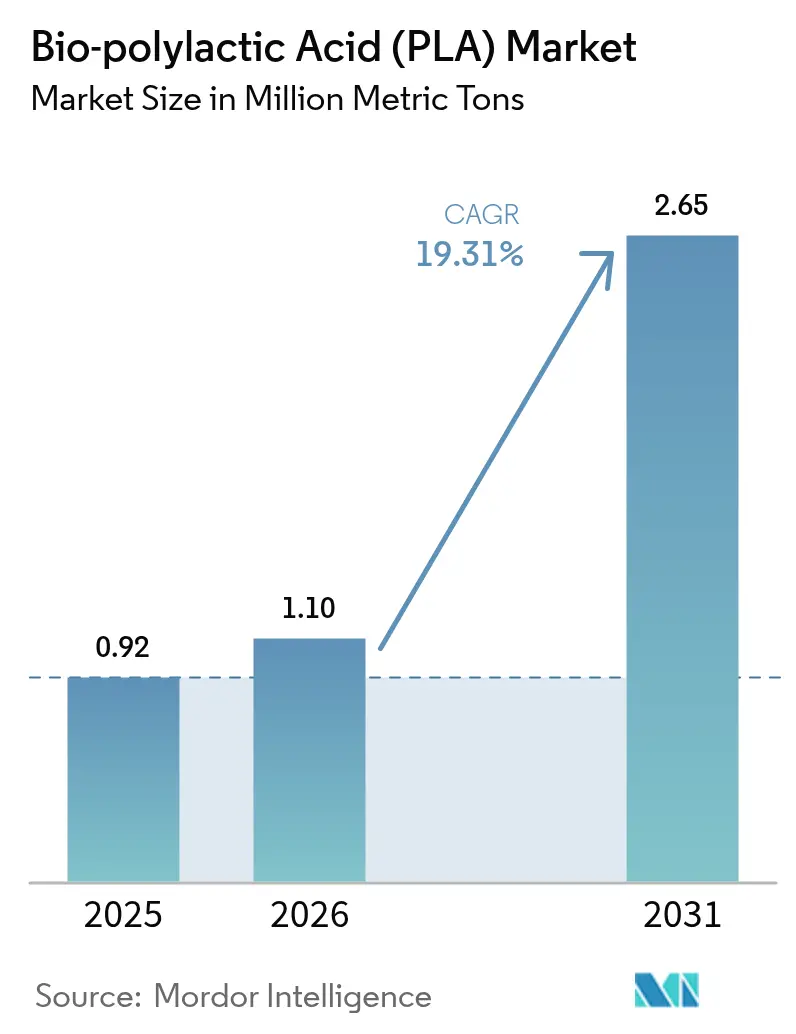
| Market Volume (2026) | 1.10 Million metric tons |
| Market Volume (2031) | 2.65 Million metric tons |
| Growth Rate (2026 - 2031) | 19.31 % |
| Fastest Growing Market | Asia Pacific |
| Largest Market | Asia Pacific |
| Market Concentration | Medium |
Major Players *Disclaimer: Major Players sorted in no particular order Image © Mordor Intelligence. Reuse requires attribution under CC BY 4.0. | |
Bio-polylactic Acid (PLA) Market Analysis by Mordor Intelligence
The Bio-polylactic Acid Market size is expected to increase from 0.92 million metric tons in 2025 to 1.10 million metric tons in 2026 and reach 2.65 million metric tons by 2031, growing at a CAGR of 19.31% over 2026-2031. Cheaper lactic-acid feedstock from new Chinese capacity shaved 18-22% off conversion costs between 2024 and 2025, allowing PLA thermoformed trays to undercut polypropylene without carbon subsidies. Vertical integration is accelerating: Balrampur Chini Mills is commissioning a USD 342 million cane-to-PLA complex in Uttar Pradesh in October 2026, a model that bypasses merchant lactic-acid markets and monetizes bagasse-based power exports. Regulatory momentum continues after Japan formally placed PLA on its Positive List for food-contact plastics on 1 June 2025, removing a key compliance barrier for meal-kit converters. Asian producers are scaling aggressively; projects led by Anhui Fengyuan and Huitong JV will add more than 650,000 t/y of PLA by 2028, reinforcing cost leadership and global oversupply cycles.
Key Report Takeaways
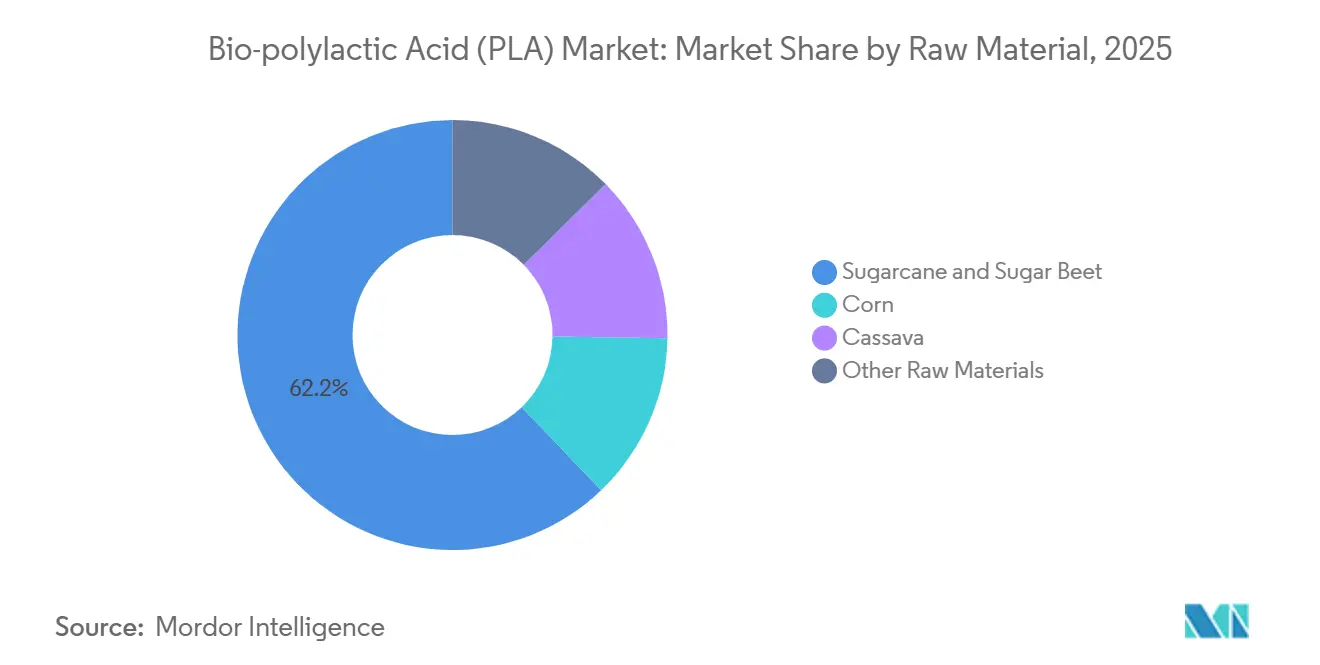
- By raw material, sugarcane and sugar beet held 62.15% of the Bio-polylactic Acid market share in 2025, and the segment is projected to accelerate at a 19.98% CAGR during the forecast period (2026-2031).
- By form, films and sheets accounted for 84.13% of the Bio-polylactic Acid market size in 2025 and are advancing at a 19.82% CAGR during the forecast period (2026-2031).
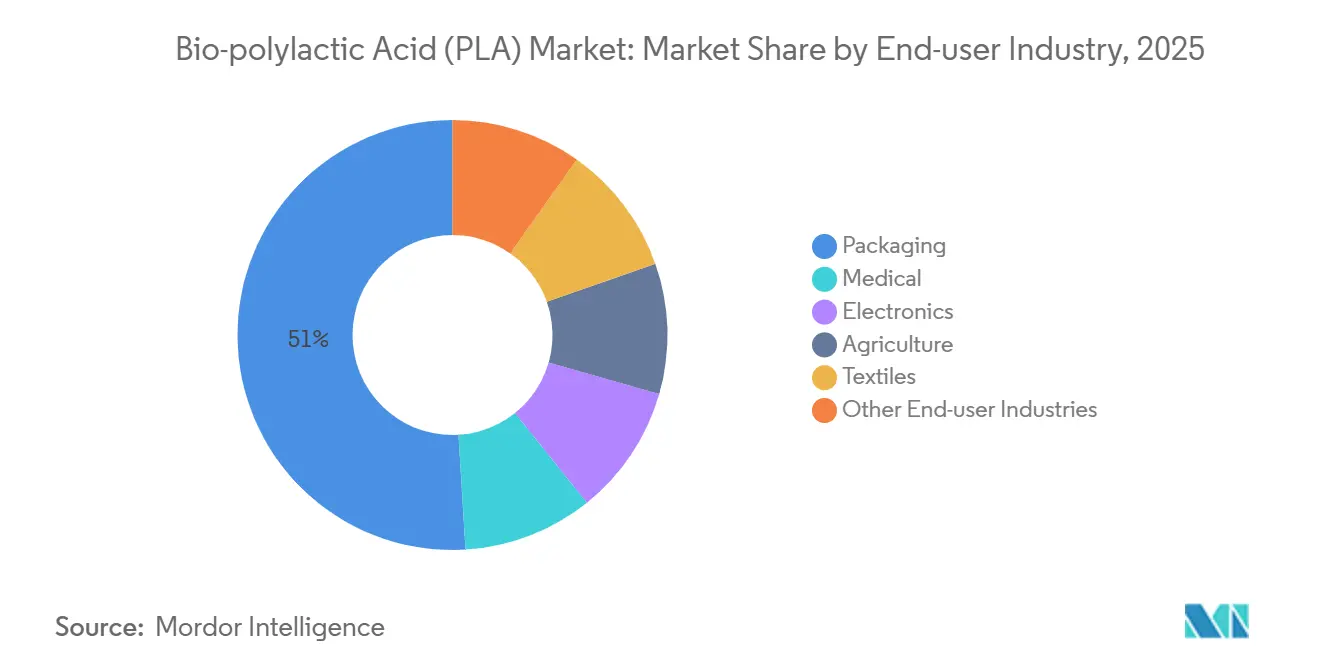
- By end-user industry, packaging captured 50.96% revenue share of the Bio-polylactic Acid market in 2025, and is forecast to expand at a 21.68% CAGR during the forecast period (2026-2031).
- By geography, Asia-Pacific led with 40.55% Bio-polylactic Acid market share in 2025, and the region exhibits the fastest growth trajectory at 22.17% CAGR during the forecast period (2026-2031).
Note: Market size and forecast figures in this report are generated using Mordor Intelligence’s proprietary estimation framework, updated with the latest available data and insights as of 2026.
Global Bio-polylactic Acid (PLA) Market Trends and Insights
Drivers Impact Analysis*
| Driver | ( ~ ) % Impact on CAGR Forecast | Geographic Relevance | Impact Timeline |
|---|---|---|---|
| Chinese capacity surge lowering PLA production cost | +4.2% | APAC core; spill-over to North America & Europe | Medium term (2-4 years) |
| E-commerce meal-kit boom driving demand for compostable films | +3.8% | North America & EU; emerging urban APAC | Short term (≤ 2 years) |
| Closed-loop PLA chemical-recycling pilots gaining EU and Japan traction | +2.1% | EU (France, Belgium), Japan | Long term (≥ 4 years) |
| High-heat PLA adoption in automotive interior composites | +1.6% | Global, led by Germany, US, Japan | Medium term (2-4 years) |
| PLA-based 3D-printing filaments enabling decentralized spare-parts production | +1.4% | Global, concentrated in North America & EU | Medium term (2-4 years) |
| Source: Mordor Intelligence | |||


Chinese Capacity Surge Lowering PLA Production Cost
Integrated lactic-acid and PLA parks in Jiangsu reduced delivered resin costs by 18-22% between 2024 and 2025, positioning China-made PLA below polypropylene for thermoformed trays. Lianhong Xinke’s 140,000 t/y complex reached near-USD 1,350 t cash costs in 2025. Logistics savings of 8-12% arise when converters co-locate compounding and film extrusion in the same industrial zone. Western brand owners now dual-source resin, blending imports with domestic grades to hedge tariff risk while arbitraging periodic oversupply. Chinese producers increasingly certify to ISO 14855 for EU market access, signaling a pivot from volume selling to compliance-oriented exports.
E-commerce Meal-Kit Boom Driving Demand for Compostable Films
Municipal bans covering 120-plus North American and European cities pushed meal-kit firms to specify certified-compostable PLA overwraps in 2025. Earthfirst Films logged a 340% YoY spike in PLA-coated board demand[1]Earthfirst Films, “2025 Mid-Year Sustainability Update,” earthfirstfilms.com . Israeli converter TIPA raised USD 43 million in March 2025 to scale a 25,000 t/y pouch line, betting that the PLA film premium over polyethylene will narrow to 15% by end-2026. Submissions to the Biodegradable Products Institute rose 60% in 2025, signaling broader brand adoption. Infrastructure remains a constraint; industrial composting coverage still averages only 12% of the US population, threatening the circular narrative unless permitting accelerates.
Closed-Loop PLA Chemical-Recycling Pilots Gaining EU and Japan Traction
Carbios processed 2,500 t of post-consumer PLA bottles in 2025, hitting 99.5% lactide purity suitable for direct polymerization[2]Carbios, “Annual Report 2025,” carbios.com. L’Oréal signed to offtake 2,000 t/y from 2027 at a 12-15% premium, framing recycled PLA as a branded material rather than a cost play. Japan’s METI earmarked USD 21 million in 2025 subsidies for PLA depolymerization pilots led by Mitsubishi Chemical and Toray. Patent lock-up persists; Carbios controls more than 40 enzyme patent families, with licensing fees of 3-5% of resin revenue, a hurdle for small recyclers. EU recycled-content mandates at 10% by 2030 establish long-term pull despite IP frictions.
High-Heat PLA Adoption in Automotive Interior Composites
OEMs validated high-heat PLA grades for door panels and consoles in 2025 as part of weight-reduction and bio-content strategies under the EU End-of-Life Vehicles Directive. Fiber-reinforced PLA composites reached 115-120°C heat-deflection temperatures while reducing part weight by up to 12% versus polypropylene-glass systems. NatureWorks’ nucleated Ingeo 3D870 eliminated annealing ovens, trimming USD 0.20 per part. Adoption is earliest in premium EV models, where buyers accept modest price uplifts for sustainability attributes. Compliance hurdles around flammability and VOC emissions were cleared without halogenated additives, satisfying ISO 3795 and VDA 278 limits.
Restraints Impact Analysis*
| Restraint | ( ~ ) % Impact on CAGR Forecast | Geographic Relevance | Impact Timeline |
|---|---|---|---|
| Insufficient industrial composting capacity in most regions | -2.9% | Global; acute in North America & APAC ex-Japan | Short term (≤ 2 years) |
| Concentrated IP around enzymatic PLA depolymerization raises costs | -1.7% | Global; acute EU & North America | Long term (≥ 4 years) |
| Limited food-contact approvals for non-GMO feedstocks in key markets | -1.2% | North America; selective EU states | Medium term (2-4 years) |
| Source: Mordor Intelligence | |||
Insufficient Industrial Composting Capacity in Most Regions
Only 185 US sites accepted compostable plastics in 2025, covering 12% of the population, and tipping fees ran 20-30% above standard organics due to extended 90-120 day PLA degradation cycles. Cedar Grove spent an extra USD 15-18 t managing dedicated PLA windrows in 2025. EU coverage reached 45-50% but operators still complain of contamination and longer retention times, prompting some to ban PLA film loads outright. California’s SB 1383 requires statewide organics diversion, yet many haulers exclude compostable plastics, forcing PLA food-service ware into landfills despite brand claims. Brand owners now test mechanically recyclable PLA grades that mimic PET optical properties, but MRF sortation remains unreliable, risking bale contamination penalties.
Concentrated IP Around Enzymatic PLA Depolymerization Raises Costs
Carbios’ enzyme portfolio blocks rivals until early 2030s, and licensing adds USD 50-75 t to recycled resin economics. Solvolysis work-arounds need high-pressure reactors costing USD 80-100 million for 20,000 t/y versus USD 50-60 million for enzymatic systems, limiting merchant investment. Equity tie-ups, L’Oréal and Patagonia both invested in Carbios, secure offtake but excluding smaller brands lacking capital, creating a two-tier market for recycled. Japan’s NEDO is funding non-infringing enzyme variants, but commercial rollout is unlikely before 2028.
*Our forecasts treat driver/restraint impacts as directional, not additive. The impact forecasts reflect baseline growth, mix effects, and variable interactions.
Segment Analysis
By Raw Material: Sugarcane Dominance Driven by Integrated Mill Economics
Sugarcane- and beet-based grades captured 62.15% of 2025 tonnage and are projected to expand at 19.98% CAGR during the forecast period 2026-2031, consolidating their lead in the Bio-polylactic Acid (PLA) market. Early 2026 commissioning of Balrampur’s 80,000 t/y complex will anchor domestic Indian demand while exporting surplus resin to Southeast Asia at sub-USD 1,550 t. Corn routes remain competitive only at NatureWorks’ Blair site, but face rising feedstock prices tied to ethanol blending targets. Cassava input provides a non-GMO premium in Thailand; Total Corbion’s 100,000 t/y Rayong expansion coming online H2 2026 will widen regional supply.
Operational flexibility across crushing, fermentation, and combined-heat-and-power units lets sugar mills monetize power exports and CO₂ capture, lowering net cost per tonne and shielding against raw-sugar price swings. Stakeholders increasingly demand EN 16785 certificates to substantiate bio-based carbon claims, prompting mills to install isotope-ratio mass spectrometry labs onsite. Residue-based PLA pilots under EU Horizon funding may reach demo scale in 2028, but volumes stay below 5% through 2031 due to heterogeneous sugar streams.


By Form: Films and Sheets Propelled by Packaging Mandates
Films and sheets held 84.13% of 2025 tonnage and will grow at 19.82% through 2031 as regional bans on EPS clamshells and multilayer polyolefin films tighten. Chipotle and Panera Bread transitioned salad bowls to PLA in 2025, displacing 4,300 t of polystyrene annually. Blown-film demand benefited from slip-agent optimization, enabling PLA to run on legacy LDPE lines with minimal die swap downtime. Cortec’s water-based dispersion lets paper cup converters cut solvent recovery, sparking 11 new installations in 2025.
Rigid injection molding and 3D-printing forms together remain under 5% of volume but grow from a low base. High-melt-strength chain extenders unlock deep-draw thermoforming for meat trays, adding 150 kt of incremental demand by 2031.
By End-User Industry: Packaging Leads with Fastest Growth
Packaging absorbed 50.96% of 2025 demand and is on track for a 21.68% CAGR during the forecast period 2026-2031, making it the prime growth engine for the Bio-polylactic Acid (PLA) market size. Meal-kit pouch volumes grew 28% in 2025, helped by TIPA’s expansion, while BPI issued 47 new certificates, mostly for single-serve beverage lids and produce bags. A significant amount of Clearances for resorbable screws expanded indications to mid-foot fusion in 2025. Electronics housings still face flammability upgrade costs to meet UL 94 V-0, suppressing broader uptake. Agriculture mulch films grow steadily, where labor savings offset the 15% price premium over LDPE; Brazilian sugar-cane growers reported USD 65 ha reductions in post-harvest retrieval in 2025.
Geography Analysis
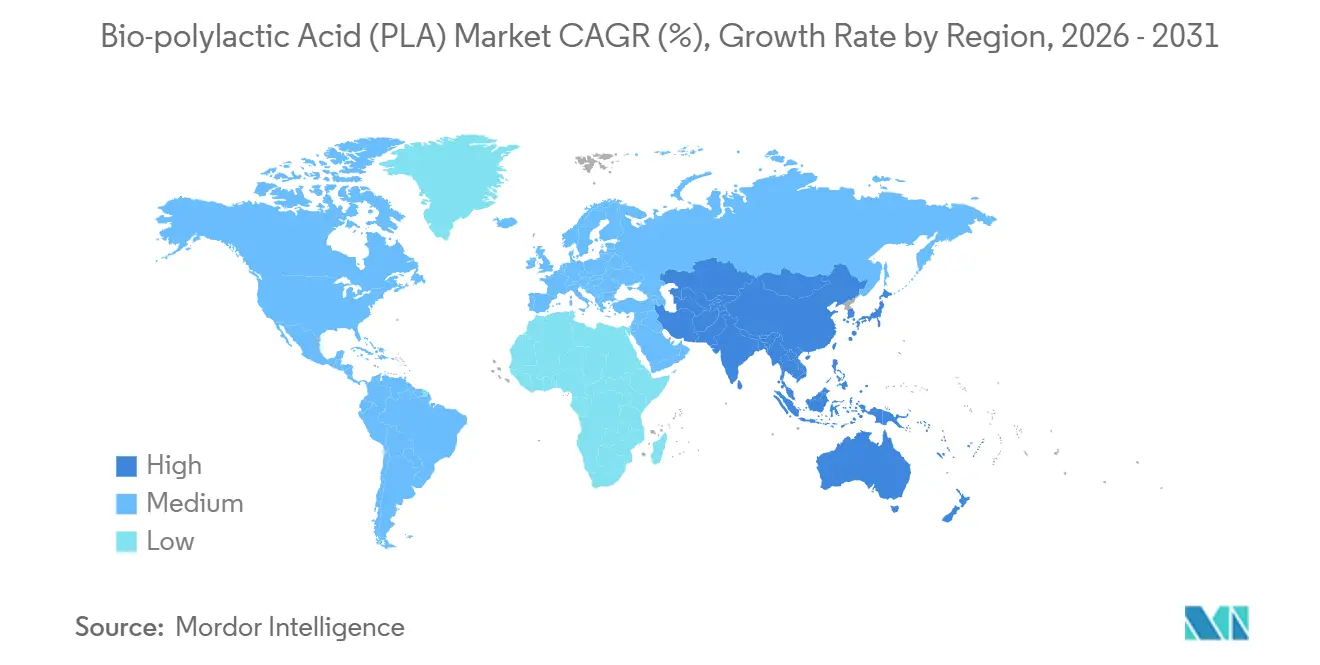
Asia-Pacific contributed 40.55% of global 2025 volumes and will pace the Bio-polylactic Acid (PLA) market at 22.17% CAGR. Chinese complexes scheduled for 2027-2028 start-ups extend regional capacity past 1 Mt/y, comfortably exceeding domestic rigid-packaging demand. India’s Balrampur startup brings the first fully integrated cane-to-PLA chain outside China, meeting domestic quick-commerce packaging growth of 19% in 2025. Japan’s Positive List cleared compliance hurdles, stimulating local converters to swap petroleum PS trays with PLA; YoY growth hit 23% in 2025.
In North America, NatureWorks’ Blair debottleneck to 225 kt y by late 2027 coincides with inconsistent implementation of SB 1383, leaving capacity partially exposed to export swings. Canada’s phased single-use ban filters in exemptions for certified-compostable resins, accelerating adoption among national QSR chains. Mexican imports hit 12 kt in 2025 as food processors align with US retailer eco-labels.
In Europe, the Packaging and Packaging Waste Regulation fixes a 10% recycled-content quota by 2030, pressing converters to sign multiyear take-or-pay deals with Carbios and future enzyme licensors. Germany’s composters invested in windrow upgrades to manage a rise from 5% to 8% PLA share in organic-waste streams during 2025. France’s AGEC law boosted PLA tableware demand 42% YoY in 2025. In South America and MEA, Braskem’s feasibility review for a 50 kt Brazilian sugarcane PLA line represents the region’s first credible capacity.

Value Chain Analysis
The PLA value chain starts with carbohydrate feedstocks (sugarcane/sugar beet, corn, cassava, and wheat) that are milled or hydrolyzed into fermentable sugars, followed by lactic acid fermentation and purification, lactide formation, and polymerization into PLA resin. Because lactic acid can represent up to about 60% of conversion cost, producers are increasingly integrating upstream into fermentation and utilities (combined heat and power, CO2 handling) and downstream into compounding, films, and specialty formats such as molded foams. Examples include integrated supply-chain positioning by NatureWorks (Ingeo) and TotalEnergies Corbion (Luminy PLA), and technology offerings that package end-to-end PLA production, including a 2025 partnership between thyssenkrupp Uhde and Praj Industries.
Distribution and conversion are dominated by resin-to-compound routes (additives, chain extenders, nucleating agents, plasticizers), followed by converting into films/sheets and thermoformed packaging. Certification and testing support cross-border sales, with producers aligning to compostability standards such as ISO 14855 and downstream market seals such as BPI and TÜV. Downstream partnerships also shape go-to-market progress, including TotalEnergies Corbion collaborations for compounds (with Benvic, 2025) and for expanded PLA molded foam commercialization (with Useon, 2025), which helps PLA move into higher-value applications like automotive, electronics, and lightweight packaging. The end-of-life loop remains a structural constraint, as industrial composting acceptance and retention-time requirements can raise costs and limit realized circularity, while enzymatic depolymerization and other chemical-recycling routes are still being piloted but face IP and capex hurdles, affecting where recycled PLA can scale through the study period.
Competitive Landscape
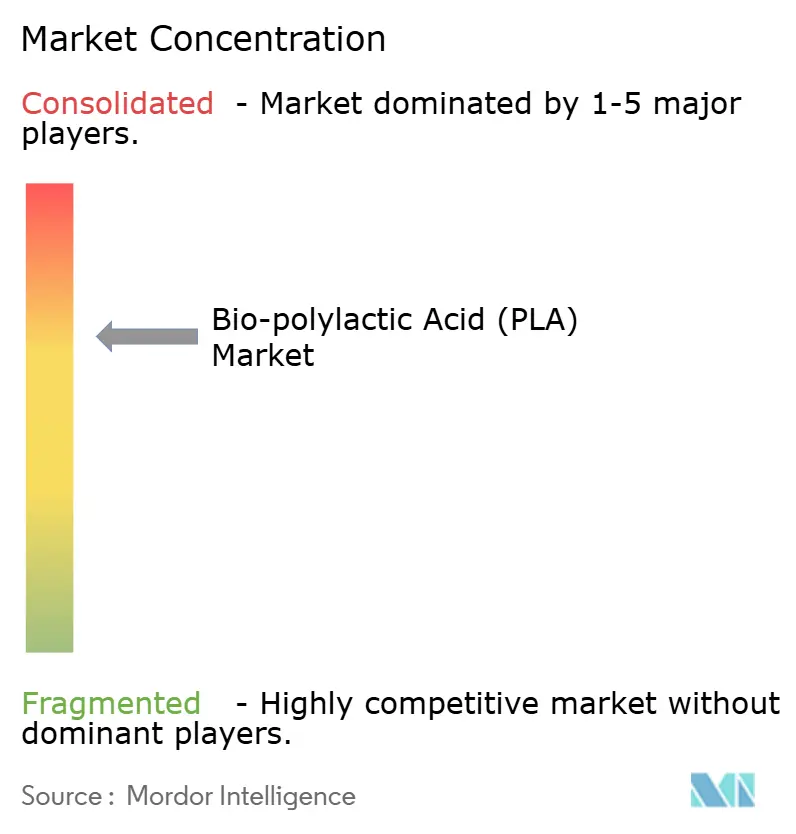
The Bio-polylactic Acid (PLA) market is moderately consolidated. NatureWorks’ North American focus provides tariff-hedged supply for domestic QSR chains, while Total Corbion’s Thai hub feeds European demand requiring TÜV and BPI seals. Chinese entrants ride low-cost corn or cassava and sell spot cargoes that can land in Los Angeles USD 200 t below U.S. domestic quotes even after duty. Strategically, players are integrating upstream into lactic acid, which represents up to 60% of conversion cost, and downstream into film extrusion.
Bio-polylactic Acid (PLA) Industry Leaders
Futerro
Jiangxi Keyuan Bio-Material Co. Ltd
NatureWorks LLC
TotalEnergies
Zhejiang Hisun Biomaterials Co., Ltd.
- *Disclaimer: Major Players sorted in no particular order

Market Opportunities and Future Outlook
A whitespace is forming around regionally integrated, feedstock-to-resin supply chains that reduce delivered-cost volatility and shorten lead times for packaging converters. NatureWorks opened a fully integrated Ingeo facility in Nakhon Sawan, Thailand in April 2026 with 75,000 tonnes per year of capacity, a commissioning milestone that brings incremental supply closer to Asian converting hubs and supports dual-sourcing strategies among brand owners. In India, Balrampur Chini Mills is advancing its cane-to-PLA buildout, and the report context around 2026 funding actions and project progress points to continued momentum toward domestic substitution and exports into nearby Southeast Asian markets.
A second opportunity area is expanding performance and applications beyond conventional compostable packaging, where compounding and new product formats can create margin headroom even when resin supply runs ahead of demand. TotalEnergies Corbion has been commercializing application extensions such as molded foams, including a sugarcane-based, lower-carbon PLA foam introduced in 2026, and compounds developed with partners like Benvic (2025) for higher-heat and durable-use cases such as automotive interiors, electronics housings, and specialty packaging. Circularity-linked demand pull continues to be shaped by visible pilots and policy direction: Carbios demonstrated enzyme-recycled PLA output in 2025, and EU recycled-content requirements for packaging offer a defined offtake pathway for converters that can secure certified recycled PLA streams. Japan METI-backed pilots also reinforce ongoing technology development for depolymerization alongside compostability infrastructure gaps.
Recent Industry Developments
- July 2026: TotalEnergies Corbion introduced a sugarcane-based, lower-carbon PLA foam offering to broaden the Luminy PLA portfolio into lightweight, molded applications. The offering targets performance niches where foams can replace fossil-based alternatives while keeping a compostable, bio-based positioning, and it supports converters seeking differentiated low-carbon packaging formats.
- April 2026: NatureWorks held the grand opening for its fully integrated Ingeo biopolymer manufacturing facility in Nakhon Sawan, Thailand, adding 75,000 metric tons per year of capacity. Commissioning an integrated site strengthens feedstock-to-resin control and improves supply optionality for Asian and export customers, while also increasing competitive pressure on delivered PLA pricing in key import markets.
- December 2025: Futerro officially submitted permit applications for its future European biorefinery project in Saint-Jean-de-Folleville, France. Advancing the permitting package supports a localized European PLA supply-chain concept that combines polymer production with circularity ambitions, and it provides a pathway for regional customers seeking shorter supply lines and compliance-oriented sourcing.


Research Methodology Framework and Report Scope
Market Definition and Coverage
This market covers bio-based polylactic acid (PLA) materials supplied as resins and converted forms, measured by total volume consumed across key end uses and regions during the study period.
Scope exclusions: We do not count other biopolymers that are not PLA, and we do not treat finished packaged goods value as part of PLA market sizing.
Segmentation Overview
- By Raw Material
- Corn
- Cassava
- Sugarcane and Sugar Beet
- Other Raw Materials
- By Form
- Fiber
- Films and Sheets
- Coatings
- Other Forms
- By End-user Industry
- Packaging
- Medical
- Electronics
- Agriculture
- Textiles
- Other End-user Industries
- By Geography
- Asia-Pacific
- China
- India
- Japan
- South Korea
- Rest of Asia-Pacific
- North America
- United States
- Canada
- Mexico
- Europe
- Germany
- United Kingdom
- Italy
- France
- Benelux
- Austria
- Czech Republic and Slovakia
- Poland
- Hungary
- Switzerland
- Nordic
- Rest of Europe
- South America
- Brazil
- Argentina
- Rest of South America
- Middle-East and Africa
- Saudi Arabia
- South Africa
- Rest of Middle-East and Africa
- Asia-Pacific
Data Sources, Market Sizing, and Validation
Desk Research
To start the sizing work, we compile PLA supply and demand fundamentals using public references that can be checked, then we align them into one consistent dataset. Sources typically include trade and customs statistics, government manufacturing and price indices, trade association publications on bioplastics and compostability, peer reviewed papers on PLA properties and processing yields, and patent databases to track technology direction.
We also review company filings, investor presentations, earnings transcripts, and reliable industry news to understand capacity additions, plant startups, and product positioning across applications like packaging films, rigid packaging, fibers, and medical use. For cross checks, we selectively use paid subscriptions focused on company financials and intelligence, news and financials, patent analytics, and shipment-level import and export data where it helps verify trade flows. The desk research sources listed here are illustrative only, and many other public references were also used for data collection, clarification, and validation.
Primary Interviews and Surveys
Primary work was used to pressure-test desk assumptions and to fill gaps that are not visible in public datasets, especially on grade mix, conversion yields, and realistic price bands by region. We spoke with a mix of PLA producers, compounders, converters, and large end users across APAC, EMEA, and the Americas, then we re-contacted selected experts when large variances showed up in early model runs.
Distribution of primary research fieldwork respondents
| Company type | Respondent position | Region |
|---|---|---|
| Top tier: 36% | CXOs: 15% | APAC: 42% |
| Mid tier: 45% | Functional/Unit leaders: 26% | EMEA: 33% |
| Smaller Players: 19% | Managers: 59% | Americas: 25% |
Market-Sizing & Forecasting
Our core model starts from a top-down demand pool, where polymer consumption is reconstructed by end-use applications using conversion ratios (for example, resin-to-film and resin-to-fiber yields), adoption rates in target products, and regional manufacturing and trade signals. We then corroborate those totals with selective bottom-up approximations, such as checking announced capacities, using operating rate ranges shared by interviewees, and applying plausible average selling price bands to implied volumes. This sequence helps flag over-counting in early drafts.
For PLA, the inputs that carry the most weight are nameplate capacity additions and startup timing, regional trade flows of PLA resin and key feedstock derivatives, packaging substitution pace linked to regulations and brand commitments, industrial composting and collection availability signals, and the spread between PLA and conventional polymer pricing that drives switching behavior. For forecasting, we run scenario analysis with a base case anchored in expert consensus on capacity ramp-ups and packaging adoption, then apply upside and downside cases to operating rates and price progression. When bottom-up visibility is weak for smaller converters, we use application-level intensity factors and regional split logic validated in interviews, rather than forcing a full supplier roll-up.
Data Validation & Update Cycle
After the first model run, we check outputs against independent signals such as announced plant volumes, import and export movements, and region-level application growth indicators, then we review outliers in a second analyst pass. Any large variance triggers follow-up questions to respondents so assumptions like utilization, yield, and pricing are corrected before final sign-off.
Reports are refreshed annually, and interim updates are made when material events occur, for example major capacity changes, policy shifts on single-use plastics, or sharp feedstock-driven price moves. Before delivery, we complete a final review so the latest developments are reflected in the market numbers and narrative.
Mordor Intelligence's Bio Polylactic Acid Pla Market Size Measured Against Other Published Estimates
Published PLA market numbers often do not match because firms do not measure the same thing, and the unit of measurement is not always consistent. Differences usually come from whether the estimate is built in tons versus USD, how conversion and application mixes are treated, and how current pricing and capacity ramps are refreshed.
Some published figures lean on revenue models that can fold in broader bioplastics value, include compounded blends, or assume an aggressive price curve across all regions, even when product mix is shifting. Many gaps also show up when currency timing and price-year conventions are not stated, or when capacity additions are assumed to be fully utilized soon after startup, which tends to inflate near-term totals.
Benchmark comparison
| Source | Market Size | Gaps in Research Methodology |
|---|---|---|
| Mordor Intelligence | USD 1.10 M (2026) | |
| Global Consultancy A | USD 1.90 B (2025) | Values the market in USD and typically uses blended ASP assumptions and broader revenue capture, which can pull in compounded materials and non-resin value that is not equal to pure PLA volume. |
| Regional Consultancy B | USD 1.17 B (2024) | Uses a base-year revenue point and a slower growth curve, and it is less explicit about plant ramp timing and conversion yields, which can understate volume growth but still report a higher USD value if ASP bands are set above market-clearing levels. |
The spread is mainly explained by unit choice and scope around what is being monetized, and then by how fast capacity is assumed to turn into sellable volumes. Some sources report a broader revenue view around PLA-related sales, then Mordor Intelligence counts PLA in volume terms and ties it back to application demand and realistic operating rates before converting to comparable benchmarks.


Key Questions Answered in the Report
How much PLA will the world consume by 2031?
Global demand is forecast at 2.65 million tons by 2031, up from 1.10 million tons in 2026.
Which region is adding the most new PLA capacity?
Asia-Pacific, led by China, will add more than 650,000 t/y of new capacity between 2026 and 2028.
Why is sugarcane emerging as the main PLA feedstock?
Integrated cane mills monetize sugar, power, CO₂ and PLA, driving costs to USD 1,450-1,550 t versus USD 1,700-1,850 t for corn routes.
What slows the adoption of compostable PLA packaging?
Only about 12% of the U.S. population has access to industrial composting that accepts PLA, so most packaging still goes to landfill.
Are recycled PLA resins commercially available?
Yes, Carbios supplies 2,500 t/y of enzyme-recycled PLA at a 12-15% premium, with larger plants expected after 2027.
Page last updated on:


 Your data is secure and never sold or shared.


