Bio-Based Polyvinyl Chloride Market Size and Share
Market Overview
| Study Period | 2021 - 2031 |
|---|---|
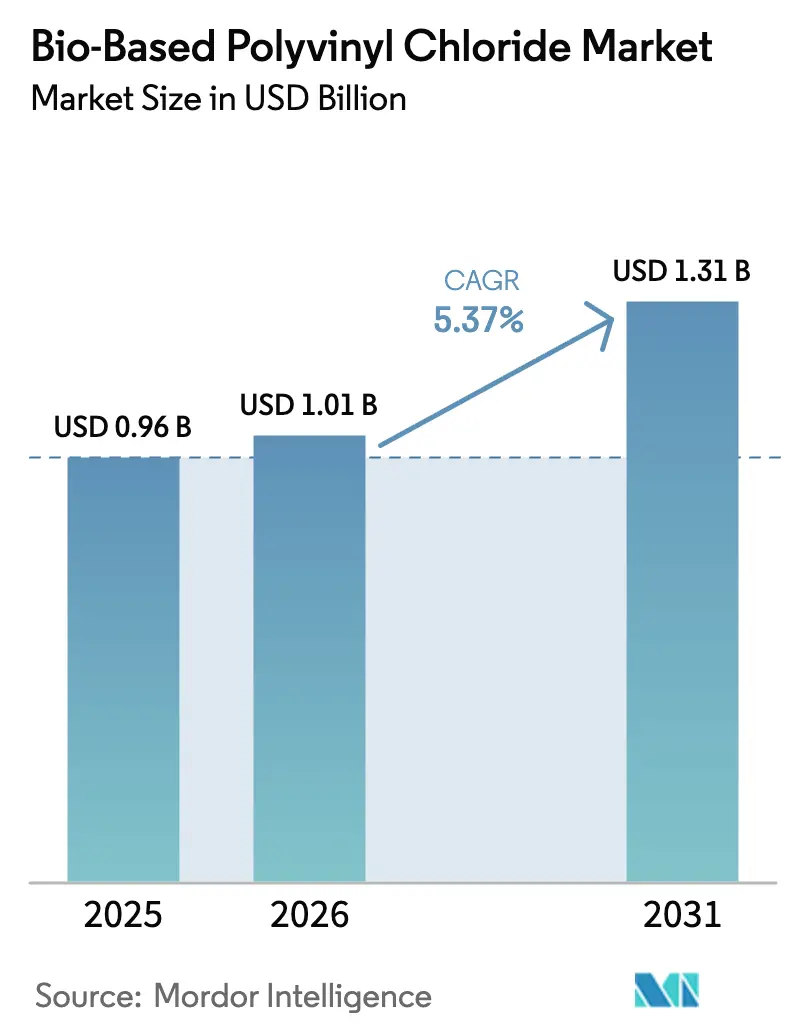
| Market Size (2026) | USD 1.01 Billion |
| Market Size (2031) | USD 1.31 Billion |
| Growth Rate (2026 - 2031) | 5.37% CAGR |
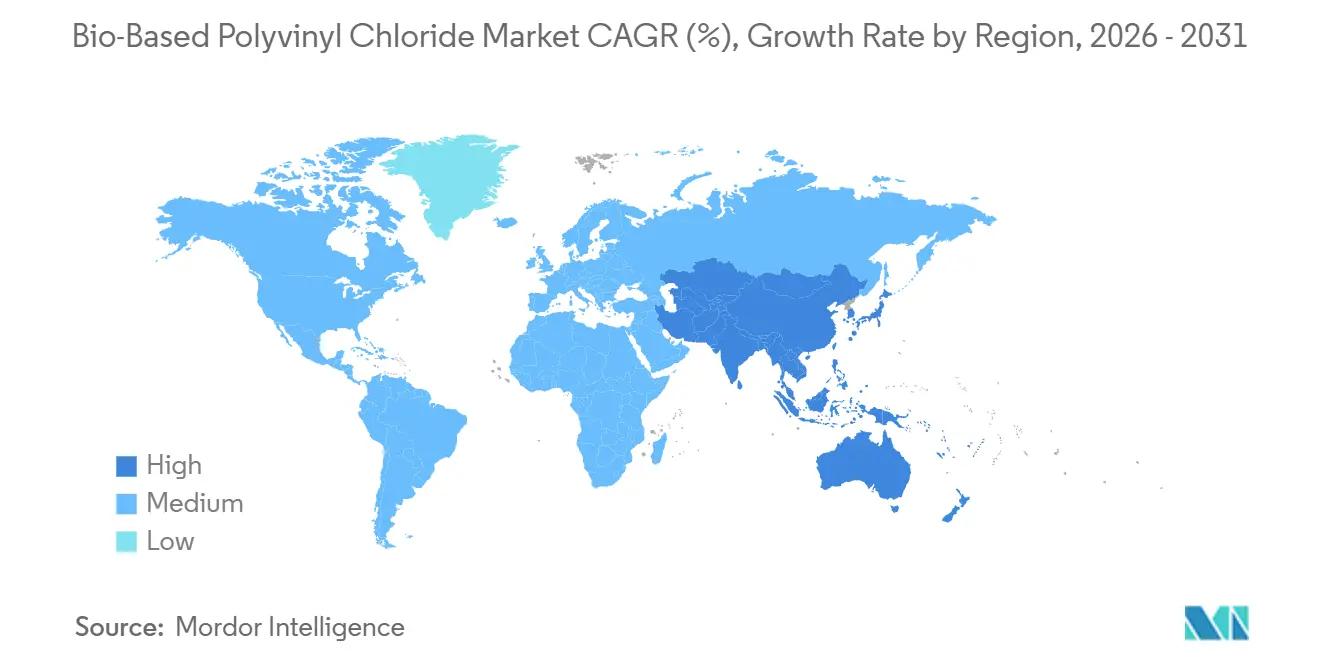
| Fastest Growing Market | Asia Pacific |
| Largest Market | Europe |
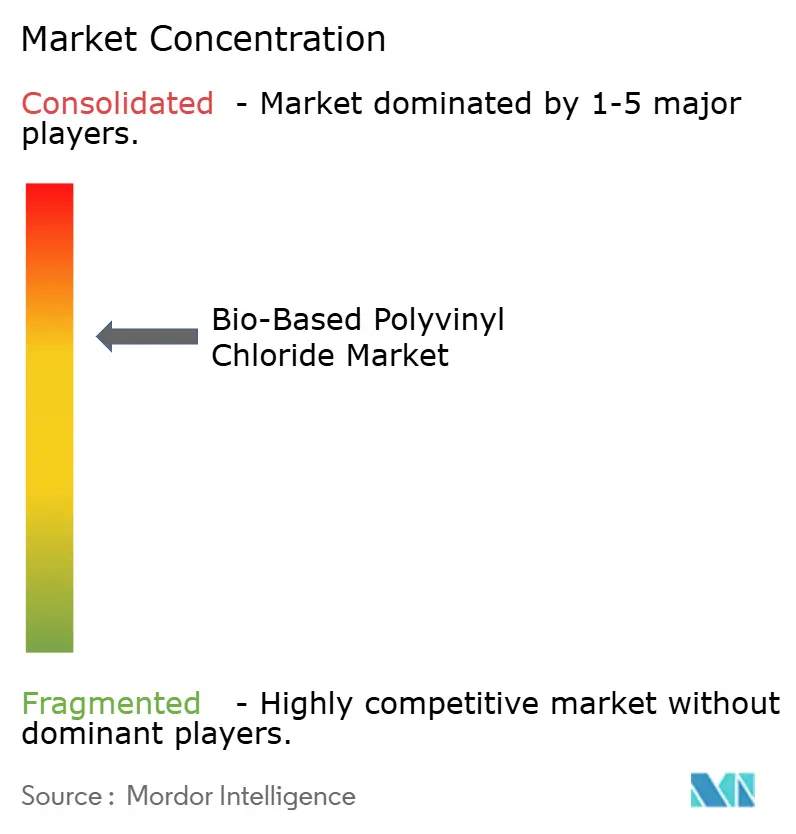
| Market Concentration | Medium |
Major Players *Disclaimer: Major Players sorted in no particular order Image © Mordor Intelligence. Reuse requires attribution under CC BY 4.0. | |
Bio-Based Polyvinyl Chloride Market Analysis by Mordor Intelligence
The Bio-Based Polyvinyl Chloride Market size is expected to grow from USD 0.96 billion in 2025 to USD 1.01 billion in 2026 and is forecast to reach USD 1.31 billion by 2031 at 5.37% CAGR over 2026-2031. Europe anchors 48.22% of 2025 revenue, helped by carbon-border rules that penalize coal-based PVC imports and reward certified low-carbon feedstocks. Asia-Pacific follows in absolute share yet leads growth at a 5.94% CAGR through 2031, spurred by China’s coal-to-bio-ethylene pilots and India’s sugarcane-ethanol surplus redirected from fuel blending. Rigid bio-PVC accounted for 62.48% of 2025 volume because potable-water pipe standards favor dimensional stability, while flexible grades are set for a 5.88% CAGR as automotive OEMs adopt bio-attributed compounds in interior panels to cut scope-3 emissions. Competitive intensity remains moderate; fewer producers run commercial-scale bio-ethylene-to-VCM chains, and most rely on mass-balance accounting that still faces traceability scrutiny in regulated markets.
Key Report Takeaways
- By product type, rigid variants led with a 62.48% bio-based polyvinyl chloride market share in 2025. Flexible grades are forecast to post the fastest 5.88% CAGR between 2026 and 2031.
- By application, pipes commanded 36.27% of the bio-based polyvinyl chloride market size in 2025. Wires and cables are advancing at a 5.93% CAGR through 2031.
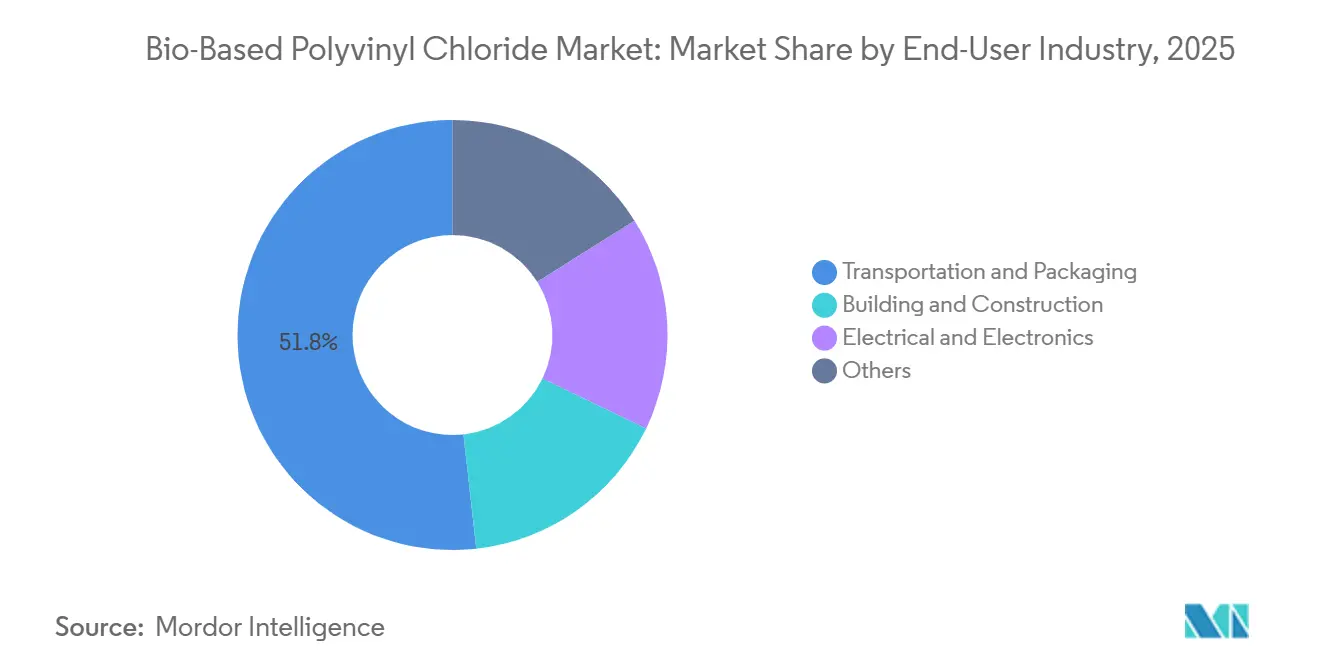
- By end-user, transportation and packaging captured a 51.77% share in 2025. The same segment is also the fastest growing, expanding at a 5.91% CAGR to 2031.
- By geography, Europe held 48.22% of the market in 2025; Asia-Pacific is predicted to grow at a 5.94% CAGR to 2031.
Note: Market size and forecast figures in this report are generated using Mordor Intelligence’s proprietary estimation framework, updated with the latest available data and insights as of January 2026.
Global Bio-Based Polyvinyl Chloride Market Trends and Insights
Drivers Impact Analysis*
| Drivers | (~) % Impact on CAGR Forecast | Geographic Relevance | Impact Timeline |
|---|---|---|---|
| Stricter environmental regulations and ESG mandates | +1.8% | Europe, North America, APAC core markets | Medium term (2-4 years) |
| Corporate sustainability commitments and green-building standards | +1.2% | Global, with concentration in EU and North America | Medium term (2-4 years) |
| Cost-competitive bio-ethylene routes reaching commercial scale | +1.4% | South America (Brazil), Asia-Pacific (India, China) | Long term (≥ 4 years) |
| EU carbon-border adjustments accelerating low-carbon feedstock use | +0.9% | Europe, spill-over to exporters in ASEAN and Middle East | Short term (≤ 2 years) |
| Mass-balance flooring/pipe supply deals catalyzing downstream uptake | +0.6% | Europe, North America | Short term (≤ 2 years) |
| Source: Mordor Intelligence | |||
Stricter Environmental Regulations And ESG Mandates
The EU Carbon Border Adjustment Mechanism entered its transitional phase in late 2023 and will apply full embedded-carbon tariffs from 2026, making high-carbon PVC imports costlier by 2028 [1]European Commission, “Carbon Border Adjustment Mechanism,” taxation-customs.ec.europa.eu. California’s SB 253 and SB 261 require scope-3 disclosures from 2024, pushing building and automotive buyers to audit polymer origins. Teknor Apex noted in 2025 a growth of European flooring customers demanding bio-attributed compounds verified for carbon footprint. These converging rules tilt procurement toward certified bio-PVC despite its price premium. Producers able to document chain-of-custody compliance earn preferred-supplier status in regulated tenders.
Corporate Sustainability Commitments And Green-Building Standards
LEED v5, fully rolling out in 2026, grants extra points for ISO 16620-verified bio-based content, putting bio-PVC on specification lists for projects targeting Gold or Platinum ratings [2]U.S. Green Building Council, “LEED v5 Beta,” usgbc.org . The EPA’s 2025 update of Product Category Rules for resilient flooring mandates life-cycle assessments that reveal feedstock origin, effectively disadvantaging fossil resin in public procurement. Automaker scorecards reinforce the pull: Volkswagen assigns a portion of its supplier ratings to bio-based or recycled polymers. Meanwhile, Ford mandates the use of certified bio-PVC in its North American models by 2028. Such targets provide resin suppliers with the volume certainty essential for retrofitting crackers to process bio-feedstocks.
Cost-Competitive Bio-Ethylene Routes Reaching Commercial Scale
In 2025, Braskem's sugarcane-ethanol-to-ethylene facility in Brazil operated at high capacity, as oil prices stabilized, helping to narrow cost gaps. India's updated biofuel policy now permits surplus ethanol to transition from fuel applications to chemical uses. In late 2025, Praj inaugurated a demonstration plant in Gujarat. Cemvita Factory successfully reduced its CO₂-to-ethylene production costs, a significant drop from two years prior. This trajectory suggests the potential for grid parity by 2029, contingent on the continuation of the United States tax credits. With bio-ethylene nearing price parity, the feedstock premium that's been a barrier to the wider adoption of bio-PVC is poised to diminish.
EU Carbon-Border Adjustments Accelerating Low-Carbon Feedstock Use
China's carbide route for producing PVC releases significantly more CO₂ compared to certified bio-PVC. This difference allows importers to sidestep CBAM levies entirely. INEOS's NEOVYN bio-attributed resin not only meets compliance standards but also boasts a reduced carbon footprint. This advantage provides European converters with both cost savings and enhanced reputation. Responding to these shifts, Middle Eastern producers are taking note. For instance, SABIC has announced plans to incorporate bio-naphtha blends at its Jubail cracker by 2026. Such strategic moves underscore how the CBAM is driving changes in upstream feedstock sourcing, extending its influence well beyond the borders of the EU.
Restraints Impact Analysis*
| Restraints | (~) % Impact on CAGR Forecast | Geographic Relevance | Impact Timeline |
|---|---|---|---|
| High production-cost gap vs. fossil PVC | -1.1% | Global, most acute in price-sensitive ASEAN and MEA markets | Medium term (2-4 years) |
| Limited commercial-scale renewable-feedstock supply | -0.8% | Global, with bottlenecks in Europe and North America | Long term (≥ 4 years) |
| Traceability issues in mixed bio-attributed recycling streams | -0.4% | Europe, North America | Short term (≤ 2 years) |
| Source: Mordor Intelligence | |||
High Production-Cost Gap Versus Fossil PVC
Bio-ethanol commands a higher price than naphtha-based ethylene, resulting in a resin premium before accounting for capital charges related to cracker retrofits. In Brazil and India, fuel-blending mandates consume the majority of ethanol volumes, leaving limited surplus for chemical applications. Buyers in the price-sensitive packaging and construction sectors hesitate to pay the premium unless carbon penalties bridge the difference. In 2025, LyondellBasell reported that while bio-attributed polyolefins achieved a premium in Europe, they faced challenges in Southeast Asia, where fossil resins are priced lower.
Limited Commercial-Scale Renewable-Feedstock Supply
In 2025, global bio-ethylene production accounted for a small fraction of the total ethylene output, with a significant portion directed towards polyethylene rather than PVC. Dow's 2025 sustainability report highlighted the challenges of renewable-feedstock scarcity, pointing out that qualifying additional certified bio-naphtha could take a considerable amount of time. Establishing new fermentation plants demands substantial capital and competes for agricultural land, and there's a risk of catalyst fouling when co-processing bio-naphtha. This constrained supply hampers producers' ability to rapidly scale bio-PVC output, even as demand continues to surge.
*Our forecasts treat driver/restraint impacts as directional, not additive. The impact forecasts reflect baseline growth, mix effects, and variable interactions.
Segment Analysis
By Product Type: Rigid Grades Dominate While Flexibles Accelerate
Rigid variants controlled 62.48% of 2025 volume, reflecting the need for 50-year service lives in potable-water pipes and window profiles. This dominance underpins a substantial portion of the bio-based polyvinyl chloride market size, securing predictable offtake for resin suppliers. Flexible grades, forecast at a 5.88% CAGR, benefit from drop-in substitution in automotive interiors where scope-3 targets drive material choices.
Rigid compounds require minimal tooling changes when swapping fossil for bio-attributed resin, trimming adoption risk, and ensuring that the bio-based polyvinyl chloride market grows steadily within infrastructure projects. Flexible formulations depend on compatible plasticizers and careful migration testing; Teknor Apex launched a 40% bio-content flexible compound in 2025 to meet these performance demands. These advances show how formulation know-how, not polymer chemistry, sets the pace of segment uptake in the bio-based polyvinyl chloride industry.


By Application: Pipe Infrastructure Leads While Cables Surge
Pipes captured 36.27% of the 2025 demand, giving the segment the largest share of the bio-based polyvinyl chloride market size. Municipal water utilities in Europe favor low-carbon materials to meet reporting mandates, anchoring predictable demand. Wires and cables, projected at a 5.93% CAGR, ride renewable-energy grid build-outs that specify certified low-carbon insulation.
Films and sheets face longer regulatory cycles because FDA food-contact reviews can stretch 12–18 months. Nevertheless, the segment gains when premium brands integrate bio content to enhance sustainability claims. Cable producers see strategic upside from avoiding future carbon levies, boosting their confidence to lock in bio-attributed resin offtake agreements. These patterns keep application growth aligned with broader infrastructure and consumer-brand timelines inside the bio-based polyvinyl chloride market.
By End-User Industry: Transportation And Packaging Drive Scale
Transportation and packaging secured 51.77% of 2025 consumption and will grow at a 5.91% CAGR, establishing the segment as the principal revenue engine for the bio-based polyvinyl chloride market. Automakers can substitute bio-attributed PVC without retooling, directly lowering scope-3 footprints. Packaging converters deploy bio-films to meet brand owner scorecards that demand sustainable content by 2030.
Building and construction follow regulations such as LEED v5 and updated EPA rules, pushing flooring and profile makers toward certified content. Electrical and electronics gain momentum via data-center and EV-charging infrastructure, both of which specify low-carbon cabling. These usage patterns underline how compliance and brand visibility, rather than pure material performance, steer the bio-based polyvinyl chloride industry roadmap.

Geography Analysis
Europe claimed a 48.22% bio-based polyvinyl chloride market share in 2025, lifted by CBAM’s transitional reporting and mass-balance supply deals between INEOS, Vynova, and downstream fabricators. Germany, France, and Italy lead demand, while Sweden and Denmark test bio-PVC in district-heating pipes. Russia remains sidelined due to sanctions and carbide-route dependence that lacks bio-feedstock infrastructure.
Asia-Pacific is the fastest-growing region at a 5.94% CAGR through 2031. India diverts surplus sugarcane ethanol into chemical routes, and Praj’s Gujarat demo plant signals domestic feedstock readiness. China’s five-year plan opens pilot quotas for bio-ethanol co-processing, giving state-owned crackers a pathway to carbon-adjustment compliance. Japan and South Korea import certified bio-naphtha from Malaysia and Thailand for electronics and automotive customers.
North America, while holding a smaller market share, reaps significant benefits from the United States tax credits, reducing CO₂-to-ethylene costs. Dow faces feedstock constraints, highlighting supplier qualification timelines over production bottlenecks. In North America, Mexico aligns its operations with the United States OEM scorecards, and Brazil's ethanol-to-ethylene plant bolsters South America's supply. The Middle East remains in its infancy; however, SABIC's scheduled trial of bio-naphtha hints at budding demand, with potential for substantial capacity expansion if the trial proves successful.

Competitive Landscape
The bio-based polyvinyl chloride market is moderately consolidated. Incumbents rely on ISCC PLUS or RSB certification to translate mass-balance volumes into marketable claims. Chain-of-custody software and catalyst patents dominate recent filings, signaling that process efficiency and traceability outweigh new polymer chemistries. Competitive positioning now hinges on demonstrating third-party verified carbon reductions significant enough to sidestep CBAM or qualify for LEED points, granting suppliers a pricing umbrella in regulated markets.
Bio-Based Polyvinyl Chloride Industry Leaders
INEOS
Vynova Group
Westlake Vinnolit GmbH & Co. KG
Solvay SA
LG Chem
- *Disclaimer: Major Players sorted in no particular order

Recent Industry Developments
- November 2025: INEOS in 2025 reported a surge in NEOVYN PVC orders as customers sought its 37% lower carbon footprint to cut scope-3 emissions.
- July 2025: Vynova Group announced plans to cease PVC production at Beek, Netherlands, by November 2025 after reviewing European overcapacity and regulatory pressures.


Global Bio-Based Polyvinyl Chloride Market Report Scope
Bio-based polyvinyl chloride (Bio-PVC) emerges as a sustainable alternative to conventional PVC. By substituting fossil-fuel-derived ethylene with renewable, plant-based feedstocks—such as bioethanol or tall oil—in its production, Bio-PVC achieves the same performance, durability, and recyclability as its traditional counterpart. However, it boasts a significantly reduced carbon footprint, aligning with the goals of a more circular economy.
The bio-based polyvinyl chloride market is segmented by product type, application, end-user industry, and geography. By product type, the market is segmented into rigid Bio-PVC and flexible Bio-PVC. By application, the market is segmented into pipes, wires, cables, films and sheets, and others. By end-user industry, the market is segmented into building and construction, transportation and packaging, electrical and electronics, and others. The report also covers the market size and forecasts for the bio-based polyvinyl chloride market in 17 countries across major regions. For each segment, market sizing and forecasts have been done based on revenue (USD).
| Rigid Bio-PVC |
| Flexible Bio-PVC |
| Pipes |
| Wires |
| Cables |
| Films and Sheets |
| Others |
| Building and Construction |
| Transportation and Packaging |
| Electrical and Electronics |
| Others |
| Asia-Pacific | China |
| India | |
| Japan | |
| South Korea | |
| ASEAN Countries | |
| Rest of Asia-Pacific | |
| North America | United States |
| Canada | |
| Mexico | |
| Europe | Germany |
| United Kingdom | |
| France | |
| Italy | |
| Russia | |
| NORDIC Countries | |
| Rest of Europe | |
| South America | Brazil |
| Argentina | |
| Rest of South America | |
| Middle-East and Africa | Saudi-Arabia |
| South Africa | |
| Rest of Middle-East and Africa |
| By Product Type | Rigid Bio-PVC | |
| Flexible Bio-PVC | ||
| By Application | Pipes | |
| Wires | ||
| Cables | ||
| Films and Sheets | ||
| Others | ||
| By End-User Industry | Building and Construction | |
| Transportation and Packaging | ||
| Electrical and Electronics | ||
| Others | ||
| By Geography | Asia-Pacific | China |
| India | ||
| Japan | ||
| South Korea | ||
| ASEAN Countries | ||
| Rest of Asia-Pacific | ||
| North America | United States | |
| Canada | ||
| Mexico | ||
| Europe | Germany | |
| United Kingdom | ||
| France | ||
| Italy | ||
| Russia | ||
| NORDIC Countries | ||
| Rest of Europe | ||
| South America | Brazil | |
| Argentina | ||
| Rest of South America | ||
| Middle-East and Africa | Saudi-Arabia | |
| South Africa | ||
| Rest of Middle-East and Africa | ||


Key Questions Answered in the Report
What is the current global value of the bio-based polyvinyl chloride market?
The bio-based polyvinyl chloride market size was USD 1.01 billion in 2026 and is forecast to reach USD 1.31 billion by 2031.
Which region dominates demand for bio-based PVC?
Europe leads with 48.22% revenue share in 2025, supported by strict carbon-border rules and green-building standards.
Which segment grows the fastest through 2031?
Wires and cables are projected to expand at a 5.93% CAGR due to renewable-energy grid expansion.
Which certification schemes verify bio-attributed PVC claims?
ISCC PLUS and RSB are the leading chain-of-custody schemes accepted by regulators and major brand owners.
Page last updated on:


