Bio-plasticizers Market Size and Share
Market Overview
| Study Period | 2021 - 2031 |
|---|---|
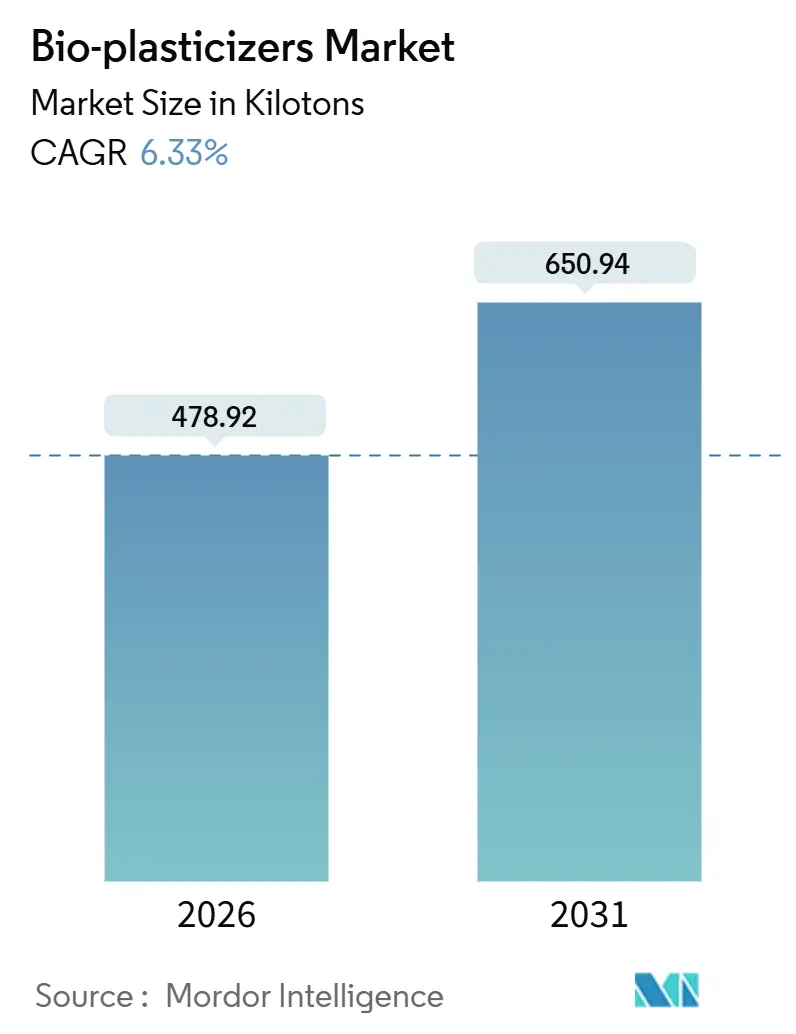
| Market Volume (2026) | 478.92 kilotons |
| Market Volume (2031) | 650.94 kilotons |
| Growth Rate (2026 - 2031) | 6.33% CAGR |
| Fastest Growing Market | Asia Pacific |
| Largest Market | Asia Pacific |
| Market Concentration | Medium |
Major Players *Disclaimer: Major Players sorted in no particular order Image © Mordor Intelligence. Reuse requires attribution under CC BY 4.0. | |
Bio-plasticizers Market Analysis by Mordor Intelligence
The Bio-plasticizers Market size is estimated at 478.92 kilotons in 2026, and is expected to reach 650.94 kilotons by 2031, at a CAGR of 6.33% during the forecast period (2026-2031). Demand is accelerating because wire-and-cable compounders in Asia-Pacific must meet halogen-free requirements, brand owners in Europe face bio-content mandates for packaging, and hospital networks worldwide are phasing out legacy phthalates. Competitive strategies center on backward integration into vegetable-oil feedstocks, investments in fermentation-derived acids, and rapid regulatory filings that shorten the qualification cycle for medical devices. Market opportunities include premium-priced medical tubing, high-heat automotive interiors that call for castor-oil or bio-succinic esters, and emerging lignin-based chemistries that valorize pulp-mill by-products. Supply risks are tied to soybean and palm-oil price swings, but producers are diversifying into itaconic acid, glycerol esters, and other non-food inputs to stabilize margins.
Key Report Takeaways
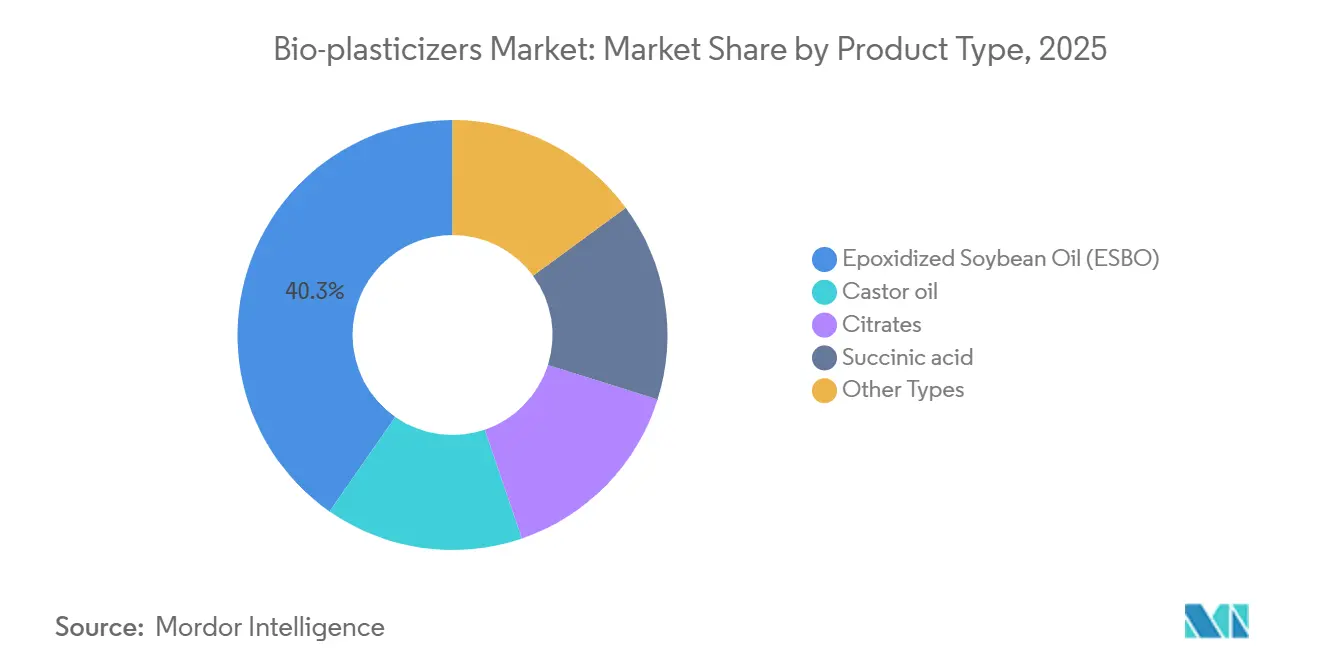
- By product type, epoxidized soybean oil led with 40.31% of the bio-plasticizers market share in 2025. The “Other Types” segment is forecast to grow at an 8.12% CAGR through 2031, the fastest within the category.
- By raw-material source, plant oils accounted for 50.22% of the bio-plasticizers market size in 2025. “Other Raw Material Sources” are projected to expand at a 7.59% CAGR between 2026 and 2031.
- By application, wire and cable insulation captured 30.91% of 2025 volume, while "Other Applications" are poised for a 7.12% CAGR to 2031.
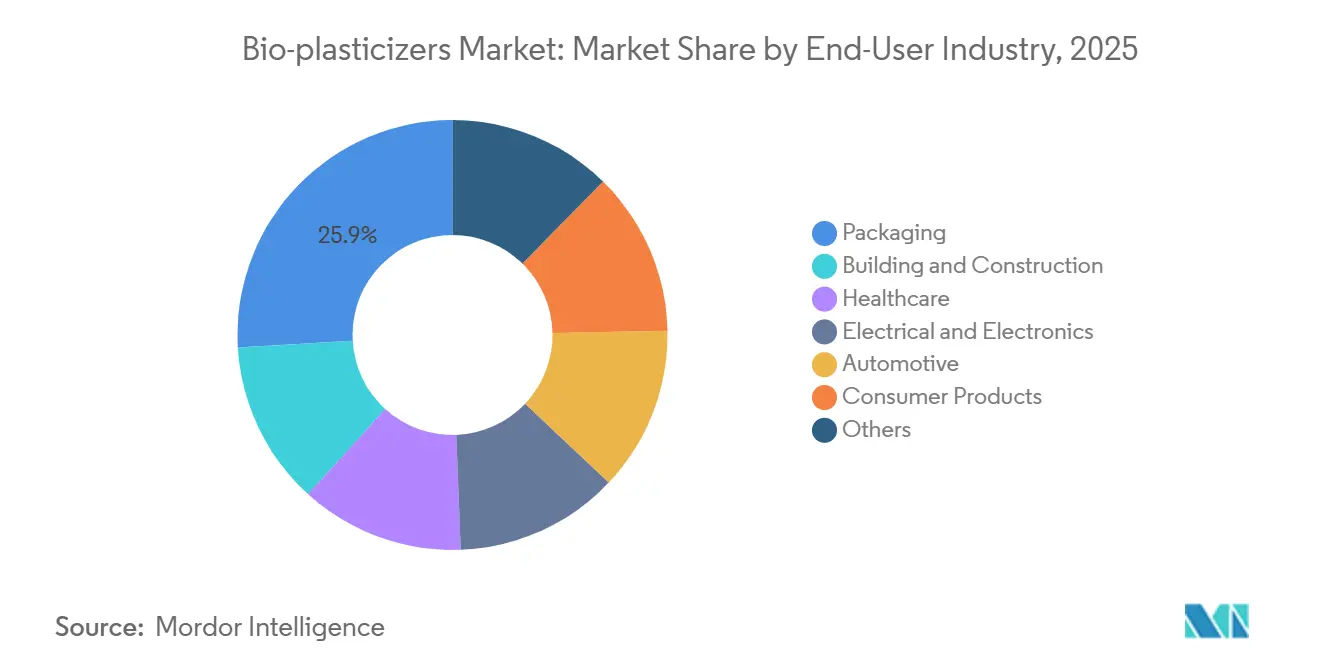
- By end-user industry, packaging held 25.93% of 2025 demand, yet automotive is set to register a 7.25% CAGR through 2031.
- By geography, Asia-Pacific controlled 35.22% of 2025 volume and is expected to post a 7.81% CAGR during the forecast period.
Note: Market size and forecast figures in this report are generated using Mordor Intelligence’s proprietary estimation framework, updated with the latest available data and insights as of January 2026.
Global Bio-plasticizers Market Trends and Insights
Drivers Impact Analysis*
| Drivers | (~) % Impact on CAGR Forecast | Geographic Relevance | Impact Timeline |
|---|---|---|---|
| Surging flexible-PVC demand from wire and cable insulation | +1.8% | Asia-Pacific core, spill-over to Middle East and Africa | Medium term (2-4 years) |
| Stringent phthalate regulations accelerating bio-options adoption | +2.1% | Global, early enforcement in North America and EU | Short term (≤ 2 years) |
| Rapid capacity additions of bio-refineries in Asia-Pacific | +1.3% | China, India, Southeast Asia | Long term (≥ 4 years) |
| Growth of the sustainable packaging industry | +1.5% | Europe and North America lead, Asia-Pacific following | Medium term (2-4 years) |
| OEM push for non-migratory plasticizers in medical tubing | +0.9% | North America and Europe, emerging in Japan | Short term (≤ 2 years) |
| Source: Mordor Intelligence | |||


Surging Flexible-PVC Demand from Wire and Cable Insulation
In 2025, wire and cable insulation accounted for a significant share of the bio-plasticizer volume, driven by Asia-Pacific utilities modernizing grids to adhere to low-smoke, halogen-free standards. India's National Infrastructure Pipeline mandates IEC 60502-compliant cables, bolstering demand for epoxidized soybean oil due to its epoxy groups that enhance flame retardancy. Projects in Southeast Asia come with bio-content disclosure clauses, showing a preference for citrates and ESBO. China's tender cycle has front-loaded demand annually, with Vietnam and Indonesia mirroring this grid-expansion strategy. Collectively, these developments provide a sustained growth trajectory for the bio-plasticizers market.
Stringent Phthalate Regulations Accelerating Bio-options Adoption
As regulators tighten exposure limits, phthalate bans are projected to boost the forecast CAGR. Starting in 2027, the U.S. EPA's ban on eight phthalates in consumer goods mandates the annual reformulation of flexible PVC. Meanwhile, the European Chemicals Agency has added four phthalates to the REACH Candidate List, leading retailers to insist on bio-content certification for their private-label products[1]European Chemicals Agency, “REACH Candidate List Updates,” echa.europa.eu . In California, Proposition 65 lawsuits have further accelerated the industry's shift towards citrate esters. Japan has set a limit on phthalate migration in food-contact films, effectively sidelining traditional plasticizers from supermarket packaging. These coordinated global actions not only eliminate established options but also create a swift market opportunity for bio-alternatives.
Rapid Capacity Additions of Bio-refineries in Asia-Pacific
Producers in Malaysia, Indonesia, and China are adding new capacity, effectively narrowing supply-demand gaps and reducing delivery costs. In Malaysia, IOI Corporation is expanding its capacity for glycerol esters. Emery Oleochemicals has set up a castor-oil epoxidation unit in Indonesia, targeting ISO 10993-certified medical devices. In a swift regulatory-driven move, Hebei Jingu in China has transitioned a petro-phthalate line to produce citrate. KLJ Group from India has teamed up with Cargill to establish an ESBO plant, capitalizing on discounted domestic soybean oil. These investments underpin Asia-Pacific’s 7.81% regional CAGR.
Growth of the Sustainable Packaging Industry
By 2030, the European Union's Packaging and Packaging Waste Regulation requires flexible films to contain bio-based content. In 2024, Mondi revamped its film lines, achieving a reduction in carbon footprints without compromising seal strength. Amcor transitioned its AmLite medical-device pouches to utilize bio-plasticizers, securing contracts with pharmaceutical firms navigating Scope 3 requirements. The USDA has certified new formulations under its BioPreferred program, directing federal purchases towards renewable content. These developments solidify packaging's role as a key growth driver for the bio-plasticizers market.
Restraints Impact Analysis*
| Restraints | (~) % Impact on CAGR Forecast | Geographic Relevance | Impact Timeline |
|---|---|---|---|
| Price volatility of vegetable oils | -1.2% | Global, acute in Asia-Pacific and South America | Short term (≤ 2 years) |
| Performance gap in high-temperature applications | -0.8% | North America and Europe automotive sectors | Medium term (2-4 years) |
| Limited global glycerol surplus after biodiesel blend-rate cuts | -0.6% | Europe and North America | Long term (≥ 4 years) |
| Source: Mordor Intelligence | |||
Price Volatility of Vegetable Oils
Soybean oil prices increased significantly from January 2024 to December 2025, driven by a drought in Argentina and Brazil's adoption of B15 biodiesel blends. Castor oil prices rose sharply after India restricted exports, putting pressure on formulators in Europe and North America. Palm oil prices experienced fluctuations due to changes in export levies by Indonesia, making glycerol esters more expensive. Small producers operating on short-term spot contracts faced margin compressions and passed on these increased costs, resulting in bio-alternatives being priced higher than phthalates. Unless there's an improvement in feedstock hedging, these cost surges are projected to impact the forecast CAGR negatively.
Performance Gap in High-temperature Applications
Above 120 °C, citrate esters volatilize, leading to stiffness in under-hood harnesses, as per SAE J1128 testing[2]SAE International, “J1128 Standard for Automotive Wire,” sae.org . ESBO-plasticized PVC experiences significant elongation loss at elevated temperatures compared to DINP. OEMs, including Volkswagen, adopt dual specifications: permitting bio-plasticizers in cabin wiring but mandating trimellitates for powertrain areas. The absence of bio-specific pass/fail criteria in IEC 60811-404 introduces certification ambiguity. This technical limitation slows rapid substitutions in high-heat zones and reduces growth.
*Our forecasts treat driver/restraint impacts as directional, not additive. The impact forecasts reflect baseline growth, mix effects, and variable interactions.
Segment Analysis
By Product Type: ESBO Dominance Masks Specialty-Chemistry Gains
Epoxidized soybean oil held 40.31% of the 2025 volume, demonstrating cost-performance leadership in flexible films. The bio-plasticizers market size for “Other Types” is set to accelerate at an 8.12% CAGR as succinic acid diesters and lignin-based compounds penetrate high-temperature automotive parts. Addressing OEM demands, BASF’s North American bio-succinic line produces plasticizers resilient up to 200 °C. Castor oil derivatives meet ISO 10993 biocompatibility standards for medical devices. While citrates lead in food-contact and pharmaceutical films, they grapple with procurement consolidation challenges in Europe. New chemistries, like itaconic acid—brought to market by Itaconix—boast antimicrobial properties, giving them a competitive advantage in healthcare packaging. Highlighting a shift from edible oils, venture capital is increasingly backing lignin-derived methods that utilize cost-negative pulp by-products.
Specialty firms, such as Matrica, are strategically co-locating bio-butanediol and succinic acid production to maximize intermediary margins. Fermentation leaders are producing dioctyl succinate, achieving the flexibility of adipate while reducing carbon footprints. Evonik’s VESTINOL range streamlines the qualification process for pharmaceutical clients. By combining epoxidized linseed oil with phosphite stabilizers, hybrid formulations achieve thermal stability exceeding 150 °C. Collectively, these advancements signal a shift towards performance-centric plasticizers, broadening the horizons of the bio-plasticizers market.


By Raw-Material Source: Feedstock Diversification Hedges Supply Risk
Plant oils held a 50.22% share in 2025, yet the bio-plasticizers market size derived from “Other Raw Material Sources” is forecast to grow at a 7.59% CAGR through 2031. Cargill's initiative with non-GMO soybean oil ensures a pharmaceutical-grade supply and secures premium margins. Citric and maleic anhydrides, playing dual roles as pH stabilizers in PVC, captured a significant share. Jungbunzlauer, solidifying its position, allocates a portion of its Swiss citric output to the plasticizer grade.
Glycerol esters grapple with a constrained feedstock as the EU RED-III caps crop-based biodiesel. This limitation curtails glycerol supply, leading to price increases. In response, Emery Oleochemicals has refined crude glycerol to a high purity for pharmaceutical applications. UPM is testing kraft lignin plasticizers, turning pulp waste into profit and avoiding the food-versus-fuel controversy. This strategic shift towards non-food inputs not only mitigates price shocks but also aligns with brand-owner demands for deforestation-free supply chains, enhancing resilience in the bio-plasticizers market.
By Application: Medical Devices and Automotive Interiors Outpace Legacy Segments
Wire and cable insulation commanded 30.91% of 2025 demand, yet "other applications" show the quickest rise with a 7.12% projected CAGR, supported by electric-vehicle build schedules. EU directives promoting bio-based content in single-use items are reshaping food and pharmaceutical packaging. In the U.S., LEED incentives are driving the adoption of bio-based materials in flooring, roofing, and wall coverings. While medical devices represent a smaller tonnage, they command a premium for citrate plasticizers, thereby enhancing profitability in the segment.
The consumer goods sector, spanning toys to footwear, grapples with stringent phthalate regulations. Automotive giants Tesla and BYD are now insisting on phthalate-free interiors, driving up the demand for ESBO–citrate blends. Meanwhile, sportswear titans Nike and Adidas have removed ortho-phthalates from their synthetic leather, spurring a surge in textile coatings. Such shifts in end-use applications are broadening the market's reach for bio-plasticizers.
By End-User Industry: Automotive Electrification Drives Fastest Growth
Packaging held a 25.93% slice in 2025, but automotive is expected to expand at 7.25% annually as electric-vehicle makers prioritize cabin air quality. Meanwhile, building and construction sectors are capitalizing on tax credits linked to bio-content. Healthcare, buoyed by FDA guidance prohibiting DEHP in neonatal care, retains a significant mid-teen market share. The electrical and electronics sector benefits from grid upgrades in the Asia-Pacific region. Although consumer products hold a smaller market share, they grapple with stringent deadlines, creating a strong demand for bio-alternatives.
Electric vehicle (EV) production is projected to grow significantly, highlighting the vast potential for phthalate-free vehicle interiors. Tesla has set a deadline in its supplier code for the adoption of bio-plasticizers, pushing Tier-1 suppliers to accelerate their compliance. Volkswagen has taken proactive steps, reformulating its interior parts and achieving a reduction in VOC emissions. Such directives from original equipment manufacturers (OEMs) not only underscore the importance of compliance for suppliers but also signal a steady growth trajectory for the bio-plasticizers market.
Geography Analysis
Asia-Pacific held 35.22% of the 2025 volume and is primed for a 7.81% CAGR, fueled by grid infrastructure and emerging packaging mandates. In China, ultra-high-voltage contracts mandate the use of flame-retardant PVC, specifically compatible with ESBO. India's ambitious infrastructure pipeline is leaning towards low-toxicity cables. Japan is incentivizing its manufacturers through Green Transformation subsidies, promoting the adoption of bio-based chemicals, and bolstering domestic compounders. South Korea's K-REACH registration is imposing restrictions on phthalate imports, creating a shift in demand towards local bio-alternatives. Meanwhile, Southeast Asia is channeling funding towards renewables, with an emphasis on bio-content clauses in their procurement processes.
In 2025, North America secured a notable share. With the EPA's phthalate ban set to take effect, the industry is bracing for significant reformulation. Canada's Chemicals Management Plan is closely aligned with U.S. timelines. In Mexico, automotive plants are turning to citrate compounds to ensure compliance with U.S. OEM specifications. Additionally, the USDA BioPreferred program is directing substantial federal spending towards certified plasticizers.
Europe managed to capture a notable share. The Packaging and Packaging Waste Regulation mandates a bio-content requirement for films. Germany's Umweltbundesamt is advocating for bio-plasticizer inclusion in construction products to qualify for subsidies. The UK, post-Brexit, is harmonizing its regulations with REACH, ensuring phthalate limits remain intact. France's AGEC law is taking a firm stance against single-use plastics, nudging converters towards ESBO, which seamlessly integrates into PVC recycling streams. In South America, local soybean oil is being harnessed for ESBO production, and Saudi Arabia's Vision 2030 infrastructure initiative is sparking a budding demand in the Middle East.


Competitive Landscape
The bio-plasticizers market is moderately fragmented. Cargill’s vertically integrated soybean supply insulates margins from price volatility. BASF offers ISCC PLUS-certified biomass-balanced grades that match performance but cut carbon intensity. Smaller entrants exploit white spaces such as roofing membranes or antimicrobial interior skins, leveraging technical services to guide ISO 10993 testing. Patent filings in 2024-2025 center on hybrid formulations that combine epoxidized linseed oil with phosphite stabilizers, enabling thermal stability above 150 °C. OEM procurement policies, notably Tesla’s phthalate-free interior mandate, create captive channels and raise the switching cost for suppliers.
Bio-plasticizers Industry Leaders
BASF SE
Cargill, Incorporated.
Evonik Industries AG
Avient Corporation
Perstorp
- *Disclaimer: Major Players sorted in no particular order

Recent Industry Developments
- February 2025: BASF expanded its sustainable North American plasticizer range with ISCC PLUS certified biomass-balanced and Ccycled grades, including Palatinol DOTP Advantage 50 and Palatinol DOTP Ccycled, providing performance equivalence to conventional products while lowering carbon intensity.
- March 2024: Baerlocher has initiated the distribution of Innoleics' portfolio of non-phthalate bio-plasticizers in the United States. This development is anticipated to strengthen the bio-plasticizers market by driving demand for sustainable and non-phthalate alternatives.


Research Methodology Framework and Report Scope
Market Definitions and Key Coverage
Our study defines the bio-plasticizers market as all renewable-origin additives, such as epoxidized soybean oil, castor-oil products, citrates, and succinic-acid derivatives, blended into polymers to improve flexibility, predominantly in PVC compounds used across packaging, wire & cable, flooring, and automotive interior parts.
Scope Exclusion: Petroleum-derived and other non-renewable plasticizers are outside this assessment.
Segmentation Overview
- By Product Type
- Epoxidized Soybean Oil (ESBO)
- Castor oil
- Citrates
- Succinic acid
- Other Types (Itaconic acid, etc.)
- By Raw-Material Source
- Plant Oils
- Organic Acids and Anhydrides
- Glycerol Esters
- Others (Lignin-based Compounds, etc.)
- By Application
- Wire and Cable
- Film and Sheet
- Flooring, Roofing and Wall-covering
- Medical Devices
- Consumer Goods
- Other Applications (Automotive Interior Parts, etc.)
- By End-User Industry
- Packaging
- Building and Construction
- Healthcare
- Electrical and Electronics
- Automotive
- Consumer Products
- Others (Textile, Footwear, etc.)
- By Geography
- Asia-Pacific
- China
- India
- Japan
- South Korea
- Rest of Asia-Pacific
- North America
- United States
- Canada
- Mexico
- Europe
- Germany
- United Kingdom
- France
- Italy
- Rest of Europe
- South America
- Brazil
- Argentina
- Rest of South America
- Middle-East and Africa
- Saudi Arabia
- South Africa
- Rest of Middle-East and Africa
- Asia-Pacific
Detailed Research Methodology and Data Validation
Primary Research
Mordor analysts interviewed compounders, additive formulators, and PVC processors across North America, Europe, and Asia Pacific. Discussions verified substitution rates versus phthalate products, average dosage levels, and emerging end-use tests (for example, biodegradable cling films). Follow-up surveys with procurement managers provided price-band checkpoints and outlook sentiment that sharpened model assumptions.
Desk Research
We began with public domain datasets issued by agencies such as the United States Environmental Protection Agency, Eurostat's Prodcom series, and China's National Bureau of Statistics, which together clarify regulatory triggers and production volumes. Trade flows from UN Comtrade and customs dashboards expose import-export balances for key feedstocks, such as soybean oil and citrate esters. Industry associations, including the European Plastics Converters and the Vinyl Institute, provide application-level penetration hints, while company filings and investor decks supply average selling prices. Where finer detail is required, analysts tap licensed resources like D&B Hoovers for manufacturer revenues and Dow Jones Factiva for transaction news. The sources cited here are illustrative; many additional references underpin our dataset assembly.
Market-Sizing & Forecasting
A blended top-down build begins with polymer production and trade statistics, which are then adjusted by region-specific bio-plasticizer penetration rates, average loading percentages, and recovery factors to arrive at demand in kilotons. Supplier roll-ups and sampled price × volume checks offer a bottom-up sense-check before totals are finalized. Key variables tracked include national PVC output, phthalate substitution mandates, soybean-oil price spreads, building & construction activity indices, and medical-device tubing demand shifts. Five-year forecasts leverage multivariate regression, anchoring future volumes to GDP, construction spending, and price elasticities surfaced in primary work. Scenario analysis stresses the model for rapid regulatory tightenings. Data gaps in small geographies are bridged via proxy ratios drawn from adjacent markets with similar consumption patterns.
Data Validation & Update Cycle
Outputs pass a three-layer review: peer analyst audit, senior consultant sign-off, and automated variance checks against external trade and producer filings. We refresh every twelve months; interim updates trigger when feedstock price shocks, new regional bans, or capacity additions alter underlying assumptions. A final pre-publication sweep assures clients receive the latest calibrated view.
Why Our Bio Plasticizers Baseline Commands Reliability
Published estimates often diverge because firms report in different units, fold in broader eco-friendly additives, or assume uniform adoption speeds.
Key gap drivers include varied inclusion of non-PVC applications, inconsistent average selling price ladders, and refresh cadences that overlook recent capacity ramps in Asia. Mordor's discipline, linking bio-plasticizer demand directly to verified polymer output and substitution ratios, produces a defensible midpoint rather than an aggressive or conservative extreme.
Benchmark comparison
| Market Size | Anonymized source | Primary gap driver |
|---|---|---|
| 474.27 kilotons | Mordor Intelligence | - |
| USD 1.49 billion (2024) | Global Consultancy A | Uses headline revenue, mixes bio-based with broader eco-friendly plasticizers, limited regional split |
| USD 3.22 billion (2024) | Industry Association B | Assumes universal price premium, omits small-scale Asia manufacturers, older 2023 base |
| USD 1.68 billion (2024) | Trade Journal C | Applies flat 6% growth to historic demand, no primary validation of substitution rates |
In sum, the Mordor approach anchors demand to measurable production drivers, validates critical ratios with on-ground experts, and revisits the numbers on a predictable cycle, giving decision-makers a transparent, balanced baseline they can trace and replicate.


Key Questions Answered in the Report
How large is the bio-plasticizers market today?
The bio-plasticizers market size reached 478.92 kilotons in 2026 and is forecast to approach 650.94 kilotons by 2031.
What is the growth rate of bio-based plasticizers?
The market is expected to register a 6.33% CAGR between 2026 and 2031, driven by phthalate bans and infrastructure investments.
Which region leads demand for bio-plasticizers?
Asia-Pacific accounted for 35.22% of the 2025 volume and is on track for the fastest regional CAGR of 7.81% through 2031.
Which application consumes the most bio-plasticizers?
Wire and cable insulation led with 30.91% of the 2025 demand due to halogen-free requirements in new grid projects.
Why are automotive interiors important for growth?
Electric-vehicle OEMs such as Tesla mandate phthalate-free cabins, propelling automotive interior demand at a 7.25% CAGR to 2031.
Page last updated on:


