
Market Overview
| Study Period | 2020 - 2031 |
|---|---|
| Market Size (2026) | USD 19.87 Billion |
| Market Size (2031) | USD 22.18 Billion |
| Growth Rate (2026 - 2031) | 2.22 % |
| Fastest Growing Market | Asia Pacific |
| Largest Market | Asia-Pacific |
| Market Concentration | Medium |
Major Players *Disclaimer: Major Players sorted in no particular order Image © Mordor Intelligence. Reuse requires attribution under CC BY 4.0. | |
Biguanides Market Analysis by Mordor Intelligence
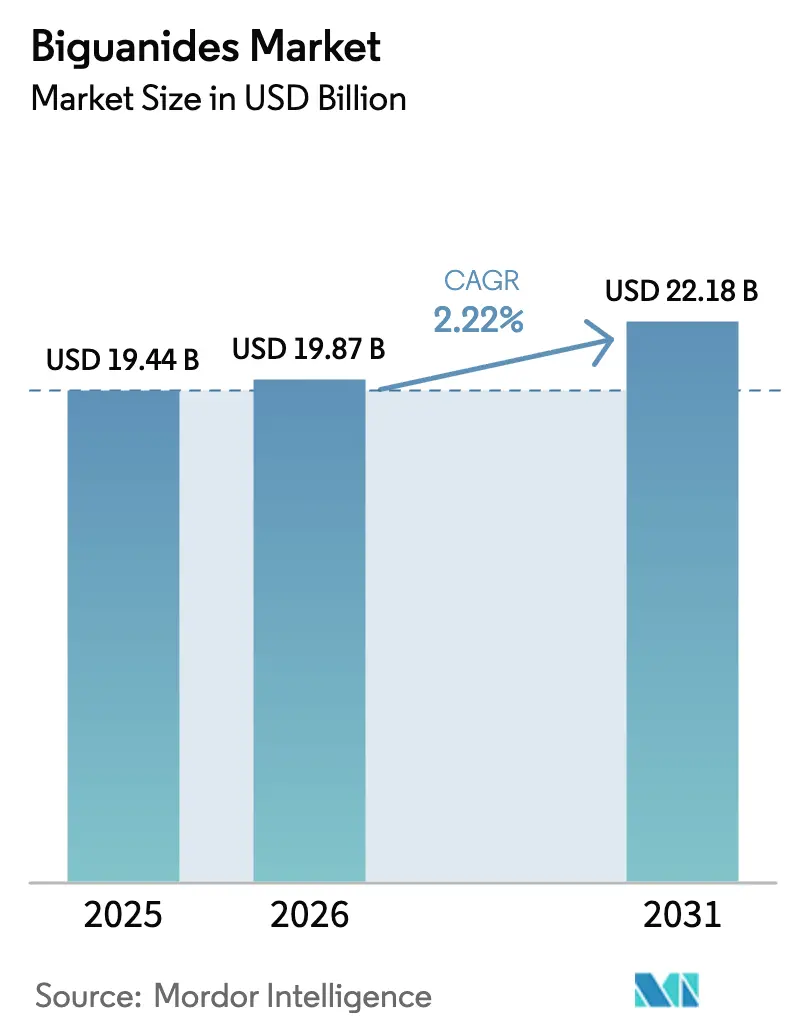
The biguanides market size was valued at USD 19.44 billion in 2025 and estimated to grow from USD 19.87 billion in 2026 to reach USD 22.18 billion by 2031, at a CAGR of 2.22% during the forecast period (2026-2031). Steady demand for metformin as first-line therapy in type-2 diabetes anchors revenue, while incremental growth arises from newer dosage forms, women’s health indications, and wider regional access. Asia-Pacific drives volume through large diabetic populations and vigorous generic competition, whereas North America sustains value through premium fixed-dose combinations. Regulatory actions that contain N-nitrosodimethylamine (NDMA) impurities, alongside digital pharmacy expansion, shape both supply resilience and distribution strategy. Competitive focus therefore rests on manufacturing quality, pricing agility, and formulation innovation to protect share against GLP-1 receptor agonists and SGLT-2 inhibitors that now influence first-line choices.
Key Report Takeaways
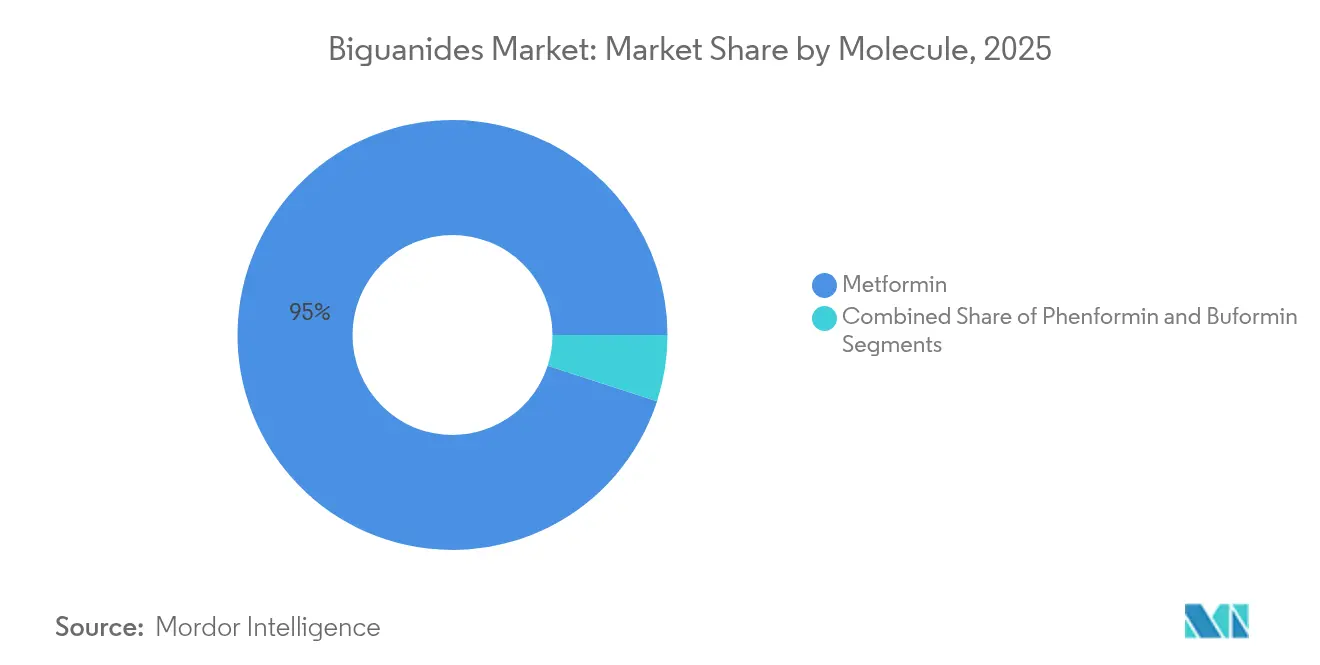
- By molecule, metformin held 95.02% of biguanides market share in 2025; buformin is projected to expand at a 7.22% CAGR through 2031.
- By dosage form, immediate-release tablets captured 59.85% revenue share in 2025, while extended-release formats are forecast to grow at 6.48% CAGR to 2031.
- By indication, type-2 diabetes mellitus accounted for an 88.66% share of the biguanides market size in 2025; polycystic ovary syndrome is advancing at a 7.35% CAGR to 2031.
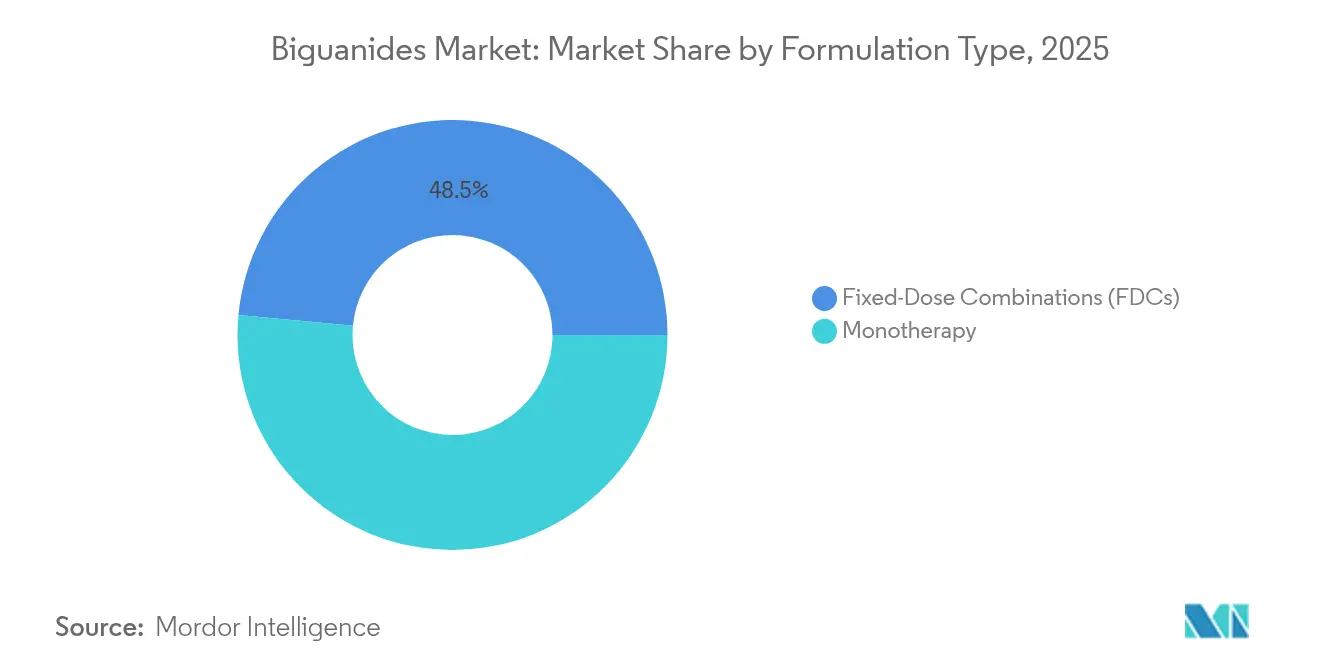
- By formulation type, monotherapy retained 51.48% share in 2025; fixed-dose combinations record the highest projected CAGR at 6.29% through 2031.
- By distribution channel, hospital pharmacies commanded 44.79% market share in 2025, whereas online pharmacies are expanding at an 8.02% CAGR to 2031.
- By geography, Asia-Pacific led with 35.10% revenue share in 2025; the region is expected to post an 7.88% CAGR through 2031.
Note: Market size and forecast figures in this report are generated using Mordor Intelligence’s proprietary estimation framework, updated with the latest available data and insights as of 2026.
Market Trends and Insights
Drivers Impact Analysis of Biguanides Market*
| Driver | (~) % Impact on CAGR Forecast | Geographic Relevance | Impact Timeline |
|---|---|---|---|
| Rising Global Prevalence Of Type-2 Diabetes (T2DM) | +0.8% | Global, with highest impact in APAC and MEA | Long term (≥ 4 years) |
| Favourable First-Line Therapy Status In Most Diabetes Guidelines | +0.6% | Global, particularly North America and Europe | Medium term (2-4 years) |
| Rapid Genericisation Driving Affordability In LMICs | +0.4% | APAC core, spill-over to MEA and South America | Short term (≤ 2 years) |
| Increasing Use Of Metformin In Women's Health (PCOS, GDM) | +0.3% | Global, with early adoption in North America and Europe | Medium term (2-4 years) |
| Exploration Of Biguanides As Geroprotective & Anti-Cancer Agents | +0.2% | North America and Europe, expanding to APAC | Long term (≥ 4 years) |
| AI-Enabled Molecule Repurposing Accelerating Fixed-Dose Combos | +0.1% | Global, led by North America and Europe | Medium term (2-4 years) |
| Source: Mordor Intelligence | |||
Rising Global Prevalence of Type-2 Diabetes (T2DM)
The projected rise to 783 million diabetes cases by 2045 sustains prescription volumes for metformin, particularly in Asia-Pacific where incidence is climbing fastest. Emerging markets deliver high unit growth because competitive generics reduce entry price; developed markets prefer premium fixed-dose combinations that couple glycemic control with cardiovascular benefit. Guideline reaffirmation of metformin as first-line therapy sustains baseline demand even while combination therapy gains momentum. Manufacturers therefore pursue dual strategy: defend high-volume core tablets for cost-sensitive health systems and promote value-added formats in wealthier segments. The global footprint of diabetes ensures that biguanides market expansion remains linked to prevention and early intervention programs as governments confront mounting healthcare costs.
Favourable First-Line Therapy Status in Most Diabetes Guidelines
Diabetes guidelines for 2025 kept metformin at the center of initial pharmacologic treatment, a position that guarantees continued volume stability[1]American Diabetes Association Professional Practice Committee, “9. Pharmacologic Approaches to Glycemic Treatment: Standards of Care in Diabetes–2025,” Diabetes.org. The same updates advocate earlier introduction of add-on agents such as SGLT-2 inhibitors, increasing opportunities for dual and triple combinations that embed metformin. Health systems adopting preventive approaches extend metformin’s clinical utility to prediabetes, enlarging its candidate pool. Regional nuances appear: Europe stresses cost-effectiveness, North America rewards outcome-based evidence, and emerging markets weigh affordability over optimization. Overall, guideline alignment secures metformin demand while encouraging manufacturers to innovate around combination ratios, dosing convenience, and patient groups beyond core diabetes.
Rapid Genericisation Driving Affordability in LMICs
Tender-driven procurement in China cut average metformin prices 42% and raised purchase volumes 49%, illustrating how bulk contracting stimulates access while compressing margins. India shows 809% price spread across brands, creating competitive tiers that coexist from ultra-low cost to premium quality. Price controls introduced in 2024 further squeezed branded blends, prompting makers to streamline supply chains and adopt cost-efficient active pharmaceutical ingredient (API) sourcing. Expansion into sub-Saharan Africa follows similar pattern, with multilateral donors supporting generic distribution. For biguanides market participants, scale manufacturing and stringent quality management decide survival under price pressure, yet expanded patient reach offsets lower unit profit in many LMIC settings.
Increasing Use of Metformin in Women’s Health (PCOS, GDM)
Randomized evidence shows metformin lowering gestational diabetes risk in women with polycystic ovary syndrome while improving live-birth outcomes without teratogenicity. National protocols in Brazil and other countries now endorse metformin during pregnancy when insulin intolerance exists, widening its demographic reach. This trend introduces younger, often non-diabetic patients who remain on therapy for extended periods to manage metabolic complications. Pharmaceutical education campaigns stress safety, while obstetric societies refine dosing guidance. Uptake varies by regulation: North America adopts rapidly due to insurer coverage, whereas parts of Asia seek additional local evidence. Overall, women’s health drives incremental prescriptions and supports research into formulation variants that optimize tolerability during pregnancy.
Restraints Impact Analysis of Biguanides Market*
| Restraint | (~) % Impact on CAGR Forecast | Geographic Relevance | Impact Timeline |
|---|---|---|---|
| NDMA Impurity Recalls Denting Prescriber Confidence | -0.7% | Global, with highest impact in North America and Europe | Short term (≤ 2 years) |
| Rising Popularity Of GLP-1 Ras & SGLT-2s As First-Line Options | -0.5% | North America and Europe, expanding to APAC | Medium term (2-4 years) |
| Price-Control Policies In India, China And Brazil Compressing Margins | -0.3% | APAC core and South America | Short term (≤ 2 years) |
| Sub-Standard / Counterfeit Metformin In E-Commerce Channels | -0.2% | Global, with concentration in unregulated online markets | Medium term (2-4 years) |
| Source: Mordor Intelligence | |||
NDMA Impurity Recalls Denting Prescriber Confidence
Successive recalls since 2020 exposed NDMA levels above regulatory limits in several metformin batches, forcing stock withdrawals from Teva, Apotex, and others. New research shows NDMA can form in-vivo when tablets encounter nitrites, intensifying safety scrutiny. Manufacturers responded by adopting antioxidants such as ascorbic acid in granulation and installing tighter gas-phase testing protocols, but clinician wariness lingers. U.S. and European regulators now require lot-specific certificates before market release, lengthening lead times. While supply has stabilized, heightened awareness accelerates switching to alternative drug classes and raises compliance costs, moderating the biguanides market trajectory in the near term.
Rising Popularity of GLP-1 RAs & SGLT-2s as First-Line Options
Guidelines in 2024 recommended prompt addition of SGLT-2 inhibitors or GLP-1 receptor agonists for cardiorenal benefit, nudging prescribers toward newer brands[2]Amir Qaseem et al., “Newer Pharmacologic Treatments in Adults With Type 2 Diabetes,” Acpjournals.org. FDA approval for Ozempic to slow kidney disease progression further elevates GLP-1 status. These agents deliver weight reduction as high as 18%, a superior outcome patients increasingly value over metformin’s weight-neutral profile. As payers widen reimbursement, metformin’s monotherapy share erodes, though fixed-dose combos mitigate loss by pairing metformin with the newer classes. The shift ultimately threatens unit volumes but inspires repositioning within combination frameworks.
*Our forecasts treat driver/restraint impacts as directional, not additive. The impact forecasts reflect baseline growth, mix effects, and variable interactions.
Biguanides Market Segment Analysis
By Molecule:
Metformin Monopoly Faces Niche ChallengersMetformin generated 95.02% of biguanides market revenue in 2025, underpinning class leadership through unmatched clinical familiarity and affordability. Buformin’s 7.22% CAGR highlights how unmet needs in metabolic oncology and specific regional approvals allow smaller molecules to carve shares. Phenformin finds renewed interest in anticancer programs despite historic safety withdrawals, leveraging deeper mitochondrial penetration for enhanced tumoricidal effect. Major suppliers hedge portfolios by investing modest sums into these secondary biguanides while continuing high-volume metformin manufacture. Pricing flexibility is greater in niche molecules, but limited indication scope constrains absolute revenue potential. Observers expect metformin’s share to taper gradually yet remain dominant throughout the forecast window as broader labels sustain prescriptions. The biguanides market size attached to metformin alone still exceeds USD 15 billion, underscoring the molecule’s structural importance.
Second-generation molecules attract research funding aimed at optimizing bioavailability, targeting tissue-specific AMPK activation, and reducing lactic acidosis risk. European consortia explore buformin micro-dosing for hepatocellular carcinoma prevention, while Japanese groups test phenformin in combination with checkpoint inhibitors. Regulatory acceptance rests on demonstrable safety margins, and early results suggest manageable profiles with proper dosing controls. If oncology trials yield approval, premium pricing could offset smaller patient pools, contributing fresh but measured top-line additions to the biguanides market.



By Dosage Form:
Extended-Release Innovation Drives Premium PositioningImmediate-release tablets retained a 59.85% share in 2025 owing to entrenched prescribing habits and the lowest cost per milligram. Extended-release tablets, though, are advancing at 6.48% CAGR as once-daily regimens boost adherence and minimize gastrointestinal discomfort. Proprietary hydrophilic matrices and laser-drilled osmotic pumps sustain controlled dissolution, commanding higher unit prices and lengthier patent life. High-strength 1,000 mg formats reduce pill burden and align with weight-based dosing guidelines in overweight populations. The biguanides market size tied to extended-release lines is projected to rise from USD 5.29 billion in 2026 to USD 7.23 billion by 2031.
Oral solutions, though minor, serve pediatric and geriatric segments unable to swallow tablets. Novel taste-masking excipients and small-volume concentrates aim to widen acceptance. Sachet granules tailored for low-resource settings bypass water scarcity issues and simplify dosing in rural clinics. Collectively, dosage-form diversification strengthens brand identity, allowing manufacturers to differentiate beyond price in a maturing therapeutic category.
By Indication:
PCOS Growth Signals Therapeutic ExpansionType-2 diabetes mellitus contributed 88.66% of 2025 revenue, but prescriptions for polycystic ovary syndrome expanded fastest at 7.35% CAGR as reproductive endocrinologists endorse metformin for insulin-mediated androgen reduction. Gestational diabetes plus prediabetes screening programs create early-intervention pathways that extend therapy duration across patient lifecycles. The biguanides market share associated with non-diabetes indications remains modest yet rising, reflecting evolving clinical evidence. Regulatory dossiers in South America already recognize PCOS management within metformin labeling, opening public procurement channels.
Insurance payers increasingly reimburse metformin in fertility protocols as cost-effective relative to gonadotropins. Pharmaceutical campaigns position metformin as metabolic support during in-vitro fertilization, an area seeing double-digit procedure growth. Long-term, indication diversification safeguards demand even if newer antihyperglycemics displace monotherapy in classic diabetes management.
By Formulation Type:
Fixed-Dose Combinations Reshape Competitive DynamicsMonotherapy tablets still generated 51.48% of 2025 sales, yet fixed-dose combinations climbed at 6.29% CAGR as clinicians adopt earlier dual targeting of complementary metabolic pathways. Invokamet and Segluromet illustrate how pairing metformin with SGLT-2 inhibitors or DPP-IV inhibitors aids adherence and secures patent exclusivity. Triple tablets recently approved in South Korea combine sitagliptin, dapagliflozin, and metformin, reflecting rapid formulation advances. The biguanides market size for combination products is estimated at USD 6.46 billion in 2026, with commercialization fueled by payer willingness to offset hospitalization costs linked to poor glycemic control.
Formulation developers exploit AI-enabled modeling to balance dissolution kinetics of multiple actives, overcoming prior bioequivalence hurdles. Resulting differentiated SKUs help companies negotiate favorable formulary tiers, especially in the United States where combination convenience resonates with patient adherence goals. Over the forecast horizon, combinations will represent an enlarging slice of biguanides revenues despite aggressive generic erosion in standalone metformin.
By Distribution Channel:
Online Growth Amid Quality ConcernsHospital pharmacies accounted for 44.79% of 2025 receipts, benefiting from bulk tender contracts and mandatory in-patient dispensing. Online channels, while only a fraction today, show 8.02% CAGR as consumers embrace home delivery. Accredited e-pharmacies partner with courier services that maintain temperature integrity, attracting chronic users seeking refill convenience. Retail chains innovate hybrid click-and-collect models that secure prescription validation while trimming footfall loss. Fraudulent websites persist, prompting two-factor authentication and blockchain serialization initiatives. These safeguards will determine whether e-commerce realizes its growth potential without undermining confidence in the biguanides market.
Geography Analysis
APAC Biguanides Market
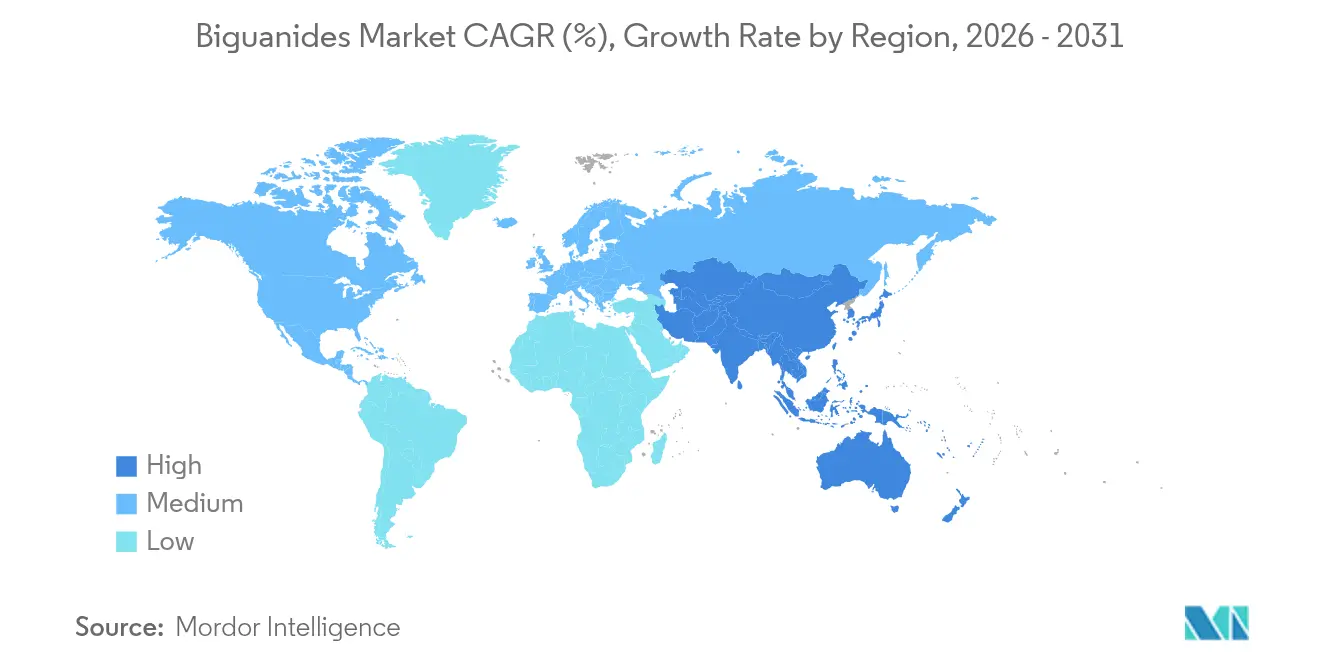
Asia-Pacific generated 35.10% of 2025 revenue and is on track to deliver an 7.88% CAGR, driven by China’s centralized procurement that cut prices yet expanded volume and India’s vast untreated diabetic base. Rapid urbanization coupled with lifestyle shifts boosts diagnosis rates, ensuring prescription growth even under price caps. Southeast Asian governments subsidize metformin within universal coverage schemes, emphasizing affordability over premium formulations.
North America Biguanides Market
North America embodies a value-focused yet slower-growing arena where sophisticated payers favor agents offering cardiorenal benefit. Fixed-dose combinations that integrate metformin maintain relevance, but GLP-1 receptor agonists increasingly command formulary preference. NDMA recall fallout accelerated hospital stewardship programs, raising documentation thresholds for suppliers. Despite flat volumes, revenue holds steady owing to higher average selling prices.
Europe Biguanides Market
Europe balances innovation adoption with budget oversight. National health systems negotiate volume-based discounts yet reimburse extended-release and combination tablets when pharmacoeconomic models demonstrate reduced complications. EMA approvals of patient-centric modalities such as weekly insulin augment the therapeutic toolbox and encourage combination regimens featuring metformin.
MEA Biguanides Market
Middle East & Africa experience rising diabetes prevalence but variable infrastructure. Gulf Cooperation Council states import high-quality brands, while sub-Saharan markets rely on donor-financed generics. Supply security challenges persist due to cold-chain gaps and counterfeit penetration.
South America Biguanides Market
South America, led by Brazil, witnesses rising metformin uptake in gestational diabetes protocols under the SUS system. Price controls limit margins, but public procurement covers vast populations, offering volume certainty for compliant manufacturers. Collectively, regional heterogeneity obliges companies to tailor packaging, price tiers, and distribution logistics, sustaining overall biguanides market expansion despite localized headwinds.

Regulatory Landscape
Regulation of biguanides is driven by quality and impurity-control requirements, with nitrosamines remaining the most consequential compliance theme for metformin. In September 2024, the US FDA updated its final guidance on Control of Nitrosamine Impurities in Human Drugs (Rev. 2), reinforcing stepwise risk evaluation, confirmatory testing, and mitigation expectations that affect release timelines and supplier qualification across global supply chains.
In Europe, the EMA maintains an active post-authorization framework for metformin safety oversight, including publication of a metformin PSUSA (PSUSA/00002001/202404) in January 2025 and continued reliance on CHMP Article 5(3) positions for nitrosamine impurity management. Manufacturers also align process and inspection readiness with international quality standards, including ICH Q13 for continuous manufacturing transitions and PIC/S-aligned GMP expectations, which together raise the bar for API and finished-dose process control when supplying regulated markets.
Competitive Landscape
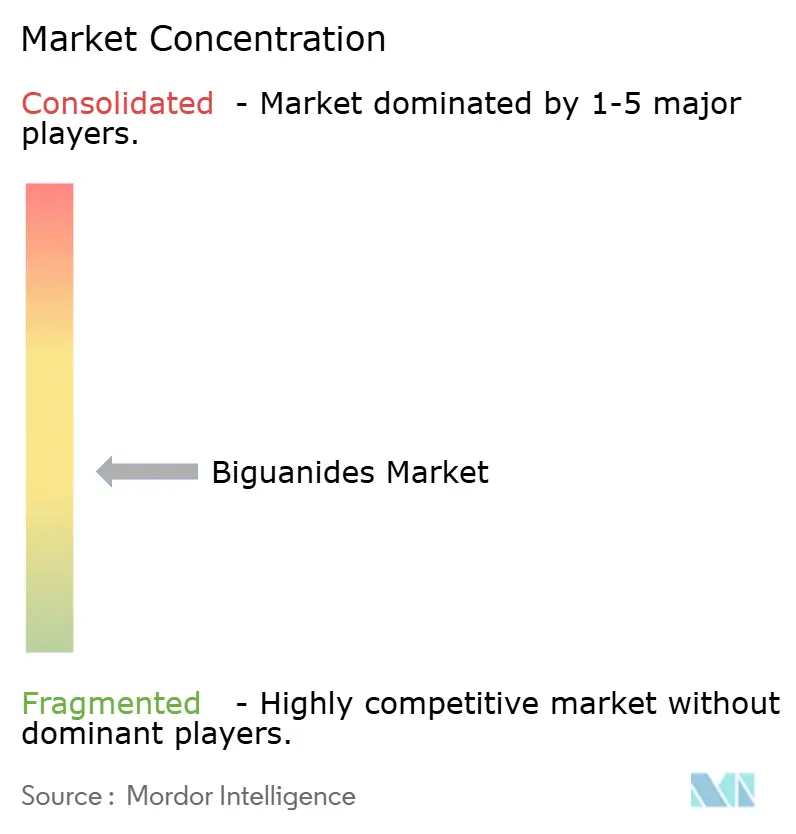
The biguanides market shows moderate concentration. Teva leverages global API plants and robust filing cadence to secure leading generic shares in North America and Europe. Merck prolongs sitagliptin/metformin exclusivity until 2029, underpinning branded premium pricing. GSK holds entrenched positions in emerging markets through localized production alliances that lower tariff exposure.
Zydus Lifesciences gained FDA approval for Zituvimet and gained CVS Caremark formulary access, illustrating how nimble generics can penetrate lucrative U.S. combinations space[3]Drugs.com, “FDA Approves Zituvimet (sitagliptin and metformin hydrochloride),” Drugs.com. DongKoo Bio & Pharma’s triple-agent approval in South Korea signals regional players’ capacity to innovate within regulatory frameworks that reward differentiation.
Quality leadership differentiates suppliers post-NDMA crises. Firms invest in nitrosamine mitigation technologies and real-time release testing to meet stricter Western import checks. Manufacturing scale continues as chief barrier to entry, but digital supply-chain transparency enables smaller entrants to demonstrate compliance.
Strategic moves include vertical integration to secure metformin API, backward-linkage into key intermediates to contain cost, and co-marketing deals with GLP-1 patent holders to position metformin within multi-drug regimens. This blend of operational excellence, regulatory competence, and partnering agility defines competitiveness through 2030.
Biguanides Industry Leaders
Bristol Myers Squibb
Glenmark Pharmaceuticals
Takeda Pharmaceutical
Sanofi SA
Merck & Co.
- *Disclaimer: Major Players sorted in no particular order
Biguanides Market Companies Covered in this Report
- Teva Pharmaceutical Industries
- Merck
- Takeda Pharmaceuticals
- GlaxoSmithKline
- Sanofi
- Boehringer Ingelheim
- Glenmark Pharma
- Zydus Lifesciences
- Bristol-Myers Squibb
- Sun Pharmaceuticals Industries
- Aurobindo Pharma
- Lupin
- Ajanta Pharma
- Granules India
- Apotex
- IOL Chemicals & Pharma
- Sandoz Group
- Dr. Reddy’s Laboratories

Market Opportunities and Future Outlook
Whitespace is concentrating in two areas, higher-compliance supply expansion for metformin API and acceleration of fixed-dose combinations that keep metformin embedded in modern diabetes regimens. A concrete signal on the supply side came in March 2026, when IOL Chemicals and Pharmaceuticals Limited received an EDQM Certificate of Suitability (CEP) for a Metformin Hydrochloride API route (Process-II). That milestone supports broader participation in European procurement and private-label supply, where documentation, impurity controls, and traceability are purchase qualifiers.
On the demand and portfolio side, the opportunity set is shifting toward metformin-containing combinations that are moving into the generic phase in large emerging markets. In May 2026, Eurofarma received generic registration in Brazil for a dapagliflozin-metformin fixed-dose combination, with pricing governed by Brazil's generic framework (including mandatory reference-linked reductions), signaling both volume access potential and intensified price competition as combinations lose exclusivity. Parallel academic work published in 2026 on new biguanide-linked derivatives (including sulfaguanidine and iminoguanidine classes) also points to an innovation runway beyond classic metformin, supporting formulation and delivery-system development efforts aimed at improving tolerability, targeting gut-mediated mechanisms, or addressing complication pathways such as neuroinflammation without changing the report's core molecule and dosage-form scope.
Recent Industry Developments in Biguanides Market
- January 2026: Takeda Pharmaceutical announced a global collaboration and license agreement with Halozyme Therapeutics to use ENHANZE drug delivery technology with vedolizumab. While not a biguanide product move, the deal reflects continued emphasis by large pharma on partnership-led lifecycle and delivery innovation, influencing competitive investment bandwidth and partnering behavior across therapeutic franchises.
- March 2025: Glenmark Pharmaceuticals launched GLEMPA-M in India, a fixed-dose combination of empagliflozin with metformin (500 mg or 1000 mg) for adults with type 2 diabetes. The launch reinforces how metformin is being positioned inside SGLT-2-based combinations as prescribing shifts toward agents with cardiorenal benefit.
- May 2024: Glenmark Pharmaceuticals entered an exclusive marketing and distribution agreement with BeiGene in India for tislelizumab and zanubrutinib. The arrangement expanded Glenmark's specialty portfolio footprint and can strengthen cross-portfolio channel capabilities that support chronic therapies, including its cardiometabolic offerings that commonly pair metformin with newer agents.


Biguanides Market Report Scope and Research Methodology
Market Definition and Coverage
For this study, the biguanides market covers revenues generated from biguanide-class medicines sold for human use, across major indications where these molecules are prescribed and across common dispensing channels.
Scope exclusions: We exclude non-therapeutic and industrial uses of biguanide chemistry, and we also exclude adjacent diabetes drug classes that are not biguanides.
Segments Covered in This Report
- By Molecule
- Metformin
- Phenformin
- Buformin
- By Dosage Form
- Immediate-Release Tablets
- Extended-Release Tablets
- Oral Solution
- By Indication
- Type-2 Diabetes Mellitus
- Prediabetes
- Polycystic Ovary Syndrome (PCOS)
- Gestational Diabetes Mellitus (GDM)
- By Formulation Type
- Monotherapy
- Fixed-Dose Combinations (FDCs)
- By Distribution Channel
- Hospital Pharmacies
- Retail Pharmacies
- Online Pharmacies
- Geography
- North America
- United States
- Canada
- Mexico
- Europe
- Germany
- United Kingdom
- France
- Italy
- Spain
- Rest of Europe
- Asia-Pacific
- China
- Japan
- India
- South Korea
- Australia
- Rest of Asia-Pacific
- Middle East and Africa
- GCC
- South Africa
- Rest of Middle East and Africa
- South America
- Brazil
- Argentina
- Rest of South America
- North America
Data Sources, Market Sizing, and Validation
Desk Research
Desk research starts with building a clean fact base around diabetes prevalence, diagnosis and treatment rates, and medicine access by country. These signals determine the addressable demand pool, so the International Diabetes Federation is used for diabetes burden, the World Health Organization for health system indicators, and the World Bank for macro and spending context. For safety-related utilization shifts, we also review US FDA safety communications and approval updates that can affect prescribing.
To keep the numbers grounded, we also review sources such as national statistics portals, customs and trade releases where relevant, and peer-reviewed clinical and pharmacoepidemiology studies that report prescribing patterns and persistence. Company filings, annual reports, and investor presentations are used to understand portfolio exposure and channel mix, and a paid subscription for company financials and intelligence is used to standardize currency and segment mapping. The sources listed here are illustrative, and many other public references are also reviewed for data collection, validation, and clarification.
Primary Interviews and Surveys
Primary work is used to pressure test the desk assumptions that most often move the model, including treatment sequencing, metformin use in earlier and longer therapy windows, and the pace of extended release and fixed dose combination adoption. We speak with a mix of manufacturers, distributors, pharmacists, and clinicians across APAC, EMEA, and the Americas, so pricing, channel margins, and utilization patterns can be compared and then normalized into one consistent view.
Distribution of primary research fieldwork respondents
| Company type | Respondent position | Region |
|---|---|---|
| Top tier: 37% | CXOs: 16% | APAC: 50% |
| Mid tier: 47% | Functional/Unit leaders: 36% | EMEA: 32% |
| Smaller Players: 16% | Managers: 48% | Americas: 18% |
Market-Sizing & Forecasting
Sizing is built using a top-down approach where diabetes and prediabetes patient pools are translated into a treated population, which is then converted into biguanides demand using therapy adoption rates by line of treatment and average annual consumption per patient. To keep it practical, the model is driven by inputs that can be explained and refreshed, such as diagnosed type 2 diabetes counts, treatment penetration, metformin share within oral antidiabetics, average daily dose mix (immediate release versus extended release), and channel split across hospital, retail, and online pharmacies.
After the first pass, results are checked with selective bottom-up approximations. These include sampled price points by country, pack level volume logic, and distributor or pharmacy channel checks to confirm whether the implied revenue per patient is realistic. Where direct price or volume detail is missing, gaps are handled by using proxy countries with similar reimbursement and income levels, followed by an adjustment agreed through primary inputs.
For forecasting, scenario analysis is used because the market is influenced by a few clear levers that can change direction, like generic price erosion, shifts toward newer diabetes therapies, and safety or quality events that affect supply continuity. Assumptions are reviewed with experts, and then growth is applied by region with a final reconciliation to global totals so the story and the math stay consistent.
Data Validation & Update Cycle
Validation happens in layers, starting with internal consistency checks that compare implied patients, doses, and prices against known clinical practice and public statistics. Outliers are flagged when the model shows unusual per patient spending, abrupt share shifts, or a channel mix that does not align with on-the-ground feedback, and then the inputs are revisited.
Before sign-off, the market totals are reviewed by another analyst, and key assumptions are rechecked against independent signals such as prescribing pattern literature and regulatory updates. The report is refreshed annually, and interim updates are triggered when there is a material event, such as a major label change, a significant pricing move, or supply disruption. Right before delivery, we do a final pass so clients receive the latest updated view.
Mordor Intelligence's Biguanides Market Size Versus Other Published Estimates
Published market sizes for biguanides can differ even when the topic sounds identical, since each publisher chooses its own definition of what counts, the years used as the base, and how demand is linked back to real-world utilization. Currency timing, channel coverage, and how combination therapies are treated also tend to create visible gaps.
Some external estimates appear to treat biguanides as a broader chemical family and may also mix in non-therapeutic end uses or a narrower channel set, which shifts the value up or down depending on what is included. Mordor Intelligence limits the count to human therapeutic revenues for biguanide-class medicines, and combination products are only included when the biguanide component is part of the labeled therapy and the revenue is attributed to the medicine market model.
Benchmark comparison
| Source | Market Size | Gaps in Research Methodology |
|---|---|---|
| Mordor Intelligence | USD 19.87 B (2026) | |
| Trade Publisher A | USD 5.10 B (2024) | Uses an annual sales view that is typically narrower in scope, and it may exclude parts of the biguanides demand tied to fixed dose combinations or certain indications depending on how sales are grouped by channel and geography. |
| Industry Research Portal B | USD 4.97 B (2024) | Likely applies a broader biguanide definition across multiple end uses and then reports a blended revenue number, which makes it less comparable to a medicines-only view tied to treated patient demand and dosage consumption. |
Taken together, the spread is mainly explained by scope choice and the mechanics used to translate demand into revenue, rather than simple math differences. When the model is anchored to treated cohorts, dose patterns, and channel pricing checks, the total becomes easier to trace and to update in a repeatable way as assumptions change year to year.


Key Questions Answered in the Report
What is the current size of the biguanides market?
The biguanides market size reached USD 19.87 billion in 2026 and is projected to grow to USD 22.18 billion by 2031.
Which region leads biguanides consumption?
Asia-Pacific commands 35.10% of global revenue and is also the fastest growing region with an 7.88% CAGR through 2031.
Why do extended-release metformin tablets gain momentum?
Once-daily dosing improves adherence and lowers gastrointestinal side effects, driving a 6.48% CAGR for extended-release forms.
How are NDMA recalls affecting biguanides demand?
Quality concerns have raised regulatory scrutiny and encouraged some prescribers to shift toward alternative classes, trimming short-term growth by an estimated 0.7% CAGR impact.
What role does women’s health play in market expansion?
Metformin’s use in PCOS and gestational diabetes is rising at a 7.35% CAGR, broadening its patient base beyond traditional diabetes care.
Page last updated on:


 Your data is secure and never sold or shared.


