Big Data Analytics In Retail Market Size and Share
Market Overview
| Study Period | 2020 - 2031 |
|---|---|
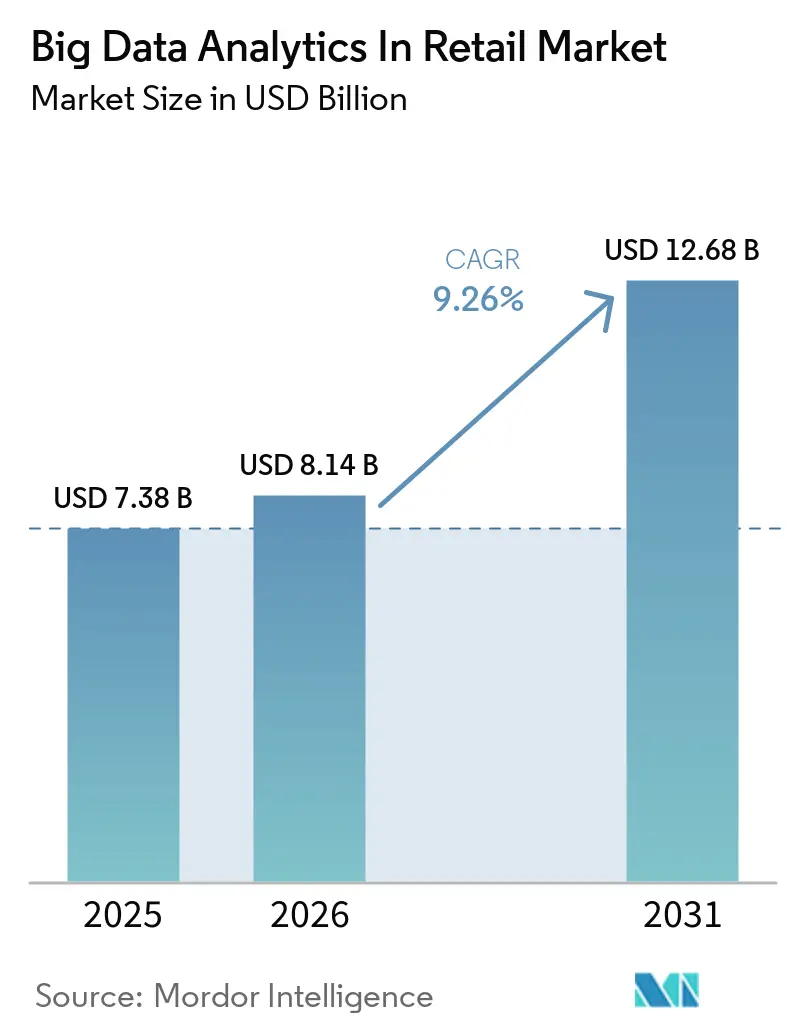
| Market Size (2026) | USD 8.14 Billion |
| Market Size (2031) | USD 12.68 Billion |
| Growth Rate (2026 - 2031) | 9.26% CAGR |
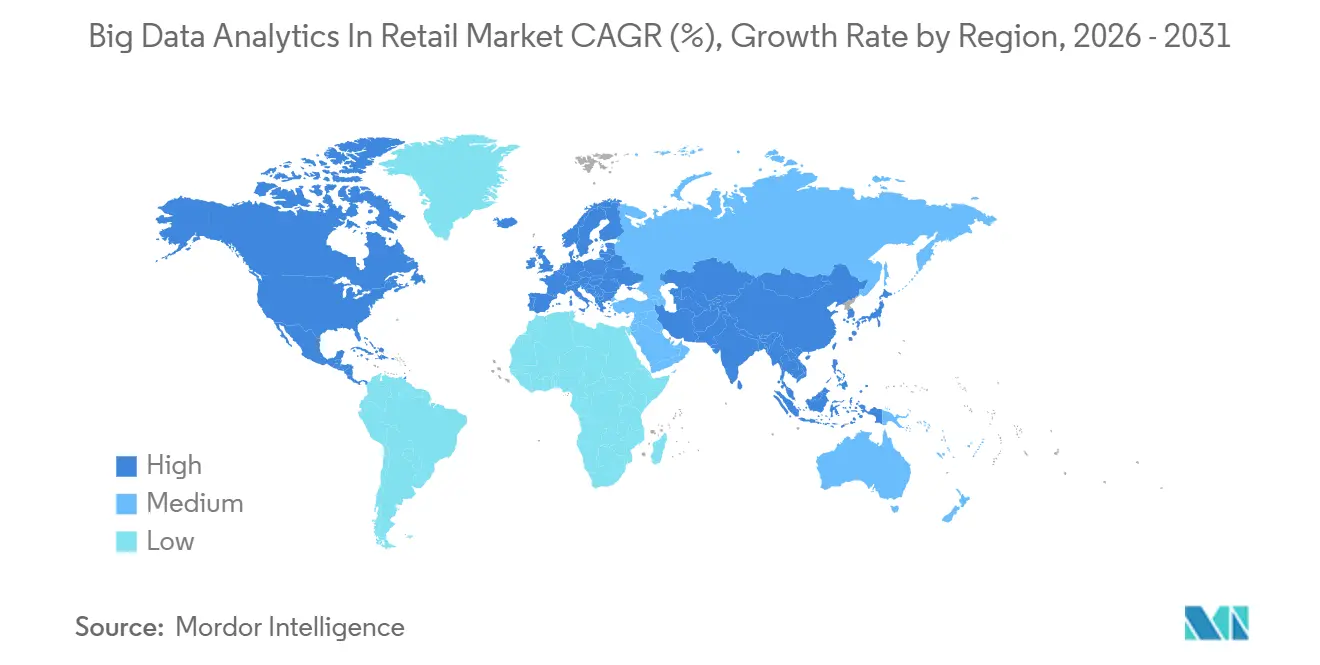
| Fastest Growing Market | Asia-Pacific |
| Largest Market | North America |
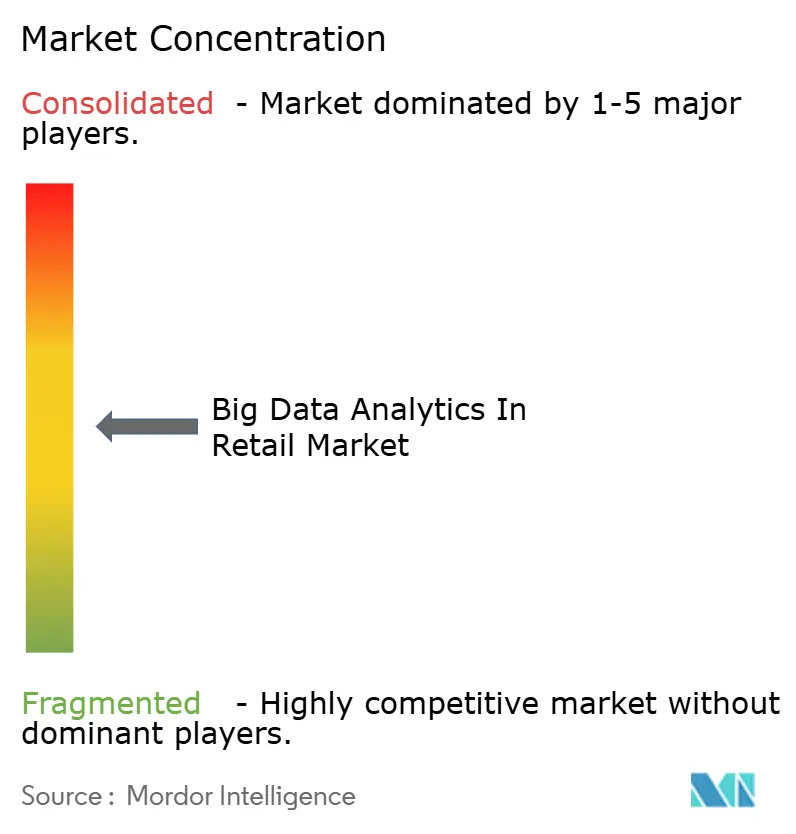
| Market Concentration | Medium |
Major Players *Disclaimer: Major Players sorted in no particular order Image © Mordor Intelligence. Reuse requires attribution under CC BY 4.0. | |
Big Data Analytics In Retail Market Analysis by Mordor Intelligence
The big data analytics in retail market size is projected to be USD 7.38 billion in 2025, USD 8.14 billion in 2026, and reach USD 12.68 billion by 2031, advancing at a 9.26% CAGR across the period. Retailers are prioritizing unified data architectures that blend online and store-level touchpoints, accelerating spend on streaming engines, customer data platforms, and retail media measurement tools. Real-time decisioning now underpins cross-channel product recommendations, while edge analytics reduces latency for shelf-availability alerts and dynamic digital signage. Component vendors are bundling fraud detection, price optimization, and demand forecasting into turnkey suites, lowering adoption barriers for mid-tier chains. Geographic expansion remains led by Asia-Pacific, where social-commerce and unified payments are generating rich behavioral data sets, although North America still accounts for the largest absolute revenue base.
Key Report Takeaways
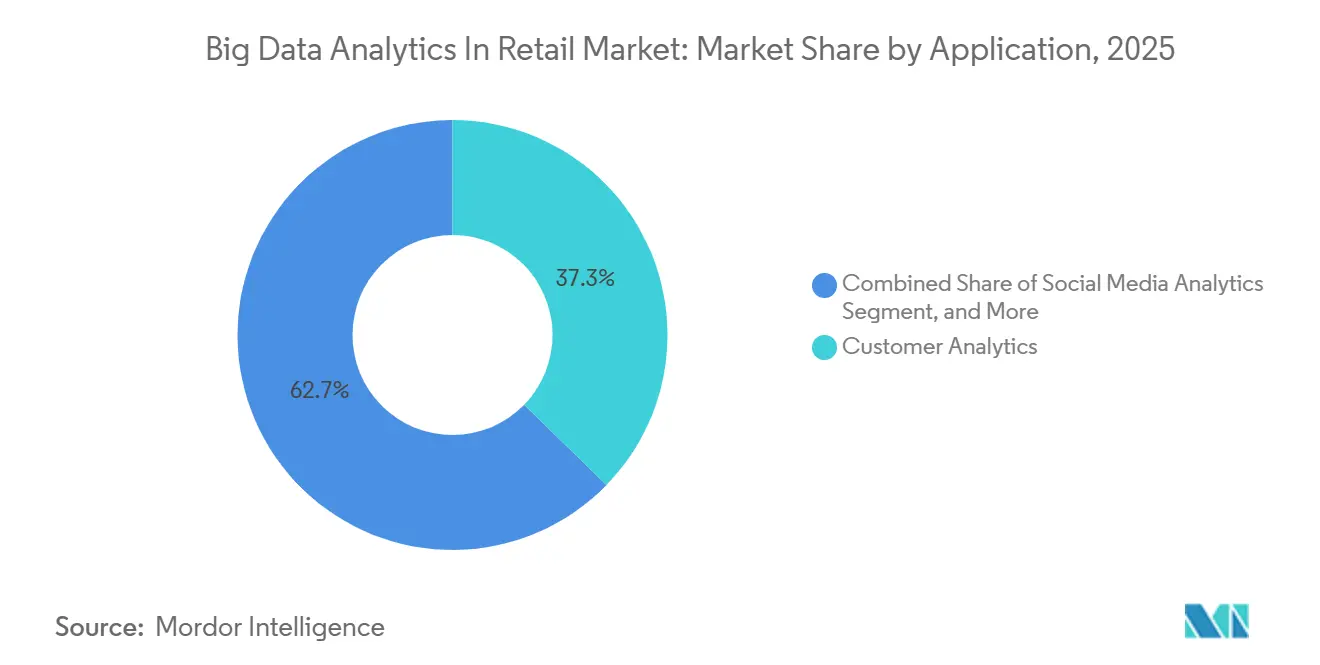
- By application, Customer Analytics led with 37.29% revenue share in 2025, while Fraud Detection is projected to register the fastest 10.76% CAGR through 2031.
- By business type, Large Enterprises held 63.24% of the big data analytics in retail market share in 2025, yet Small and Medium Enterprises are expanding at a 9.61% CAGR through 2031.
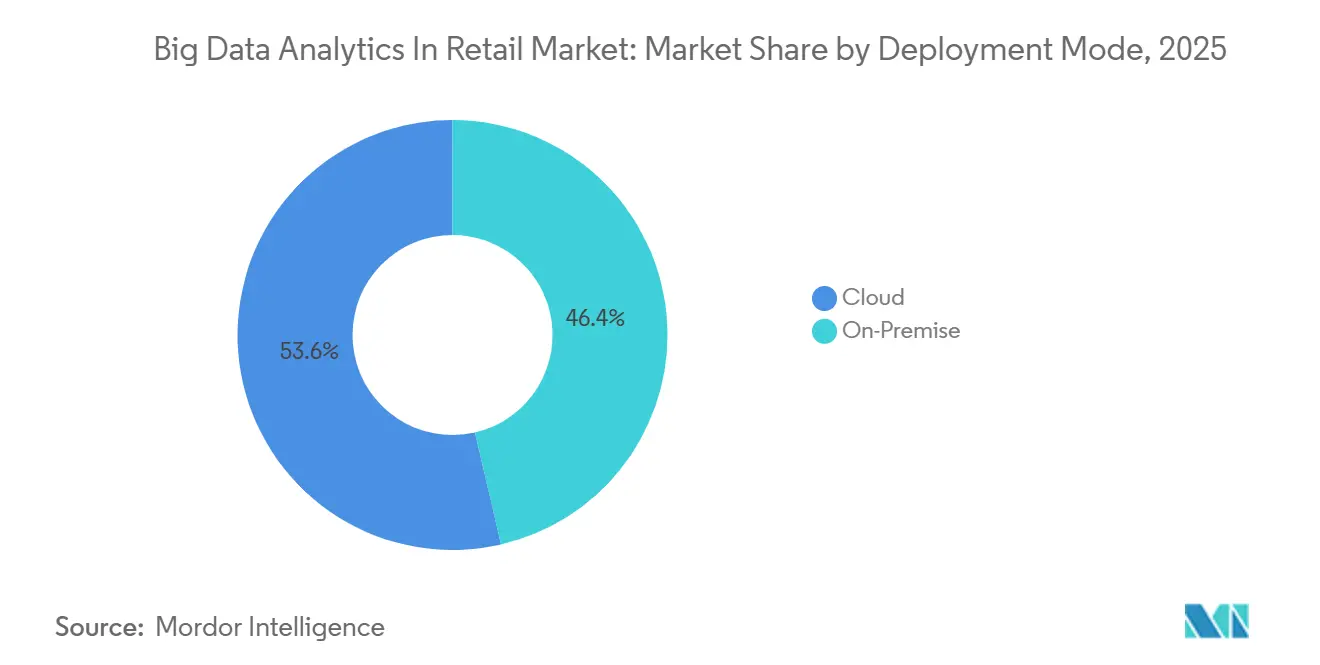
- By deployment mode, On-Premise systems captured 53.63% revenue in 2025; cloud deployments are forecast to grow at 9.87% CAGR through 2031.
- By analytics type, Descriptive tools accounted for 32.41% of 2025 revenue, whereas Prescriptive engines are advancing at a 10.03% CAGR to 2031.
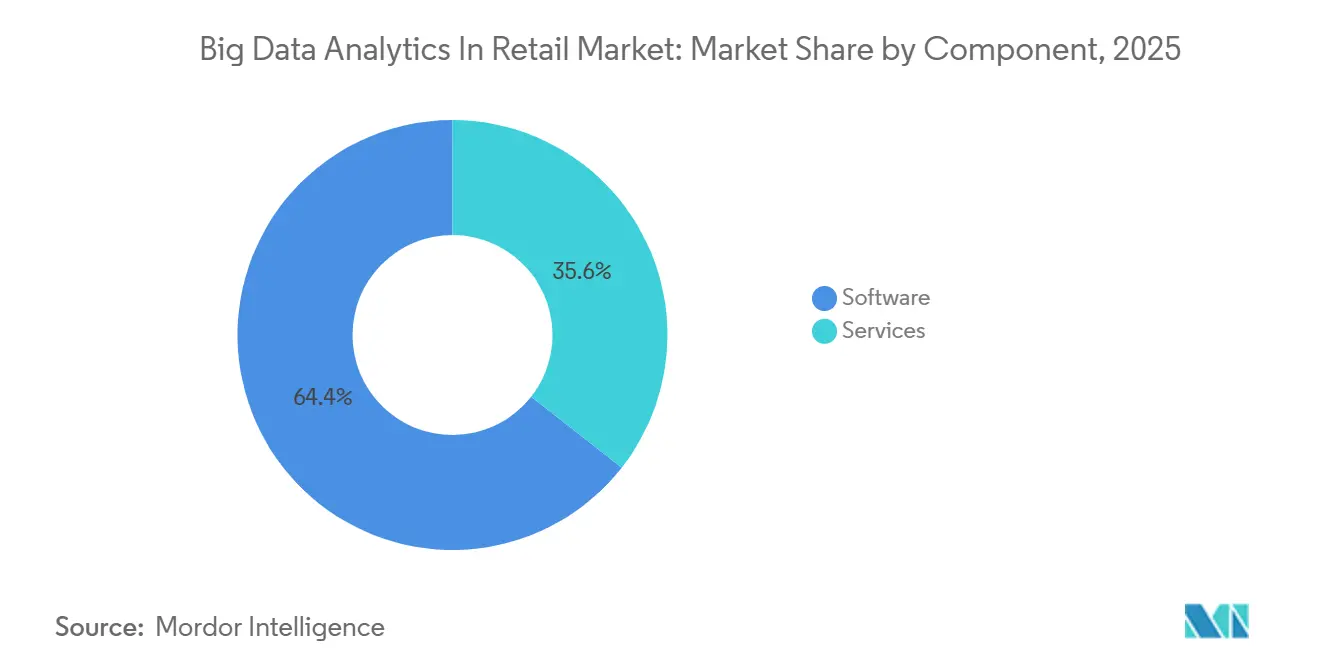
- By component, Software generated 64.42% revenue in 2025; Services are rising at a 9.21% CAGR through 2031.
- By retail format, E-Commerce Stores commanded 41.74% revenue in 2025, and Direct-to-Consumer Brands are on track for a 10.33% CAGR to 2031.
- By geography, North America led with 47.62% revenue share in 2025, while Asia-Pacific is forecast to expand at an 11.01% CAGR to 2031.
Note: Market size and forecast figures in this report are generated using Mordor Intelligence’s proprietary estimation framework, updated with the latest available data and insights as of January 2026.
Global Big Data Analytics In Retail Market Trends and Insights
Drivers Impact Analysis*
| Driver | (~) % Impact on CAGR Forecast | Geographic Relevance | Impact Timeline |
|---|---|---|---|
| Surge in Real-Time Omni-Channel Personalisation | +2.1% | Global, early uptake in North America and Western Europe | Short term (≤ 2 years) |
| Integration of Retail Media Networks with First-Party Data | +1.8% | North America and Europe, expanding to Asia-Pacific | Medium term (2-4 years) |
| Expansion of Edge Analytics for In-Store IoT | +1.5% | Global, concentration in Asia-Pacific and North America | Medium term (2-4 years) |
| Growing Adoption of AI-Powered Price Optimisation Engines | +1.6% | Global, advanced use in North America and Europe | Short term (≤ 2 years) |
| Rise of Headless Commerce Architectures | +0.9% | North America and Europe, gradual spread to Asia-Pacific | Medium term (2-4 years) |
| Mainstreaming of Customer Data Platforms in Retail | +1.2% | Global, rapid uptake in North America and Europe | Short term (≤ 2 years) |
| Source: Mordor Intelligence | |||
Surge in Real-Time Omni-Channel Personalisation
Retailers have embedded streaming engines that ingest clickstream, point-of-sale, and mobile-app events within milliseconds, allowing offers and recommendations that mirror a shopper’s most recent action. Amazon Web Services spotlighted this capability in its 2025 keynote as critical for reducing cart abandonment during seasonal peaks. Walmart’s rollout across 4,700 United States stores combined beacon signals and online histories to boost cross-category basket value by 12%. The approach requires rigorous fairness checks because under-represented cohorts can skew training data, a risk the European Artificial Intelligence Act addresses through transparency mandates.[1]European Commission, “Artificial Intelligence Act Press Release,” ec.europa.eu
Integration of Retail Media Networks with First-Party Data
On-site advertising platforms generated USD 50 billion global revenue in 2025, fueled by purchase-based targeting that links impressions to in-basket sales. Kroger grew its advertiser base 38% by activating anonymized loyalty data inside privacy-preserving clean rooms.[2]Kroger, “Precision Marketing Investor Presentation,” ir.kroger.com Snowflake and Google Cloud formalized joint clean-room products in early 2026, enabling cross-dataset joins without exposing raw records.
Expansion of Edge Analytics for In-Store IoT
Edge-inference appliances process video, RFID, and shelf-weight signals locally, cutting reliance on central clouds and enabling millisecond inventory alerts. Tesco installed Intel OpenVINO devices across 500 United Kingdom stores in 2025, trimming out-of-stock gaps by 18%. Distributed models improve privacy by anonymizing data at the sensor layer, aligning with GDPR’s minimization principle. Managing thousands of remote nodes introduces orchestration complexity, sparking demand for automated model-update pipelines.
Growing Adoption of AI-Powered Price Optimisation Engines
Albertsons reported a 7% gross-margin lift in fiscal 2025 after deploying reinforcement-learning pricing engines that ingest competitor rates, weather, and supplier variability Albertsons. The United States Federal Trade Commission issued guidance on algorithmic pricing amid concerns of tacit collusion when multiple retailers rely on similar models FTC. Retailers have added fairness constraints to avoid discriminatory differentials, increasing the need for continuous audit frameworks Deloitte.
Restraints Impact Analysis*
| Restraint | (~) % Impact on CAGR Forecast | Geographic Relevance | Impact Timeline |
|---|---|---|---|
| Fragmentation of Legacy POS and ERP Stacks | -1.3% | Global, acute in North America and Europe | Long term (≥ 4 years) |
| Privacy-Centric Browser and OS Restrictions | -1.1% | Global, stringent in Europe and California | Short term (≤ 2 years) |
| Shortage of Retail Data Science Talent | -0.8% | Global, severe in Asia-Pacific and South America | Medium term (2-4 years) |
| Escalating Cloud Egress and Data Movement Costs | -0.6% | Global, higher on multi-cloud deployments | Medium term (2-4 years) |
| Source: Mordor Intelligence | |||
Fragmentation of Legacy POS and ERP Stacks
A 2025 National Retail Federation survey showed 63% of United States chains operate at least three transaction systems lacking interoperability, delaying unified customer profiles and real-time inventory.[3]National Retail Federation, “2025 POS and ERP Survey,” nrf.com Replacement costs often exceed USD 50 million for large chains, crowding out customer-facing investments. Batch extracts inhibit sub-second decisioning, limiting benefits from real-time personalization and price optimization.
Privacy-Centric Browser and OS Restrictions
Apple’s App Tracking Transparency and Google’s third-party cookie sunset cut opt-in rates below 25% for Shopify merchants in 2025. Retailers must implement consent platforms and server-side tagging to remain compliant with GDPR and California Consumer Privacy Act rules, adding cost and complexity. Zero-party data tactics such as style quizzes and early-access clubs are gaining traction as voluntary disclosure incentives.
*Our forecasts treat driver/restraint impacts as directional, not additive. The impact forecasts reflect baseline growth, mix effects, and variable interactions.
Segment Analysis
By Application: Fraud Detection Outpaces Legacy Use Cases
Fraud Detection is growing at a 10.76% CAGR through 2031, making it the fastest-moving application within the big data analytics in retail market. Account-takeover and synthetic identity attacks targeting omnichannel payment flows are driving investment in graph-analysis and behavioral biometrics. Customer Analytics still delivered 37.29% of 2025 revenue, but its trajectory is flattening as segmentation and lifetime-value models mature. Merchandising and supply-chain teams now rely on prescriptive engines that automate replenishment based on external factors such as weather and social sentiment.
Operational intelligence dashboards have become commoditized, pressuring vendors to embed vertical add-ons like pharmacy compliance tracking. The big data analytics in retail market size attributed to Fraud Detection is expected to widen as buy-now-pay-later and digital wallets expand the threat surface. Vendors are differentiating through low-false-positive models that preserve frictionless checkout. Retailers also integrate fraud insights into personalization workflows so high-risk profiles trigger additional verification, balancing security with customer experience.


By Business Type: SMEs Narrow the Technology Gap
Small and Medium Enterprises are set to expand revenue at 9.61% CAGR, leveraging usage-based cloud platforms that bundle warehousing, machine learning, and visualization. Large Enterprises controlled 63.24% of 2025 spending, anchored by multi-year vendor contracts and larger staffing budgets. AutoML features and pre-built connectors let regional grocers deploy advanced tools without in-house data engineers, democratizing sophisticated analytics capabilities.
Large chains still negotiate deep volume discounts, yet their complex organizations slow company-wide rollouts. The big data analytics in retail market size flowing from SMEs is rising as composable commerce lets them plug in best-of-breed modules instead of overhauling entire stacks. Cloud providers lure these retailers with starter tiers that scale elastically, allowing experimentation without capital risk. Talent shortages remain a constraint, though managed services and guided notebooks mitigate the skills gap.
By Deployment Mode: Cloud Momentum Builds Despite Egress Fees
Cloud deployments are forecast to post a 9.87% CAGR, assisted by retail-specific clean rooms and serverless analytics. On-Premise maintained 53.63% revenue in 2025 due to latency concerns around proprietary point-of-sale stacks. Hybrid strategies keep sensitive data in-house while sending batch workloads to the cloud, aligning with data-residency mandates and lowering upfront hardware spending.
Data-lakehouse architectures collocate compute and storage to reduce costly egress, with Databricks and Snowflake optimizing native integrations. The big data analytics in retail market share for cloud will keep rising as pay-as-you-go economics and rapid feature releases outweigh variable costs. On-premise estates retain predictable capital expenditure profiles but require skills to manage hardware refresh cycles, a challenge mid-tier retailers increasingly avoid.
By Analytics Type: Prescriptive Engines Redefine Decisioning
Prescriptive Analytics is advancing at a 10.03% CAGR, reflecting adoption of optimization models that autonomously adjust orders, promotions, and markdowns. Descriptive dashboards, although comprising 32.41% of 2025 revenue, now function chiefly as compliance and executive-level reporting layers. Diagnostic and Predictive tools remain critical for root-cause analysis and demand forecasting, respectively.
Retailers integrate prescriptive outputs directly into supply-chain execution systems, shrinking the latency between demand signals and replenishment. The big data analytics in retail market size for prescriptive applications will continue expanding as vendors improve model interpretability, enabling merchandisers to trust and override recommendations when needed. Transparency features such as model cards and explainability dashboards foster user confidence and meet emerging regulatory expectations.
By Component: Services Capture Value from Complexity
Software generated 64.42% of 2025 revenue, but Services are growing at a 9.21% CAGR on rising integration and model-maintenance demands. Systems integrators have built retail analytics practices that customize modules for specific workflows, while managed services monitor drift and retrain models. Vendors are embedding low-code interfaces to shrink service footprints, though this simultaneously broadens the addressable market by easing entry for non-technical users.
Training and change-management services are in higher demand as retailers seek to upskill merchandisers and store managers. The big data analytics in retail market size allocated to Services will rise because advanced use cases require continuous tuning and domain expertise. Subscription bundles that mix software and support obscure the true ownership cost, but they simplify procurement and create recurring revenue streams for vendors.
By Retail Format: Direct-to-Consumer Brands Lead Experimentation
Direct-to-Consumer Brands are on track for a 10.33% CAGR, capitalizing on zero-party data and rapid experimentation cycles. E-Commerce Stores held 41.74% revenue in 2025, backed by mature web analytics and easy connectors to platforms like Shopify. Brick-and-Mortar operators are installing edge devices for video analytics and RFID, generating in-store signals that feed unified profiles. Omnichannel models benefit from cross-channel attribution that dissects influence across browsing, app usage, and walk-ins.
D2C brands operate lean stacks and bypass wholesale intermediaries, granting end-to-end data control. The big data analytics in retail market share accruing to D2C remains small in absolute terms but influential in shaping vendor roadmaps toward agile, API-first solutions. E-Commerce players face mounting pressure from social-commerce integrations that collapse discovery and checkout, pushing analytics to extend into creator and affiliate ecosystems.
Geography Analysis
North America supplied 47.62% of 2025 revenue, supported by early adoption of customer data platforms and a dense ecosystem of analytics vendors. The region is now shifting toward incremental optimization, with retailers layering clean rooms and explainable AI atop existing investments. Asia-Pacific is forecast to record the highest 11.01% CAGR, propelled by China’s social-commerce giants and India’s Unified Payments Interface, which processed 11.6 billion transactions in December 2025, producing granular behavioral data for analytics pipelines.[4]Source: National Payments Corporation of India, “UPI Monthly Statistics,” npci.org.in
In China, closed-loop attribution is feasible because Alipay and WeChat integrate payments, social engagement, and loyalty in a single ecosystem, an advantage Western markets struggle to replicate. Japan and South Korea are piloting cashierless stores, boosting demand for edge inference and computer vision. Australia is expanding data-sharing regulations that encourage open banking-style portability for retail transaction data, setting a precedent for other jurisdictions.
Europe faces slower growth owing to stringent data-protection rules, yet it plays a lead role in federated learning trials that train models across decentralized nodes without moving raw data. Middle East luxury retailers and hypermarkets are adopting high-margin personalization engines as tourism rebounds, while Africa’s nascent e-commerce relies on lightweight, mobile-first analytics designed for intermittent connectivity. South America’s expansion is tempered by macroeconomic volatility and cloud-infrastructure gaps, though Brazil’s leading chains are piloting models that adjust for currency swings and import tariffs.

Competitive Landscape
Competitive intensity is moderate, with hyperscalers Amazon Web Services, Microsoft Azure, and Google Cloud bundling analytics into infrastructure contracts, pressuring independent software vendors on price. Specialized players such as Salesforce, Adobe, and dunnhumby differentiate through deep retail data models and pre-built connectors. Databricks and Snowflake disrupt legacy vendors by unifying lakehouse storage and machine learning, shortening time-to-insight and simplifying governance.
Mergers and acquisitions target niche capabilities in fraud detection, dynamic pricing, and supply-chain visibility, which are then folded into broader suites to raise customer lifetime value. Explainable-AI has emerged as a core buyer requirement, prompting vendors to release model cards and counterfactual tools. Synthetic data generation, exemplified by NVIDIA Omniverse, is gaining traction to augment training sets for rare events without breaching privacy. Patent filings center on graph-based anomaly detection, reinforcement-learning price engines, and federated architectures.
Retailers are leveraging enterprise agreements that span cloud, analytics, and advertising solutions, consolidating spend with fewer suppliers and raising switching costs. Independent vendors respond by deepening domain specificity, offering modules for fresh-food waste reduction or pharmacy compliance. Systems integrators act as channel partners, bundling vertical accelerators to penetrate mid-tier accounts that hyperscalers may overlook.
Big Data Analytics In Retail Industry Leaders
SAP SE
International Business Machines Corporation
Oracle Corporation
Salesforce, Inc.
Amazon Web Services, Inc.
- *Disclaimer: Major Players sorted in no particular order

Recent Industry Developments
- January 2026: Snowflake partnered with Google Cloud to launch Retail Data Clean Rooms for closed-loop attribution across purchase and impression data.
- December 2025: Microsoft Azure released Azure Retail Analytics Suite bundling demand forecasting, price optimization, and fraud detection with SAP and Oracle connectors.
- November 2025: Amazon Web Services unveiled SageMaker Canvas for Retail, a no-code tool that lets merchandisers build demand-forecasting models.
- October 2025: Databricks acquired Einblick Analytics, integrating collaborative notebooks into its Lakehouse Platform for faster feature engineering.


Global Big Data Analytics In Retail Market Report Scope
The Big Data Analytics in Retail Market Report is Segmented by Application (Merchandising and Supply Chain Analytics, Social Media Analytics, Customer Analytics, Operational Intelligence, Pricing Optimisation, Fraud Detection, Other Applications), Business Type (Small and Medium Enterprises, Large Enterprises), Deployment Mode (On-Premise, Cloud), Analytics Type (Descriptive, Diagnostic, Predictive, Prescriptive), Component (Software, Services), Retail Format (E-Commerce, Brick-and-Mortar, Omnichannel, Direct-to-Consumer), and Geography (North America, Europe, Asia-Pacific, Middle East, Africa, South America). Market Forecasts are Provided in Terms of Value (USD).
| Merchandising and Supply Chain Analytics |
| Social Media Analytics |
| Customer Analytics |
| Operational Intelligence |
| Pricing Optimisation |
| Fraud Detection |
| Other Applications, Application |
| Small and Medium Enterprises |
| Large Enterprises |
| On-Premise |
| Cloud |
| Descriptive Analytics |
| Diagnostic Analytics |
| Predictive Analytics |
| Prescriptive Analytics |
| Software |
| Services |
| E-Commerce Stores |
| Brick-and-Mortar Stores |
| Omnichannel Retailers |
| Direct-to-Consumer Brands |
| North America | United States |
| Canada | |
| Mexico | |
| Europe | United Kingdom |
| Germany | |
| France | |
| Italy | |
| Rest of Europe | |
| Asia-Pacific | China |
| Japan | |
| India | |
| South Korea | |
| Rest of Asia-Pacific | |
| Middle East | Israel |
| Saudi Arabia | |
| United Arab Emirates | |
| Turkey | |
| Rest of Middle East | |
| Africa | South Africa |
| Egypt | |
| Rest of Africa | |
| South America | Brazil |
| Argentina | |
| Rest of South America |
| By Application | Merchandising and Supply Chain Analytics | |
| Social Media Analytics | ||
| Customer Analytics | ||
| Operational Intelligence | ||
| Pricing Optimisation | ||
| Fraud Detection | ||
| Other Applications, Application | ||
| By Business Type | Small and Medium Enterprises | |
| Large Enterprises | ||
| By Deployment Mode | On-Premise | |
| Cloud | ||
| By Analytics Type | Descriptive Analytics | |
| Diagnostic Analytics | ||
| Predictive Analytics | ||
| Prescriptive Analytics | ||
| By Component | Software | |
| Services | ||
| By Retail Format | E-Commerce Stores | |
| Brick-and-Mortar Stores | ||
| Omnichannel Retailers | ||
| Direct-to-Consumer Brands | ||
| By Geography | North America | United States |
| Canada | ||
| Mexico | ||
| Europe | United Kingdom | |
| Germany | ||
| France | ||
| Italy | ||
| Rest of Europe | ||
| Asia-Pacific | China | |
| Japan | ||
| India | ||
| South Korea | ||
| Rest of Asia-Pacific | ||
| Middle East | Israel | |
| Saudi Arabia | ||
| United Arab Emirates | ||
| Turkey | ||
| Rest of Middle East | ||
| Africa | South Africa | |
| Egypt | ||
| Rest of Africa | ||
| South America | Brazil | |
| Argentina | ||
| Rest of South America | ||


Key Questions Answered in the Report
How fast is spending on big data analytics in retail growing to 2031?
The market is projected to expand from USD 8.14 billion in 2026 to USD 12.68 billion by 2031, representing a 9.26% CAGR.
Which application area is set to grow the quickest?
Fraud Detection leads with a 10.76% CAGR through 2031 as retailers confront rising account-takeover and synthetic-identity attacks.
Why are Small and Medium Enterprises adopting analytics platforms more rapidly?
Usage-based cloud subscriptions and low-code AutoML tools reduce upfront costs and talent requirements, pushing SME revenue at a 9.61% CAGR.
What factors constrain wider cloud adoption in retail analytics?
Variable egress fees, data-residency compliance, and latency concerns around point-of-sale workloads remain primary hurdles.
Which region is likely to deliver the highest growth rate?
Asia-Pacific is forecast for an 11.01% CAGR, fueled by social-commerce ecosystems in China and digital payments expansion in India.
Page last updated on:


