Market Overview
| Study Period | 2020 - 2031 |
|---|---|
| Forecast Data Period | 2026 - 2031 |
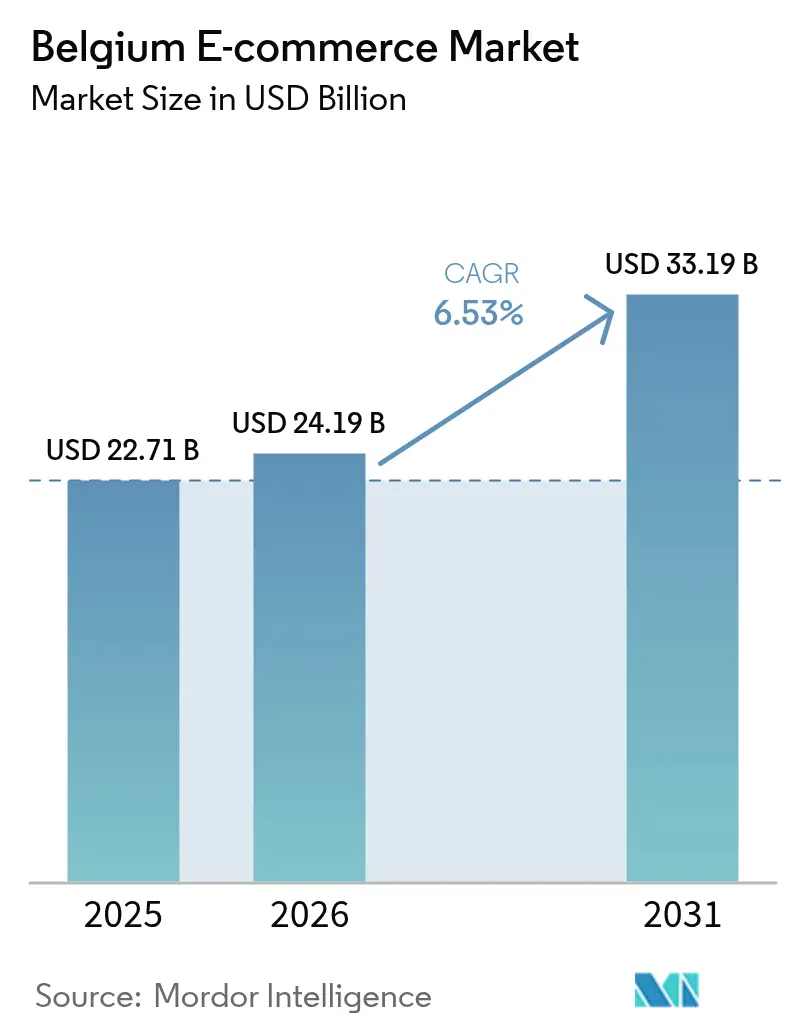
| Base Year Market Size (2025) | USD 22.71 Billion |
| Market Size (2026) | USD 24.19 Billion |
| Market Size (2031) | USD 33.19 Billion |
| Growth Rate (2026 - 2031) | 6.53% CAGR |
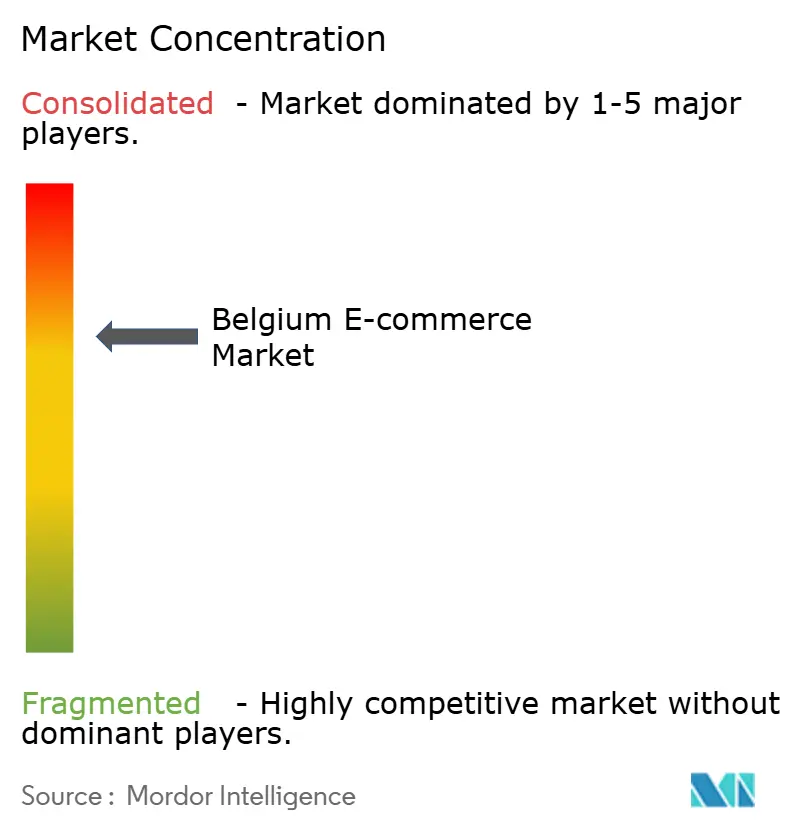
| Market Concentration | Medium |
Major Players *Disclaimer: Major Players sorted in no particular order Image © Mordor Intelligence. Reuse requires attribution under CC BY 4.0. | |
Belgium E-commerce Market Analysis by Mordor Intelligence
The Belgium e-commerce market size is expected to increase from USD 22.71 billion in 2025 to USD 24.19 billion in 2026 and reach USD 33.19 billion by 2031, growing at a CAGR of 6.53% over 2026-2031. Digitization investments accelerated after mandatory Peppol business-to-business e-invoicing began in January 2026, moving procurement online faster than anticipated. Same-day delivery is emerging as the new service baseline because the national logistics grid lets carriers reach most households within 90 minutes, raising capital-spend pressure on smaller webshops. Cross-border shopping already accounts for more than three-fifths of all orders, a dynamic that forces Belgian merchants to match the assortment and pricing depth of Dutch and German sellers. Tighter data-privacy rules and looming customs reforms will raise compliance costs, yet they also narrow the price gap with non-European Union rivals, opening space for hybrid grocers and specialty chains that combine online convenience with physical pickup.
Key Report Takeaways
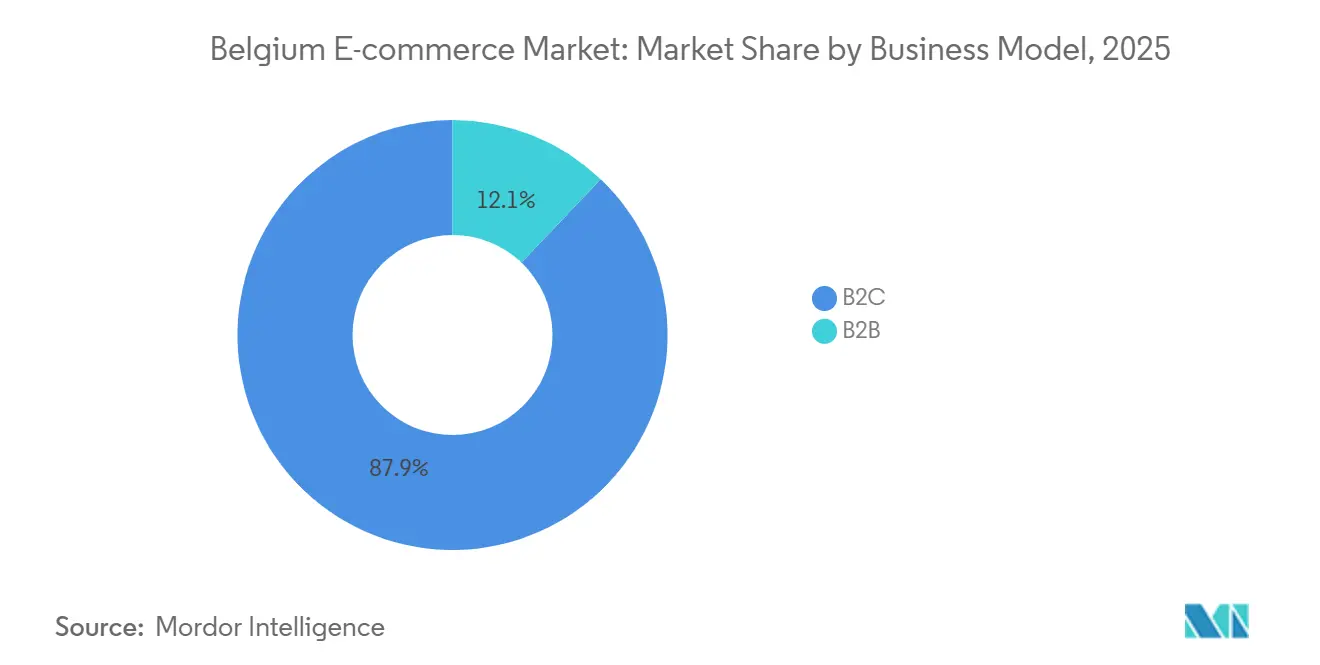
- By business model, business-to-consumer transactions commanded 87.89% revenue share in 2025 while business-to-business sales are projected to expand at a 7.11% CAGR through 2031.
- By device, smartphone and mobile channels contributed 57.27% of traffic in 2025, whereas desktop and laptop commerce is forecast to grow at a 7.17% CAGR through 2031.
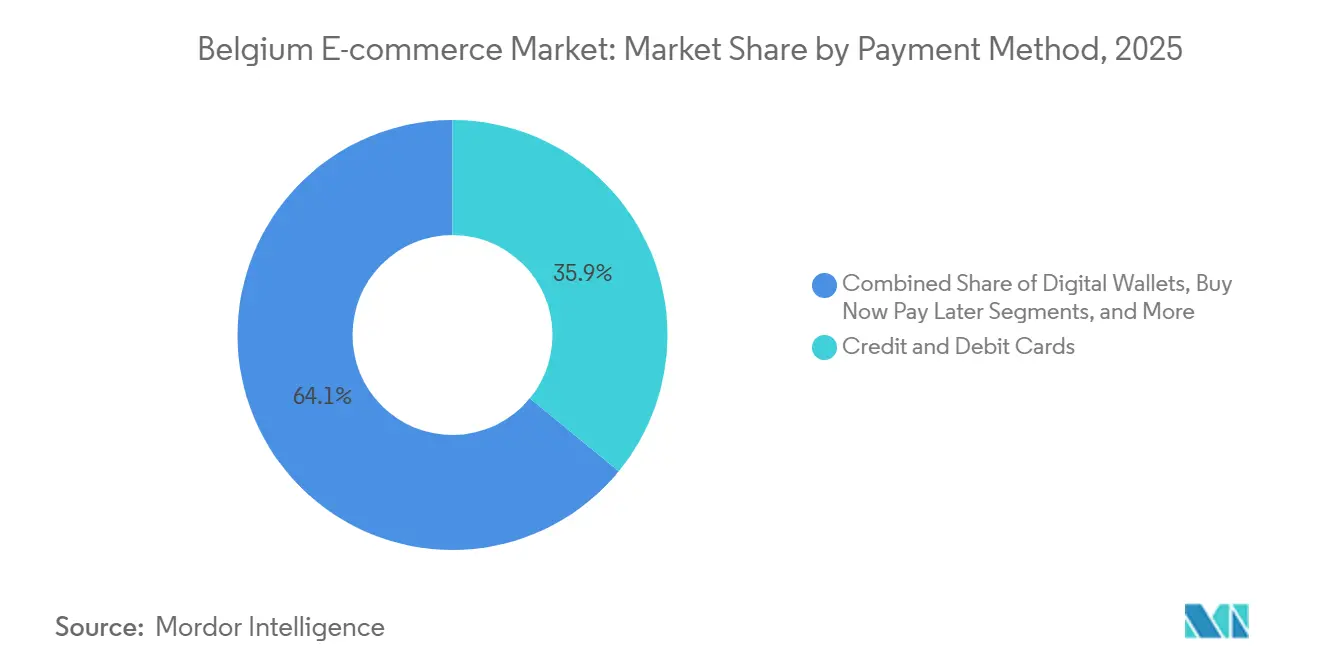
- By payment method, credit and debit cards held 35.92% share in 2025, yet buy-now-pay-later solutions are advancing at an 8.27% CAGR to 2031.
- By product category, fashion and apparel led with 27.89% revenue share in 2025, while food and beverages are poised to grow at an 8.16% CAGR through 2031.
Note: Market size and forecast figures in this report are generated using Mordor Intelligence’s proprietary estimation framework, updated with the latest available data and insights as of 2026.
Belgium E-commerce Market Trends and Insights
Drivers Impact Analysis*
| Driver | (~) % Impact on CAGR Forecast | Geographic Relevance | Impact Timeline |
|---|---|---|---|
| Dense National Logistics Network Enabling Same-Day Delivery Expectations | +1.8% | National, concentrated in Brussels-Capital, Antwerp, Ghent corridors | Short term (≤ 2 years) |
| Rapid EU Cross-Border Shopping Adoption Among Belgian Consumers | +1.5% | National, higher intensity in Brussels-Capital and border municipalities | Medium term (2-4 years) |
| Government-Backed Digital Voucher and Cashback Schemes for SMEs | +1.2% | Flanders, spillover to Wallonia and Brussels-Capital | Medium term (2-4 years) |
| Accelerating Click-And-Collect Integration by Brick-And-Mortar Chains | +1.0% | National, led by supermarket networks | Short term (≤ 2 years) |
| Surge in Social Commerce Adoption Among Gen-Z and Millennial Consumers | +0.9% | National, highest penetration in university cities | Medium term (2-4 years) |
| Rising Adoption of Embedded Finance Solutions by Belgian Marketplaces | +0.6% | National, early adoption in Brussels-Capital fintech ecosystem | Long term (≥ 4 years) |
| Source: Mordor Intelligence | |||


Dense National Logistics Network Enabling Same-Day Delivery Expectations
Belgium’s compact area and 96.4% internet penetration allow carriers to promise evening drop-off for orders placed before noon, a speed larger European markets struggle to replicate. bpost tripled its parcel-locker footprint to 2,500 units in 2025, lifting locker usage 44% year on year and signaling a consumer willingness to exchange home delivery for faster pickup at lower cost.[1]bpost, “Parcel Locker Expansion,” corporate.bpost.be Amazon committed USD 1 billion for nation-wide same-day service by 2027, partnering with bpost to leverage this network and pushing regional rivals toward micro-fulfillment investment. Grocery incumbent Colruyt achieved a 35% productivity gain in its automated Collect and Go warehouse, illustrating that physical chains can equal pure-play speed if last-mile hand-offs are mechanized. Municipal data from Mechelen shows the smart-locker model cuts delivery carbon emissions by 97%, aligning speed with sustainability targets.[2]City of Mechelen, “Smart Locker Network Sustainability Impact,” mechelen.be
Rapid EU Cross-Border Shopping Adoption Among Belgian Consumers
Sixty-two percent of Belgian online shoppers bought from other European Union sellers in 2025, a level above the EU-27 average and enabled by multilingual consumers comfortable with Dutch, French and English storefronts. Gen-Z shoppers averaged more than 60 cross-border purchases a year, using social media for price discovery that ignores borders. The proposed removal of the EUR 150 (USD 165) de minimis customs exemption by 2028 will raise landed costs for Chinese platforms, potentially steering demand back toward European Union merchants if they can close the current 15-20% price gap. Belgium’s role as one of six member states monitoring 89% of direct imports under the new enforcement toolbox gives customs authorities fee revenue but also imposes paperwork burdens that smaller sellers may find prohibitive.[3]European Parliament, “Consumer Credit Directive 2,” europarl.europa.eu
Government-Backed Digital Voucher and Cashback Schemes for SMEs
Flanders’ VLAIO SME e-wallet reimbursed up to EUR 7,500 (USD 8,250) per company in 2025 for e-commerce training and platform setup, lifting online penetration of small retailers 10-15 percentage points above Walloon peers. The mandatory two-delivery-option rule forced merchants to add click-and-collect or locker pickup, a compliance hurdle that aggregators like Qpon converted into turnkey packages. Cashback incentives spurred 72% of regular shoppers to participate in consumer-to-consumer resale communities, deepening the digital habit. Extension of Peppol e-invoicing to all value-added tax-liable firms in 2026 spreads the digitization ripple from consumer to procurement flows.
Accelerating Click-And-Collect Integration by Brick-And-Mortar Chains
Colruyt merged its Colruyt and Bio-Planet online shops, unified assortments and launched a checkout-free Smart Cart that scans goods in motion, blending store convenience with digital speed. Delhaize’s free in-store collection raised online volumes 20%, demonstrating how shifting fulfillment to the customer protects margins. Carrefour aims for EUR 10 billion (USD 11 billion) in online gross merchandise value by 2026, half of which is projected to originate from click-and-collect orders. Lidl hosts 240 bpost lockers, showing non-grocery chains also benefit when pickup traffic doubles as in-store footfall.
Restraints Impact Analysis*
| Restraint | (~) % Impact on CAGR Forecast | Geographic Relevance | Impact Timeline |
|---|---|---|---|
| Persistently High Preference for In-Store Payment and Pick-Up in Flanders | -0.8% | Flanders, rural and peri-urban municipalities | Medium term (2-4 years) |
| Scarcity of Domestic Pure-Play Marketplaces Limiting Merchant Choice | -0.6% | National, acute in Wallonia and smaller cities | Long term (≥ 4 years) |
| Urban Last-Mile Congestion Surcharges Increasing Fulfillment Costs | -0.5% | Brussels-Capital, Antwerp, Ghent, Liège urban cores | Short term (≤ 2 years) |
| Heightened Data-Privacy Concerns Limiting First-Party Tracking | -0.4% | National, EU-wide GDPR enforcement | Medium term (2-4 years) |
| Source: Mordor Intelligence | |||
Persistently High Preference for In-Store Payment and Pick-Up in Flanders
Flemish consumers over 50 remain 30% more likely than Brussels residents to pay with cash, reinforcing a cultural bias toward tactile product inspection that holds e-commerce penetration 15-20 points below the capital.[4]Febelfin, “Digital Payments Barometer 2025,” febelfin.be Strict Dutch-language compliance fines add cost for cross-border sellers and shield local stores from external competition. The click-and-collect mandate lets shoppers open parcels before paying, a habit that lifted return rates 8-10% versus home delivery and eroded expected savings.
Scarcity of Domestic Pure-Play Marketplaces Limiting Merchant Choice
Foreign giants Amazon, bol.com and Zalando captured 56% of spend in 2025, leaving Belgian merchants to pay 15-20% commissions and surrender customer data. Qpon remains subscale because it lacks funds for national fulfillment or negotiated carrier rates, keeping the domestic capture rate below 50%. Digital Markets Act gatekeeper rules have yet to deliver meaningful interoperability benefits, so local sellers still rely on foreign check-out stacks that constrain branding and margin.
*Our forecasts treat driver/restraint impacts as directional, not additive. The impact forecasts reflect baseline growth, mix effects, and variable interactions.
Segment Analysis
By Business Model: B2B Digitization Accelerates Post-Peppol
Business-to-business activity accounted for 12.11% of the Belgium e-commerce market share in 2025, yet the Belgium e-commerce market size for this segment is forecast to expand at a 7.11% CAGR between 2026-2031 as every value-added-tax payer must now issue Peppol-compliant e-invoices. Peppol portals bundle catalog search, automated three-way matching and net-30 credit, giving manufacturers and distributors a structured workflow that reduces reconciliation time by 40%. The Flemish VLAIO e-wallet reimburses up to EUR 7,500 (USD 8,250) per firm for digital training, letting smaller suppliers meet Peppol requirements without heavy upfront cost VLAIO.BE. Embedded finance modules inside marketplaces then extend working-capital loans, so suppliers secure orders and liquidity in one interface.
Business-to-consumer remains the volume anchor with an 87.89% Belgium e-commerce market share but grows slightly slower at a 6.53% CAGR. Mobile sessions dominate browsing, yet 91% of shoppers demand Bancontact plus at least one buy-now-pay-later option at checkout, forcing even niche sellers to upgrade their payment stacks. Social commerce converts 29% of 16-39-year-olds, but repeat orders hinge on seamless returns and real-time support. As B2B platforms gain scale, they reuse consumer-grade user experience and cloud logistics, blurring the historical line between the two models.

By Device Type for B2C E-Commerce: Desktop Resurgence in High-Ticket Categories
Smartphones captured 57.27% of traffic in 2025, yet desktop regained relevance for baskets above EUR 200 (USD 220) because buyers compare specifications across multiple tabs, lifting its conversion rates 8-12 points over mobile. Consequently, desktop and laptop sales are projected to grow at a 7.17% CAGR through 2031, faster than handheld devices. Belgium’s 45% 5G penetration improves mobile video and livestream shopping, but procurement portals and configurable products still favor large screens.
Zalando’s DeepAR-powered virtual fitting rooms, rolled out in April 2025, cut apparel returns by 7% among one million Belgian users, narrowing the ergonomic gap between phone and PC. Still, multi-stakeholder purchases such as office furniture or electronics bundles flow to desktops because corporate buyers need approval chains and side-by-side spec views. The coexistence of touch and keyboard interfaces therefore persists, with desktop expected to hold roughly 35-40% Belgium e-commerce market size in value terms through 2031.
By Payment Method for B2C E-Commerce: Buy-Now-Pay-Later Surges as Cards Plateau
Credit and debit cards controlled 35.92% of transactions in 2025, but fee-capped micro-credit transformed the landscape after the Consumer Credit Directive 2 limited charges on loans below EUR 150 (USD 165) to EUR 20 (USD 22). Buy-now-pay-later now posts an 8.27% CAGR, gaining rapid share in fashion and electronics where average order values sit between EUR 80-150 (USD 88-165). Bancontact still commands day-to-day payments thanks to low interchange, while PayPal, Apple Pay and Google Pay together reach nearly one-third of online checkouts.
Merchants balance BNPL’s 3-5% discount rates against uplifts in basket size and conversion, especially during flash sales. Belgian Data Protection Authority rules prevent sites from pre-selecting BNPL without consent, adding one click to first-time use but steering advertisers toward contextual triggers. Embedded-finance offerings on B2B portals mirror this shift, packaging net-60 terms and credit scoring to retain enterprise buyers and stabilize cash flow across seasonal peaks.

By Product Category for B2C E-Commerce: Food and Beverages Outpace Fashion
Fashion led 2025 spend with a 27.89% Belgium e-commerce market share, yet growth moderates as urban penetration nears saturation. In contrast, food and beverages are projected to climb at an 8.16% CAGR, the fastest among major categories, helped by Delhaize’s Forest hub that doubled weekly capacity to 50,000 orders after a EUR 53 million (USD 58 million) investment. Colruyt’s November 2025 merger of Colruyt and Bio-Planet webshops also unified loyalty schemes, cross-selling organic lines to mainstream shoppers.
Electronics builds momentum via refurbished programs from MediaMarkt and Coolblue, tapping eco-conscious buyers and preserving margin. Furniture lags due to bulky returns, though Ikea’s augmented-reality room app and click-and-collect promise gradual lift. The grocery market’s top five chains already hold 85% of offline revenue, so their online ramp shapes supply-chain standards for chilled fulfillment and delivery-slot pricing. As hybrid grocers refine dark-store operations, they will capture disproportionate share of incremental Belgium e-commerce market size growth to 2031.
Geography Analysis
Flanders represented more than 52% of national spend in 2025 yet lags Brussels-Capital on digital adoption because older consumers prefer cash and click-and-collect inspection. Strict Dutch-language rules discourage overseas sites, shielding local chains but limiting variety for shoppers. Logistics corridors between Antwerp, Ghent and Leuven benefit from bpost locker density and Amazon’s coming same-day roll-out, though rural Limburg waits longer for delivery.
Brussels-Capital punches above population weight, delivering roughly one-quarter of sales thanks to high income, multilingual residents and expatriates. Delhaize’s Forest hub shaves six hours off grocery lead times, while congestion surcharges raise pure-play last-mile costs by up to 12%, nudging operators toward locker partnership. Social commerce penetration nears 40% among 16-39-year-olds, fueling influencer conversions in fashion and beautyE.
Wallonia captures around 24% of sales, below its population share, because lower income and fragmented SME grants delay online uptake. Carrefour’s dense click-and-collect grid moderates fulfillment costs, but same-day service remains limited outside Liège logistics hubs. Proposed customs roles could channel fee revenue into the region, yet the benefit accrues mainly to carriers rather than consumer-facing merchants.
Competitive Landscape
Foreign platforms control a majority of spending, giving the Belgium e-commerce market a moderate concentration profile. Amazon’s USD 1 billion same-day plan and bol.com’s two-thirds third-party share illustrate network effects that local startups struggle to counter. Zalando’s ABOUT YOU deal consolidates fashion and its AI assistant slices return rates, delivering a cost edge traditional retailers cannot match.
Grocery incumbents fight back with automation: Colruyt’s Skypod robots lift productivity 35% and Delhaize’s free pickup grows orders 20%. Carrefour exploits retail-media assets through Carrefour Links, monetizing first-party audiences now that cookie-based ads fade under Belgian Data Protection Authority rulings.
White-space remains in embedded finance and social commerce. Marketplaces that extend net-30 credit or build creator onboarding pipelines can deepen merchant stickiness. Subscale aggregators such as Qpon gain relevance because compliance rules oblige small shops to offer multiple delivery modes but cannot justify in-house builds .
Belgium E-commerce Industry Leaders
bol.com B.V.
Coolblue B.V.
Amazon EU SARL
Zalando SE
Vanden Borre NV
- *Disclaimer: Major Players sorted in no particular order

Recent Industry Developments
- January 2026: Zalando secured more than 90% shareholder acceptance for its takeover of ABOUT YOU, creating a unified fashion platform across German-speaking and Benelux markets.
- January 2026: Mandatory Peppol e-invoicing took effect for all Belgian value-added tax payers, accelerating procurement digitization.
- December 2025: bpost opened the first bbox boutiques in Brussels and Antwerp, pairing lockers with retail space to trim last-mile costs.
- November 2025: Colruyt merged its Colruyt and Bio-Planet webshops, streamlining assortment and user experience.


Belgium E-commerce Market Report Scope
B2 B E-commerce and B2C E-commerce segment the Belgium e-commerce market. By B2C E-commerce, the market studied is further subdivided into beauty & personal care, consumer electronics, fashion & apparel, food & beverage, and furniture & home. The report studies the impact of covid-19 on the studied market.
The Belgium E-commerce Market Report is Segmented by Business Model (B2B, B2C), Device Type for B2C E-commerce (Smartphone and Mobile, Desktop and Laptop, Other Device Types), Payment Method for B2C E-commerce (Credit and Debit Cards, Digital Wallets, Buy Now Pay Later, Other Payment Methods), Product Category for B2C E-commerce (Beauty and Personal Care, Consumer Electronics, Fashion and Apparel, Food and Beverages, Furniture and Home, Other Product Categories), and Geography. The Market Forecasts are Provided in Terms of Value (USD).
By Business Model
| B2B |
| B2C |
By Device Type for B2C E-Commerce
| Smartphone and Mobile |
| Desktop and Laptop |
| Other Device Types |
By Payment Method for B2C E-Commerce
| Credit and Debit Cards |
| Digital Wallets |
| Buy Now Pay Later |
| Other Payment Methods |
By Product Category for B2C E-Commerce
| Beauty and Personal Care | Hair Care |
| Skin Care | |
| Cosmetics and Beauty | |
| Other Beauty and Personal Care Product Categories | |
| Consumer Electronics | Mobile |
| PC and Laptops | |
| Audio Devices | |
| Gaming Devices | |
| Other Consumer Electronics Product Categories | |
| Fashion and Apparel | Clothing |
| Footwear | |
| Fashion Accessories | |
| Other Fashion and Apparel Product Categories | |
| Food and Beverages | Packaged Food |
| Bakery and Confectionery | |
| Meat, Poultry, and Seafood | |
| Other Food and Beverages Product Categories | |
| Furniture and Home | Home Furniture |
| Office Furniture | |
| Outdoor Furniture | |
| Other Furniture and Home Product Categories | |
| Other Product Categories |
| By Business Model | B2B | |
| B2C | ||
| By Device Type for B2C E-Commerce | Smartphone and Mobile | |
| Desktop and Laptop | ||
| Other Device Types | ||
| By Payment Method for B2C E-Commerce | Credit and Debit Cards | |
| Digital Wallets | ||
| Buy Now Pay Later | ||
| Other Payment Methods | ||
| By Product Category for B2C E-Commerce | Beauty and Personal Care | Hair Care |
| Skin Care | ||
| Cosmetics and Beauty | ||
| Other Beauty and Personal Care Product Categories | ||
| Consumer Electronics | Mobile | |
| PC and Laptops | ||
| Audio Devices | ||
| Gaming Devices | ||
| Other Consumer Electronics Product Categories | ||
| Fashion and Apparel | Clothing | |
| Footwear | ||
| Fashion Accessories | ||
| Other Fashion and Apparel Product Categories | ||
| Food and Beverages | Packaged Food | |
| Bakery and Confectionery | ||
| Meat, Poultry, and Seafood | ||
| Other Food and Beverages Product Categories | ||
| Furniture and Home | Home Furniture | |
| Office Furniture | ||
| Outdoor Furniture | ||
| Other Furniture and Home Product Categories | ||
| Other Product Categories | ||


Key Questions Answered in the Report
What is the projected value of Belgium e-commerce in 2031?
Forecasts place the market at USD 33.19 billion by 2031, reflecting a 6.53% CAGR from 2026.
How quickly is buy-now-pay-later growing in Belgium online shopping?
BNPL transactions are expected to rise at an 8.27% annual pace through 2031, the fastest among payment types.
Which Belgian region spends the most online per capita?
Brussels-Capital leads in per-capita online spending thanks to its young, high-income, multilingual population.
Why will food and beverage e-commerce outpace fashion growth?
New automated distribution hubs and expanded click-and-collect networks cut fulfilment costs, lifting grocery online adoption at an 8.16% CAGR.
How does Peppol e-invoicing affect Belgian B2B online sales?
The January 2026 mandate compels all value-added tax-liable firms to adopt structured e-invoicing, propelling B2B e-commerce at a 7.11% CAGR.
What logistics trend is setting the new service benchmark in Belgium?
Same-day delivery is becoming standard because the dense national network lets carriers reach most households within hours.
Page last updated on:


