Market Overview
| Study Period | 2020 - 2031 |
|---|---|
| Forecast Data Period | 2026 - 2031 |
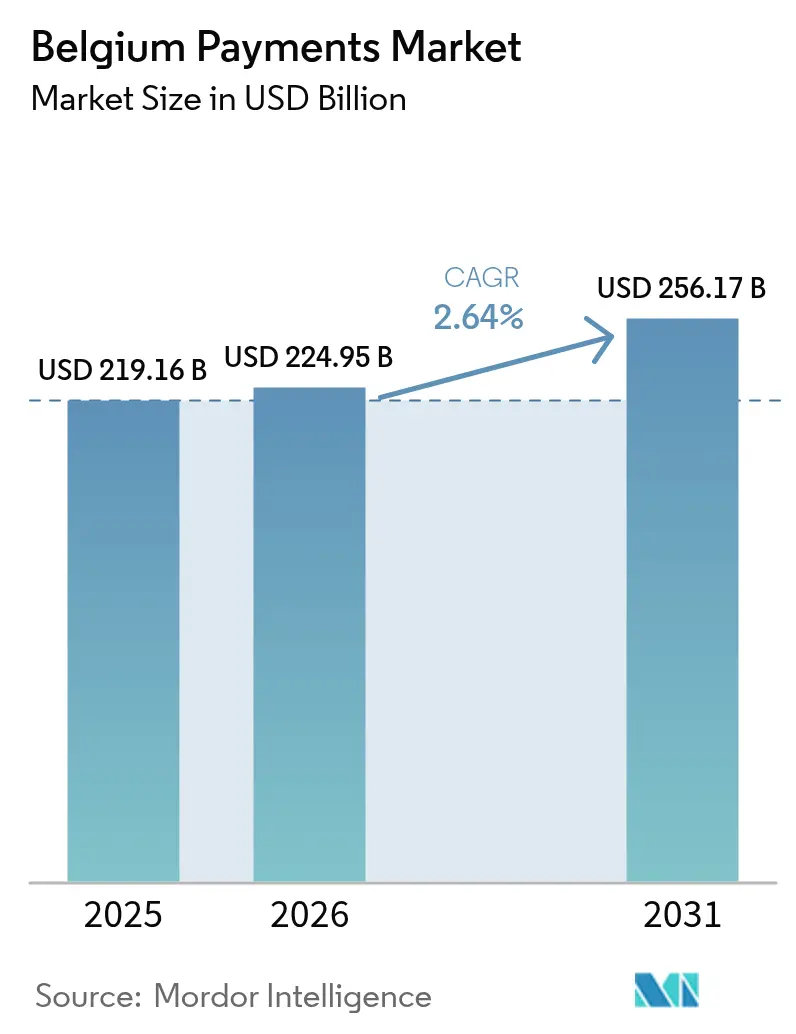
| Base Year Market Size (2025) | USD 219.16 Billion |
| Market Size (2026) | USD 224.95 Billion |
| Market Size (2031) | USD 256.17 Billion |
| Growth Rate (2026 - 2031) | 2.64% CAGR |
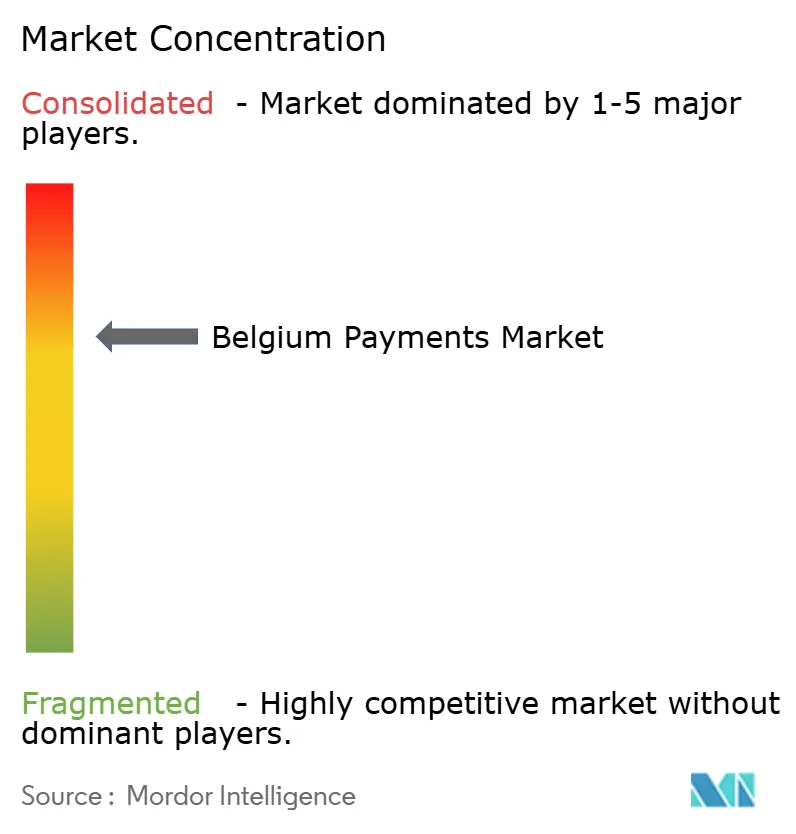
| Market Concentration | Medium |
Major Players*Disclaimer: Major Players sorted in no particular order Image © Mordor Intelligence. Reuse requires attribution under CC BY 4.0. | |
Belgium Payments Market Analysis by Mordor Intelligence
The Belgium payments market size is expected to grow from USD 219.16 billion in 2025 to USD 224.95 billion in 2026 and is forecast to reach USD 256.17 billion by 2031 at 2.64% CAGR over 2026-2031. Growth remains steady rather than rapid because Belgium is a highly banked, mature economy where debit cards already dominate and four in five adults hold at least one digital wallet. Structural momentum comes from rising contactless limits, instant-payment regulation, and merchants that now treat account-to-account checkout as a direct substitute for card rails. Bancontact, which processed 2.5 billion transactions in 2024, underpins everyday commerce, yet open-banking APIs and the European Payment Initiative’s Wero wallet are accelerating adoption of lower-cost payment initiation.
Key Report Takeaways
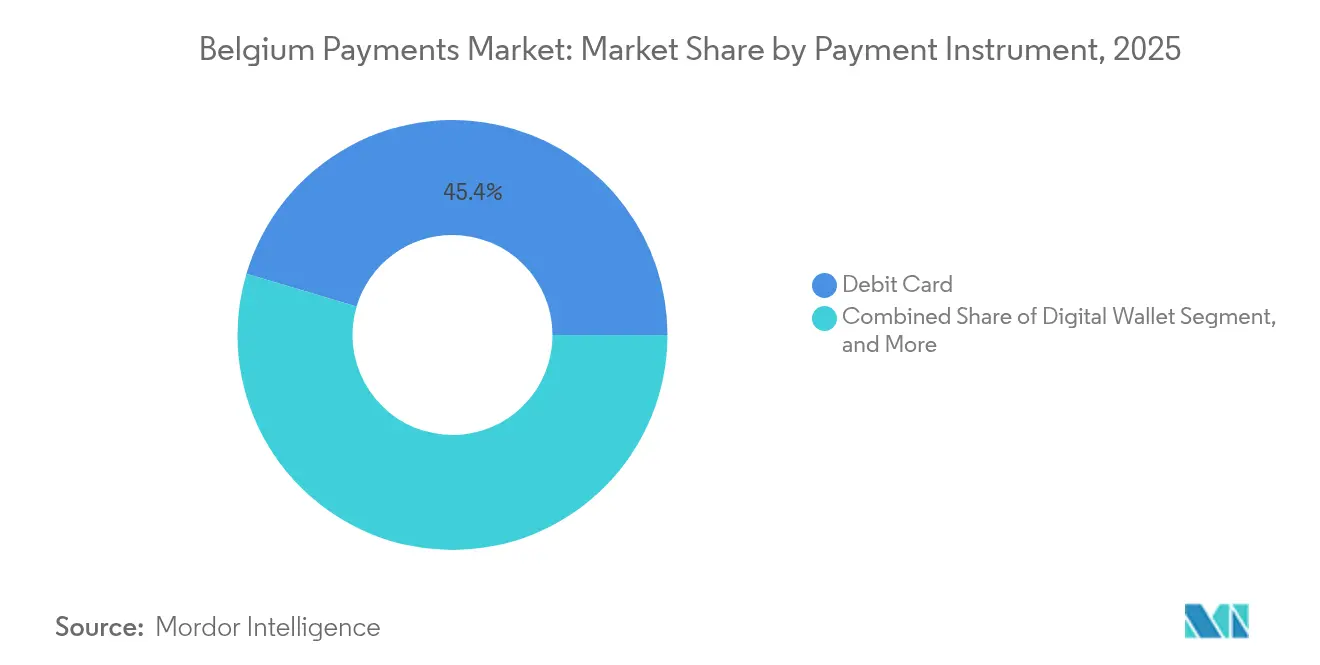
- By payment instrument, debit cards led with 45.40% Belgium payments market share in 2025, while digital wallets are forecast to expand at a 3.05% CAGR through 2031.
- By payment channel, point-of-sale held 71.05% of the Belgium payments market in 2025, whereas mobile in-app transactions are projected to grow at a 2.79% CAGR to 2031.
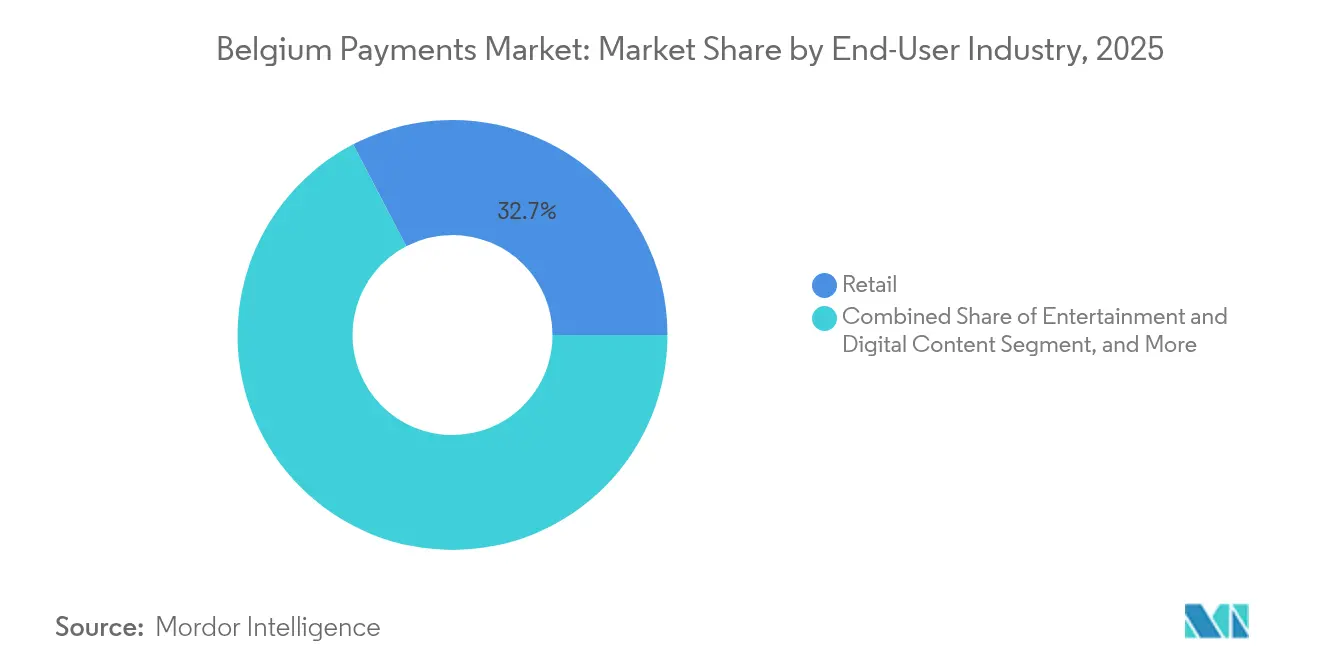
- By end-user industry, retail captured 32.65% of transaction value in 2025, and entertainment and digital content is advancing at a 3.72% CAGR to 2031.
- By transaction type, domestic payments represented 87.85% of value in 2025, yet cross-border flows are set to rise at a 3.41% CAGR between 2026 and 2031.
Note: Market size and forecast figures in this report are generated using Mordor Intelligence’s proprietary estimation framework, updated with the latest available data and insights as of 2026.
Belgium Payments Market Trends and Insights
Drivers Impact Analysis*
| Driver | (~) % Impact on CAGR Forecast | Geographic Relevance | Impact Timeline |
|---|---|---|---|
| Surge in Contactless Payments Limits and Adoption | +0.50% | National, with higher penetration in Brussels and Flanders | Short term (≤ 2 years) |
| Expansion of Open Banking APIs Under PSD2 | +0.40% | National, aligned with EU-wide PSD2 implementation | Medium term (2-4 years) |
| Growth of E-Commerce Penetration and Omnichannel Retail | +0.40% | National, with concentration in urban centers (Brussels, Antwerp, Ghent) | Medium term (2-4 years) |
| Government Push for Digital Invoicing and Tax Compliance | +0.30% | National, mandatory for B2B from January 2026 | Medium term (2-4 years) |
| Mandatory Bancontact Mobile Integration by Public Transport Operators | +0.20% | National, early deployment in Brussels (STIB-MIVB), rolling out to De Lijn and TEC | Short term (≤ 2 years) |
| Digital Euro Pilot Increasing A2A Retail Payment Awareness | +0.20% | National, with ECB coordination across eurozone | Long term (≥ 4 years) |
| Source: Mordor Intelligence | |||
Surge in Contactless Payments Limits and Adoption
Belgium’s contactless penetration reached 79% of adults in 2024, nearly doubling its pre-pandemic level. Merchants and issuers are piloting biometric authentication to raise the EUR 25 tap-and-go ceiling so larger baskets migrate from cash to cards. Bancontact alone processed more than 1.1 billion contactless transactions in 2022, reinforcing acquirer fee income.[1]Payconiq by Bancontact, “Payconiq by Bancontact homepage,” payconiq.be The European Payments Council’s effort to harmonize QR-based contactless standards will lower terminal costs for independent retailers. With transport systems already accepting contactless cards, consumer confidence in tap-to-pay is spreading from urban hubs into provincial shopping districts.
Expansion of Open Banking APIs Under PSD2
Four major banks BNP Paribas Fortis, Belfius, KBC, and ING now expose Berlin Group–based APIs, allowing third-party providers to trigger instant payments once customers consent. Worldline’s Bank Transfer by Worldline, launched in October 2024, lets merchants sweep funds directly from consumer accounts and settle next day, saving roughly 15 basis points versus credit-card interchange.[2]Worldline, “Worldline launches Bank Transfer by Worldline,” worldline.com Mastercard’s June 2024 link-up with bunq and Deutsche Bank’s June 2025 pact with Mastercard show global networks racing to keep a foothold in account-to-account commerce. Belgian marketplaces already report lower chargeback rates when shoppers choose bank-redirect checkout, pushing PSPs to prioritize API reliability and consent flows.
Growth of E-Commerce Penetration and Omnichannel Retail
J.P. Morgan’s 2024 benchmarking placed Belgium behind regional peers on e-commerce intensity, indicating upside as retailers unify store, web, and app journeys. Stripe supports Bancontact for more than 80% of Belgian online businesses, eliminating local-method barriers for cross-border sellers.[3]Stripe, “Klarna payments | Stripe Documentation,” stripe.com Merchants adopting omnichannel payment orchestration see higher basket values because loyalty points, stored credentials, and consistent refund policies build trust. The 2023 Digital Economy and Society Index ranked Belgium fifth in business digital-technology integration, yet public-service digitalization lagged; the 2026 e-invoicing mandate is designed to close that gap.[4]European Commission, “Belgium in the Digital Economy and Society Index,” digital-strategy.ec.europa.eu
Government Push for Digital Invoicing and Tax Compliance
From January 2026, Belgian businesses must issue and receive invoices in Peppol format, creating real-time audit trails for value-added-tax calculation. Large enterprises are already embedding AP automation modules that match invoices and trigger SEPA Instant Credit Transfers, shaving reconciliation cycles from days to minutes. PSPs see a revenue opportunity in bundling invoice workflow, working-capital finance, and payment initiation into a single dashboard, effectively monetizing both software subscription and transaction fees. The policy aligns with wider EU efforts to standardize cross-border invoicing, simplifying treasury management for multinationals headquartered in Brussels.
Restraints Impact Analysis*
| Restraint | (~) % Impact on CAGR Forecast | Geographic Relevance | Impact Timeline |
|---|---|---|---|
| Ageing Population Maintaining Cash Usage | -0.30% | National, with higher cash preference in Wallonia and rural areas | Long term (≥ 4 years) |
| High Interchange Fees for Small Merchants | -0.20% | National, disproportionate impact on independent retailers and hospitality | Medium term (2-4 years) |
| Fragmented QR Code Standards Blocking Unified Acceptance | -0.20% | National, affecting merchant acceptance infrastructure | Short term (≤ 2 years) |
| Supply Chain Cyber Attacks on Belgian Processors | -0.20% | National, with spillover risk to EU payment infrastructure | Short term (≤ 2 years) |
| Source: Mordor Intelligence | |||
Ageing Population Maintaining Cash Usage
Thirty-one percent of citizens still regard cash as essential for daily life; a proportion skewed toward older demographics and rural Wallonia. Legislation enacted in April 2023 obliges merchants to accept notes and coins for transactions below EUR 3,000, preventing retailers from going fully digital. While average cash holdings slipped from EUR 61 in 2019 to EUR 56 in 2022, ATM upkeep and cash-handling costs remain material line items for banks and grocers.
High Interchange Fees for Small Merchants
Even though debit interchange is capped at 0.1%, owners of cafés and convenience stores cite all-in payment-acceptance costs terminal rental, PSP fees, and monthly minimums as disincentives. Many still impose EUR 5 minimums for card use nudging customers back to cash. Partnerships such as Viva.com and Beobank’s June 2024 offer of Tap-on-Any-Device terminals aim to relieve upfront hardware costs. Yet fragmented advocacy among thousands of micro-merchants means fee reform could linger as a policy debate through 2027.
*Our forecasts treat driver/restraint impacts as directional, not additive. The impact forecasts reflect baseline growth, mix effects, and variable interactions.
Segment Analysis
By Payment Instrument: Debit Strength Meets Wallet Acceleration
Debit cards accounted for 45.40% of the Belgium payments market in 2025, anchored by 17 million Bancontact cards embedded in everyday retail. The Belgium payments market size for debit usage reflects deep consumer trust in local rails and ATM ubiquity. Bancontact’s low-fee model keeps acceptance costs attractive to independent merchants, while dual-branding with Maestro or Visa Debit delivers cross-border utility. Nevertheless, digital wallets are forecast to grow at a 3.05% CAGR, outpacing all other instruments as Payconiq by Bancontact, Apple Pay, and Google Pay reach mass acceptance on public transport and in quick-service restaurants.
Global Super Apps are absent, so domestic providers enjoy breathing room to merge loyalty programs, transit tickets, and QR-invoice settlement inside a single interface. Mastercard’s open-banking toolkit, integrated into bunq in 2024, hints at a future where wallets embed account-to-account payments that bypass card interchange. Credit cards remain niche, favoured for travel bookings and subscription streaming, yet co-branded offerings such as Brussels Airlines and Beobank’s 2025 launch illustrate how issuers add insurance and lounge access to invigorate usage. Buy Now Pay Later penetration stays vertical-specific fashion and entertainment supported by Klarna’s Stripe integration. Cash’s share slipped below 45% but remains protected by legal tender rules, ensuring physical notes coexist with digital rails.


By Payment Channel: Point-of-Sale Dominance, Mobile In-App Momentum
Point-of-sale retained 71.05% share of the Belgium payments market in 2025 as dense grocery and hospitality networks lean on contactless cards. The Belgium payments market size for in-store purchases grows modestly because saturation levels are high, yet value per transaction edges upward when tap-and-go ceilings adjust. Urban transit modernization delivers spillover benefits: STIB-MIVB’s June 2024 rollout lets riders pay fares via cards or wallets, proving that infrastructure designed for speed can redirect consumer expectations for physical checkout.
Mobile in-app payments, though a smaller base, are forecast to expand 2.79% annually to 2031. Retailers are bundling click-and-collect journeys with loyalty apps, driving more wallet credentials into cloud vaults instead of plastic. Universal QR codes under review by the European Payments Council are likely to blur distinctions between online, in-app, and kiosk payments, letting merchants maintain one integration. Self-service vending and in-car payments remain nascent but strategic; automotive OEMs are embedding fuel and parking checkout inside infotainment systems, eyeing recurring revenue from transaction fees.
By End-User Industry: Retail Scale, Entertainment Velocity
Retail represented 32.65% of 2025 payment value, making supermarkets, department stores, and fashion chains the anchor vertical for PSP revenue. High terminal density and Bancontact’s near-ubiquitous acceptance keep checkout friction low. Issuers have introduced real-time card-linked offers that apply discounts at payment, increasing average basket value while retaining margin for retailers.
Entertainment and digital content is projected to grow fastest at 3.72% CAGR, driven by subscription streaming, in-game purchases, and event ticketing that require stored credentials. The Belgium payments market size for these vertical benefits from Klarna’s BNPL integration, which cuts abandonment and stretches consumer budgets. Healthcare, while smaller, is steadily digitizing as hospitals adopt electronic claims and diagnosis-related-group billing, pushing patients toward portals that bundle appointment scheduling, invoice presentation, and wallet checkout. Hospitality brands leverage virtual card numbers for corporate bookings, and utilities are migrating to SEPA Direct Debit to curb involuntary churn, giving acquirers sticky recurring volume.
By Transaction Type: Domestic Core, Cross-Border Upside
Domestic payments held 87.85% share in 2025 thanks to Bancontact’s dominance and Belgium’s compact geography. Instant euro credit transfers, mandatory for all PSPs to receive by January 2025, further anchor domestic flows by delivering card-like immediacy without interchange. The Belgium payments market share of domestic volume will remain high, yet pricing pressure will intensify as merchants demand same-day settlement.
Cross-border transactions are forecast to climb 3.41% per year, buoyed by Brussels’ status as EU headquarters and the presence of global logistics hubs. Visa’s January 2024 pact with Revolut enabling 30-minute international card-to-card payouts exemplifies competition among networks to capture SME treasury flows. Mastercard’s November 2024 alliance with Citi adds FX conversion and tracking to enhance corporate visibility. Regulation 2024/886, which equalizes pricing for instant and non-instant euro transfers, shrinks the cost edge card schemes once enjoyed, steering corporates toward account-to-account rails.
Geography Analysis
Brussels, housing EU institutions and NATO, generates outsized demand for multi-currency acceptance and expense-management cards. Merchants near the European Quarter rely on dynamic-currency-conversion-compliant terminals so visiting delegates can pay in home currencies without surprise markups. Flanders, encompassing Antwerp, Ghent, and Bruges, leads digital uptake.
Higher average incomes and denser university populations boost mobile-wallet penetration, while Antwerp’s port community drives B2B invoice automation. Wallonia exhibits slower digital growth; older demographics and rural dispersion sustain cash dependence, yet industrial clusters in Liège and Charleroi are early adopters of Peppol e-invoicing to streamline supply-chain payments.
TARGET Instant Payment Settlement connects Belgian banks to pan-European real-time rails, clearing cross-border euro transfers in under 10 seconds. Wero’s 2024 peer-to-peer launch selected Belgium as one of three debut markets, leveraging the country’s multilingual base to test multi-lingual interfaces before broader EU rollout. Tourism-heavy Bruges and Brussels handle over 10 million foreign visitors annually, reinforcing acceptance of international card brands and wallets. Currency-conversion fee transparency rules enforced since 2019 guard tourists from hidden spreads, nudging acquirers to adopt mid-market FX or disclose markups clearly.
Competitive Landscape
Bancontact Payconiq Company remains the anchor scheme, but the Belgium payments market shows moderate concentration as PSPs, acquirers, and wallets converge. Worldline renewed its issuing pact with BNP Paribas Fortis for five years in February 2024 and added Bank Transfer by Worldline to harvest account-to-account volume. January 2025’s Wix tie-up embeds checkout inside website builders, matching Stripe’s strategy of platform-native acceptance. Stripe supports Bancontact natively and enabled Klarna BNPL in May 2025, widening its merchant base and squeezing acquirer margins.
Adyen processed EUR 1 trillion in volume during 2024, unveiling its AI-driven revenue-optimization engine to lift approval rates by leveraging network-token data. Venly, accepted into Mastercard’s 2025 Start Path program, targets embedded NFT and tokenized use cases for loyalty. The EU’s Cyber Resilience Act, effective 2024, favours processors with deep security budgets, increasing compliance overhead for fintech entrants but yielding opportunity for managed-security vendors tailored to PSP workloads.
White-space revenue resides in vertical software: hospitality PMS suites integrating Pay-by-Link, utility billing platforms bundling SEPA Direct Debit, and property rental portals embedding split-payments for security deposits. As domestic debit margins thin, incumbents are betting on value-added services data analytics, loyalty engines, deferred settlement to preserve take-rate. Market entrants are equally focused on API breadth, knowing merchants will favour providers offering terminals, web SDKs, and ERP plugins from a single stack.
Belgium Payments Industry Leaders
Bancontact Payconiq Company
Visa Inc.
PayPal Payments Private Limited
American Express Company
Sofort GmbH (Klarna Group)
- *Disclaimer: Major Players sorted in no particular order

Recent Industry Developments
- June 2025: Deutsche Bank and Mastercard partnered to let European merchants, including Belgian sellers, accept open-banking payments that settle faster and cost less than cards.
- March 2025: Brussels Airlines, Beobank, and Mastercard issued three co-branded credit cards offering up to 100,000 Miles and More points and 11 insurance covers.
- January 2025: Worldline joined forces with Wix to embed payment acceptance for Belgian SMEs building online storefronts.
- January 2025: Venly entered Mastercard’s Start Path Blockchain program to scale its Wallet-as-a-Service and NFT API.


Belgium Payments Market Report Scope
The Belgium Payments Market Report is Segmented by Payment Instrument (Debit Card, Credit Card, A2A Payments, Digital Wallet, Buy Now Pay Later, Cash, Other Payment Instruments), Payment Channel (Point of Sale, Online, Mobile In-App, In-Car, Self-Service Kiosk), End-User Industry (Retail, Entertainment and Digital Content, Healthcare, Hospitality and Travel, Utilities, Others), and Transaction Type (Domestic, Cross-Border, Recurring Bill Pay). The Market Forecasts are Provided in Terms of Value (USD).
By Payment Instrument
| Debit Card Payments |
| Credit Card Payments |
| A2A Payments |
| Digital Wallet |
| Buy Now Pay Later |
| Cash |
| Other Payment Instruments |
By Payment Channel
| Point of Sale |
| Online |
| Mobile In-App |
| In-Car |
| Self-Service Kiosk |
By End-User Industry
| Retail |
| Entertainment and Digital Content |
| Healthcare |
| Hospitality and Travel |
| Utilities |
| Others End-User Industry |
By Transaction Type
| Domestic |
| Cross-Border |
| Recurring Bill Pay |
| By Payment Instrument | Debit Card Payments |
| Credit Card Payments | |
| A2A Payments | |
| Digital Wallet | |
| Buy Now Pay Later | |
| Cash | |
| Other Payment Instruments | |
| By Payment Channel | Point of Sale |
| Online | |
| Mobile In-App | |
| In-Car | |
| Self-Service Kiosk | |
| By End-User Industry | Retail |
| Entertainment and Digital Content | |
| Healthcare | |
| Hospitality and Travel | |
| Utilities | |
| Others End-User Industry | |
| By Transaction Type | Domestic |
| Cross-Border | |
| Recurring Bill Pay |


Key Questions Answered in the Report
How large is the Belgium payments market in 2026?
The Belgium payments market size stands at USD 224.95 billion in 2026.
Which payment instrument is most widely used in Belgium?
Debit cards lead, holding 45.40% share of all consumer payment value in 2025.
What growth rate is expected for mobile in-app payments?
Mobile in-app transactions are forecast to grow at a 2.79% CAGR from 2026 to 2031.
How fast will cross-border payments grow?
Cross-border flows are set to expand at a 3.41% CAGR through 2031 as Brussel's multinational base drives demand.
What regulatory change will impact Belgian business invoicing?
From January 1 2026, all B2B invoices must be issued and received electronically using the Peppol standard.
Why do small merchants still prefer cash?
Despite low interchange caps, terminal rental and PSP fees make card acceptance relatively costly for micro-retailers, prompting many to set card minimums.
Page last updated on:


