
Behavioral Biometrics Market Size and Share
Market Overview
| Study Period | 2020 - 2031 |
|---|---|
| Market Size (2026) | USD 3.45 Billion |
| Market Size (2031) | USD 11.38 Billion |
| Growth Rate (2026 - 2031) | 26.95 % |
| Fastest Growing Market | Asia Pacific |
| Largest Market | North America |
| Market Concentration | Medium |
Major Players *Disclaimer: Major Players sorted in no particular order Image © Mordor Intelligence. Reuse requires attribution under CC BY 4.0. | |
Behavioral Biometrics Market Analysis by Mordor Intelligence
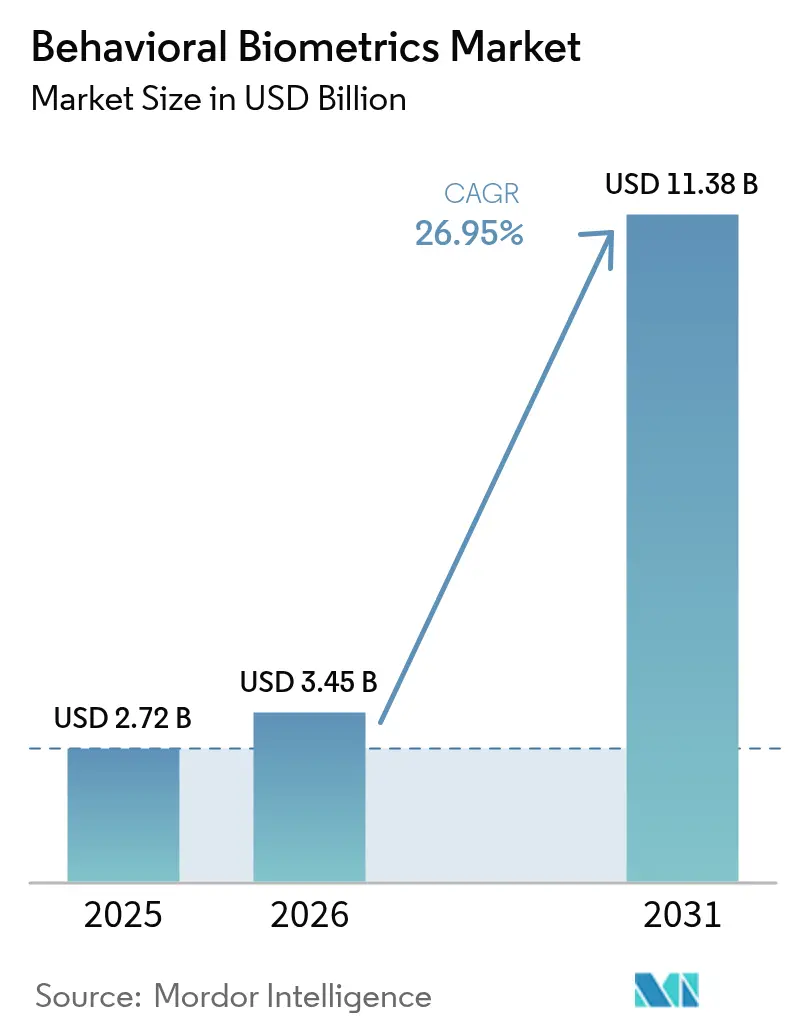
The behavioral biometrics market size is expected to grow from USD 2.72 billion in 2025 to USD 3.45 billion in 2026 and is forecast to reach USD 11.38 billion by 2031 at 26.95% CAGR over 2026-2031. Rapid uptake stems from enterprises replacing static credentials with continuous, passive verification that analyzes keystroke dynamics, mouse movement, and gait signals in real time. Growing cloud adoption, a surge in account takeover fraud, and regulator-mandated strong customer authentication are jointly accelerating the deployment of behavioral analytics across finance, e-commerce, and healthcare. Vendors differentiate themselves through algorithmic accuracy, low-friction user experiences, and seamless integration with identity platforms, while edge AI chips shorten inference latency and enable on-device analysis that preserves user privacy. At the same time, implementation complexity rises as enterprises must comply with GDPR, CCPA, and similar frameworks that strictly govern biometric data processing.
Key Report Takeaways
- By type, keystroke dynamics led with 39.25% revenue share of the behavioral biometrics market in 2025; gait analysis is projected to expand at a 27.45% CAGR to 2031.
- By deployment, cloud solutions accounted for 55.85% of the behavioral biometrics market share in 2025, while this model is forecast to register the fastest CAGR of 28.20% through 2031.
- By application, fraud detection and prevention captured a 42.35% share of the behavioral biometrics market size in 2025 and is projected to advance at a 26.95% CAGR through 2031.
- By end-user, BFSI held 44.10% of the 2025 revenue of the behavioral biometrics market, whereas healthcare is projected to post the highest 27.30% CAGR from 2025 to 2031.
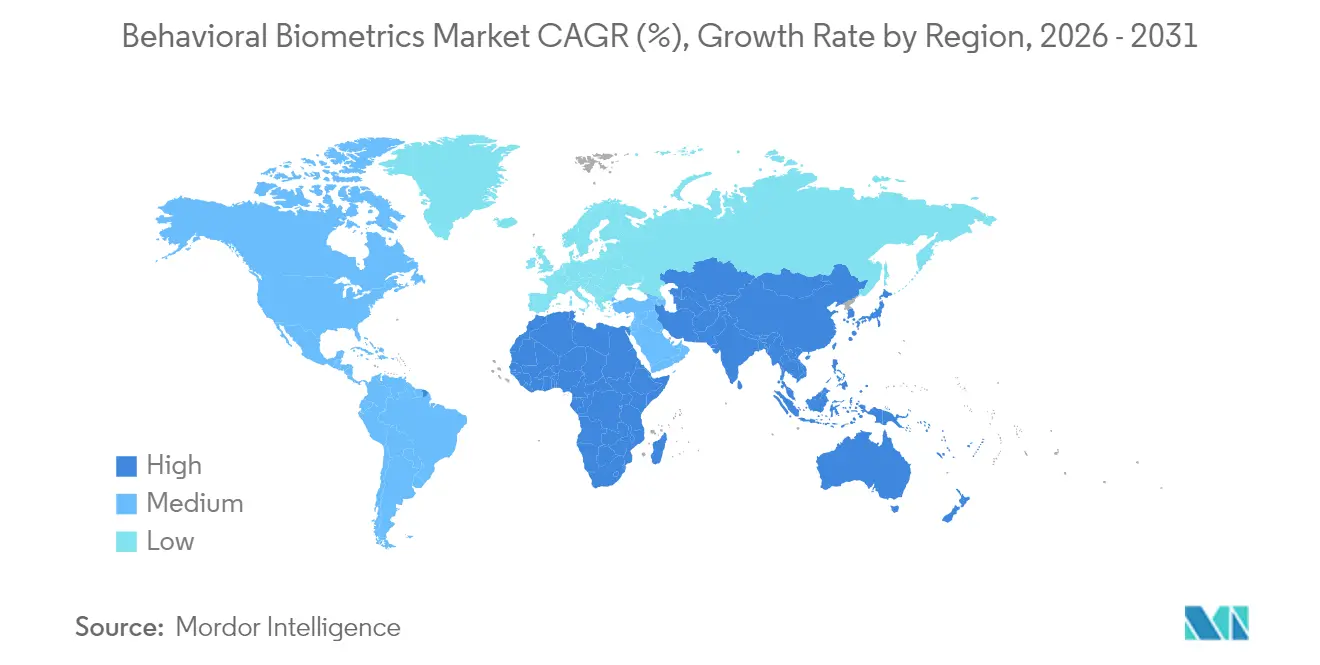
- By geography, North America accounted for 37.20% of the 2025 revenue of the behavioral biometrics market; the Asia-Pacific region is expected to grow at the fastest rate, with a 27.10% CAGR up to 2031.
Note: Market size and forecast figures in this report are generated using Mordor Intelligence’s proprietary estimation framework, updated with the latest available data and insights as of 2026.
Global Behavioral Biometrics Market Trends and Insights
Drivers Impact Analysis*
| Driver | (~) % Impact on CAGR Forecast | Geographic Relevance | Impact Timeline |
|---|---|---|---|
| Proliferation of passive liveness detection in mobile banking | +4.2% | Global, concentrated in North America and Europe | Medium term (2-4 years) |
| Surge in account takeover fraud in e-commerce | +3.8% | Global, particularly North America and Asia-Pacific | Short term (≤ 2 years) |
| Integration of behavioral biometrics into passwordless authentication standards (FIDO2) | +3.5% | Global, led by North America and Europe | Medium term (2-4 years) |
| Expansion of remote workforce and zero trust security adoption | +3.1% | Global, early adoption in North America and Europe | Short term (≤ 2 years) |
| Regulatory push for strong customer authentication in Europe and Asia | +2.9% | Europe and Asia-Pacific | Long term (≥ 4 years) |
| Increased processing power of edge AI chips enabling real-time behavioral analytics | +2.7% | Global, technology leadership in North America and Asia-Pacific | Long term (≥ 4 years) |
| Source: Mordor Intelligence | |||
Proliferation of passive liveness detection in mobile banking
Mobile banks embed passive liveness detection that observes typing cadence, touch pressure, and device handling to confirm identity without explicit user action. Financial institutions deploying these capabilities cite up to 85% cuts in false positive alerts and smoother onboarding that enhances customer satisfaction.[1]Federal Reserve Bank of San Francisco, “Digital Banking Security Evolution,” frbsf.org Deployment costs are offset by lower fraud losses and reduced multi-factor friction, encouraging banks across North America and Europe to incorporate behavioral analysis into native apps.
Surge in account takeover fraud in e-commerce
Global e-commerce fraud losses exceeded USD 6.4 billion in 2024, pushing merchants to adopt behavioral analytics that flags anomalous mouse paths and checkout flows in milliseconds.[2]Federal Trade Commission, “Consumer Sentinel Network Data Book 2024,” ftc.gov Platforms integrating behavioral biometrics report 70% reductions in credential-stuffing attacks during peak shopping seasons while preserving conversion rates, underscoring the technology’s revenue-protection value.
Integration of behavioral biometrics into passwordless authentication standards (FIDO2)
The FIDO Alliance added behavioral metrics to FIDO2, letting organizations marry continuous verification with public-key cryptography.[3]FIDO Alliance, “FIDO2 Specifications,” fidoalliance.org Enterprises adopting FIDO2-compliant behavioral biometrics logged 60% fewer help-desk authentication tickets and 40% higher onboarding completion as password resets disappear, demonstrating tangible operational gains.
Expansion of remote workforce and zero trust security adoption
Permanent hybrid workforces push security teams toward zero trust architectures that recalibrate user privileges based on real-time behavior scores. Behavioral analytics embedded in zero trust workflows reduce incident response times by 45% and ensure secure remote access without productivity penalties. Early adopters in the United States and Western Europe continue to refine automation rules that adjust access on the fly.
Restraints Impact Analysis*
| Restraint | (~) % Impact on CAGR Forecast | Geographic Relevance | Impact Timeline |
|---|---|---|---|
| Rising consumer privacy litigation under GDPR and CCPA | -2.1% | Europe and North America | Medium term (2-4 years) |
| High false rejection rates in multi-cultural user bases | -1.8% | Global, diverse markets | Short term (≤ 2 years) |
| Limited awareness among SME security teams | -1.5% | Global, emerging markets | Medium term (2-4 years) |
| Integration complexity with legacy authentication infrastructure | -1.3% | Global, established enterprises | Long term (≥ 4 years) |
| Source: Mordor Intelligence | |||
Rising consumer privacy litigation under GDPR and CCPA
Behavioral data qualifies as biometric information, demanding explicit consent and strict minimization. Fines surpassing EUR 50 million were imposed in 2024 for mishandling such data, prompting risk-averse firms to delay rollouts until privacy impact assessments and data officer sign-offs conclude. Compliance steps inflate timelines and project costs, especially for multinational deployments.
High false rejection rates in multi-cultural user bases
Algorithms trained on Western behavior show 15-20% false rejections in culturally diverse populations, raising discrimination concerns and hurting user experience. Enterprises serving global audiences must retrain models with regional data or employ multimodal approaches, extending development cycles and budget requirements.
*Our forecasts treat driver/restraint impacts as directional, not additive. The impact forecasts reflect baseline growth, mix effects, and variable interactions.
Segment Analysis
By Type: Keystroke Dynamics Retains Primacy while Gait Analysis Accelerates
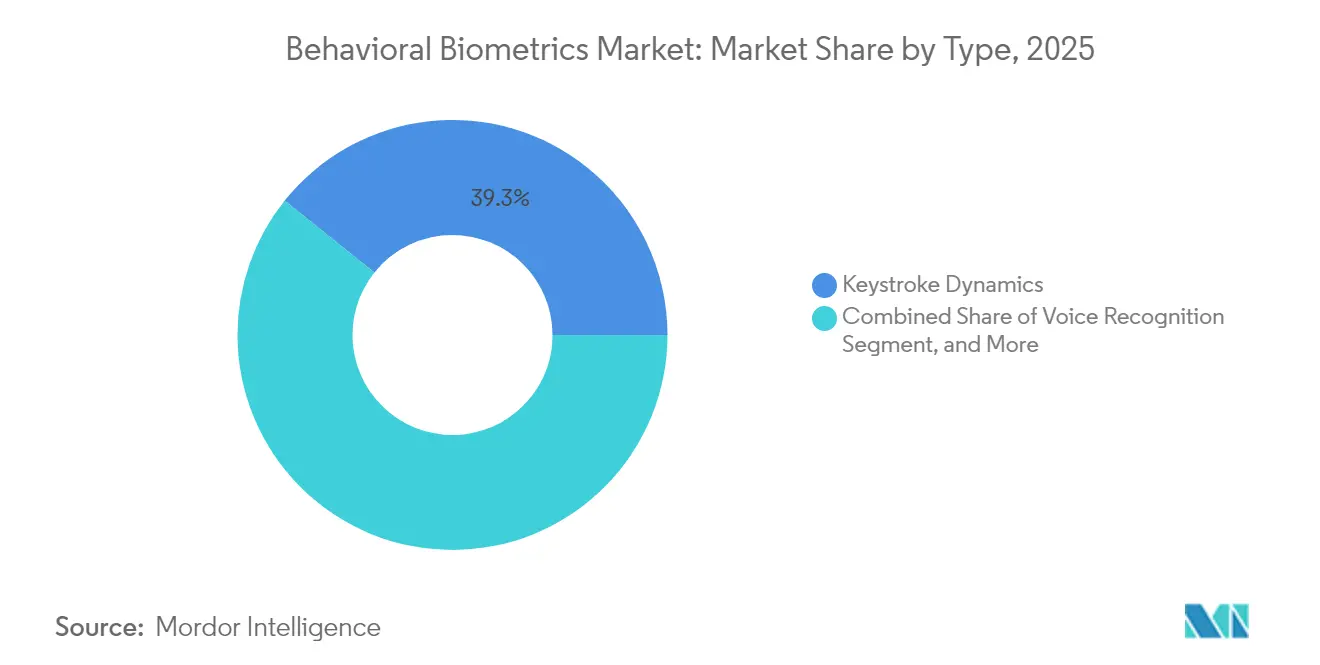
Keystroke dynamics held 39.25% of 2025 revenue, underscoring its maturity and compatibility with existing keyboards and touchscreens. The behavioral biometrics market size for keystroke solutions continues to grow as enterprises integrate typing analytics into web and mobile channels alongside risk engines. Growth is steady because retrofitting requires no hardware upgrades and algorithms already achieve sub-2% false accept rates on enterprise datasets.
Gait analysis posts the highest 27.45% CAGR through 2031. Smartphone accelerometers and wearables now capture stable gait signatures during normal movements, enabling passive verification for mobile wallets, ticketing, and secure facility access. Vendors fuse gait with voice or typing traits to curb spoofing and to mitigate environmental noise, propelling multimodal adoption within the broader behavioral biometrics market.



By Deployment: Cloud Delivery Drives Scale and Innovation
Cloud platforms commanded 55.85% of 2025 revenue as organizations pivot to SaaS authentication that updates continuously and scales across geographies. The behavioral biometrics market share for cloud deployment is projected to climb as microservices architectures and API gateways simplify rollout within digital banking, retail, and health portals. Subscription models cut capital expenditure and allow rapid tuning of algorithms based on global fraud telemetry.
On-premise solutions remain vital to governments and highly regulated sectors that demand sovereign control over biometric data. Hybrid designs emerge to reconcile privacy and performance, processing raw events locally while sending anonymized features to cloud analytics for threat correlation. This balanced approach sustains on-premise relevance yet underscores the cost and agility advantage cloud vendors deliver to the behavioral biometrics market.
By Application: Fraud Detection Dominates as Identity Proofing Gains Traction
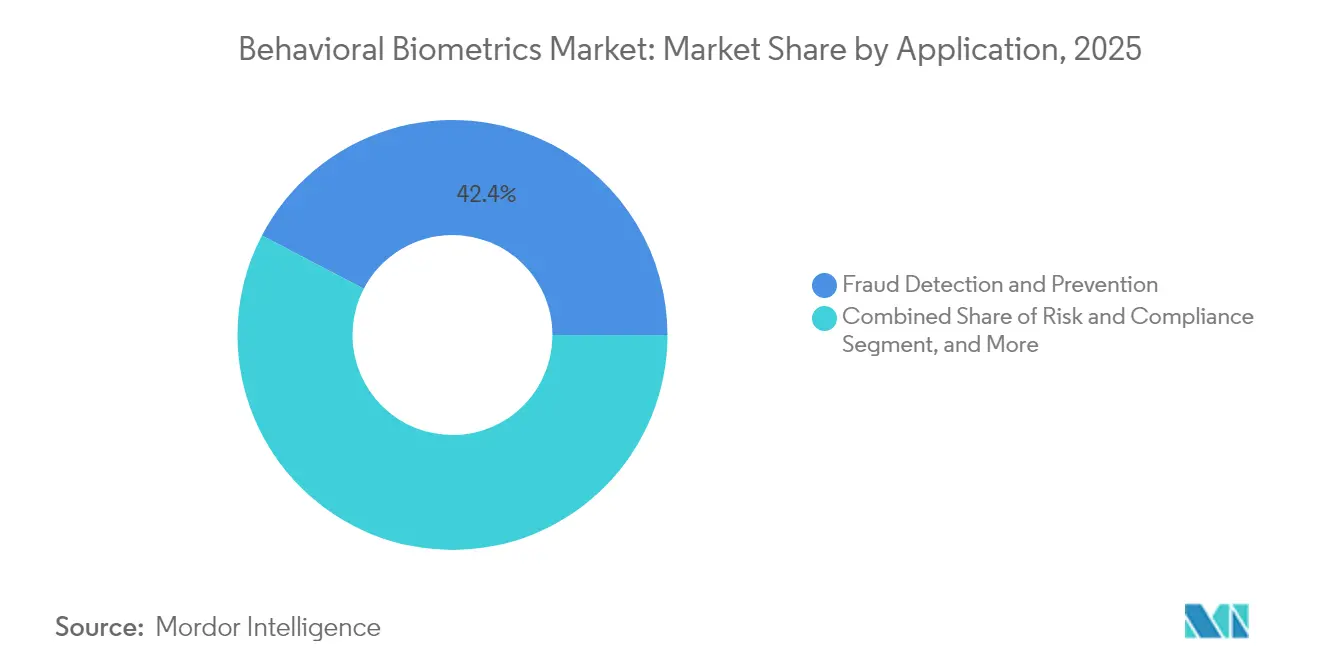
Fraud detection captured 42.35% of 2025 revenue by stopping account takeover, bot automation, and synthetic identities across digital channels. Continuous risk scoring shields checkout flows and banking sessions without one-time passwords that frustrate users. Enterprises attribute double-digit declines in manual review queues and chargebacks to behavioral insights.
Identity proofing expands at 27.60% CAGR as organizations modernize onboarding by blending document verification with behavioral signals. New users type verification codes, sign forms, or read phrases, creating behavioral prints that persist for future logins. This method satisfies know-your-customer mandates while curbing abandonment, adding momentum to the behavioral biometrics market size for identity proofing workflows.
By End-User: BFSI Leads but Healthcare Emerges
BFSI verticals held 44.10% revenue in 2025. Banks integrate behavioral analytics with device fingerprints and transaction monitoring to meet PSD2 strong customer authentication and to thwart mule accounts. Analysts credit behavioral layers with 25% faster fraud detection cycles compared with legacy rule engines.
Healthcare logs the fastest 27.30% CAGR as telehealth accelerates and electronic health records demand tamper-proof access. Providers deploy typing and gait signals to verify clinicians on shared workstations, safeguarding patient data without smartcards. Insurers embed behavioral risk scores within portals to comply with HIPAA audit requirements, expanding penetration of the behavioral biometrics market.
Geography Analysis
North America generated 37.20% of 2025 revenue on the back of early adoption and proactive cybersecurity mandates. U.S. financial regulators endorse behavioral metrics within layered defenses, spurring banks, insurers, and card networks to scale deployments. Federal agencies incorporate keystroke and mouse patterns into privileged-access workstations, illustrating government commitment to continuous verification. Canadian adoption centers on healthcare modernization and privacy-preserving cloud authentication.
Asia-Pacific displays the steepest 27.10% CAGR through 2031. China’s super-apps fuse gait and voice analytics into QR-based payments, while India’s fintech boom leverages keystroke dynamics to secure Unified Payments Interface transactions. Governments in Singapore, South Korea, and Australia issue grants for digital identity R and D that rely on behavioral signals collected via mobile devices and IoT sensors. Japanese electronics makers preinstall behavioral SDKs on flagship smartphones, providing a hardware base for regional expansion of the behavioral biometrics market.
Europe upholds strong growth owing to PSD2 and GDPR. Banks integrate behavioral authentication to satisfy strong customer rules without sacrificing user convenience, and telecom operators add behavioral profiles to SIM registration for fraud control. Privacy litigation risk moderates adoption speed, yet vendors counter with on-device processing and privacy-enhancing cryptography that comply with regional standards. Germany and the United Kingdom spearhead enterprise pilots across funding, retail, and public services.

Regulatory Landscape
Behavioral biometrics deployments are shaped by biometric-data privacy rules and digital identity assurance standards across major markets. In Australia, the Digital ID Act 2024 and the Digital ID (Accreditation) Data Standards 2024 formalize requirements around testing and operational controls for biometric matching and presentation attack detection, raising the bar for accredited identity services that incorporate behavioral signals. In the United States, November 2025 DHS/USCIS rulemaking activity around collection and use of biometrics reinforces scrutiny over how biometric modalities are captured, stored, and used in government-related workflows.
Security and identity guidance is also expanding toward continuous authentication. NIST SP 800-63-4 (July 2025) introduces session monitoring as a recognized control, bringing continuous behavioral signals (for example, typing cadence) into mainstream digital identity guidance used by federal agencies and many regulated enterprises. In Europe, PSD2-driven Strong Customer Authentication continues to anchor banking authentication design, while newer standards activity such as CEN/TR 18241:2026 strengthens expectations for privacy-by-design across the biometric access control lifecycle, aligning implementation practices with GDPR Article 25 obligations.
Value Chain Analysis
The value chain begins with behavioral-signal capture and instrumentation, including mobile and web SDKs that collect keystroke dynamics, touch and gesture telemetry, mouse movement, and inertial-sensor patterns for gait. These inputs are normalized and feature-engineered within model development pipelines (vendor data science and MLOps), then delivered as cloud services, on-premise stacks, or hybrid deployments. Standards and assurance frameworks (for example, NIST digital identity guidance and FIDO Alliance biometrics requirements) act as upstream constraints that shape data handling, evaluation methods, and acceptable authenticator designs.
On the downstream side, behavioral biometrics is increasingly packaged within broader identity, fraud, and risk-decisioning platforms, rather than deployed as a standalone point solution. Orchestration layers combine behavioral scoring with device intelligence and network-derived risk signals (such as SIM status and session integrity) to support real-time decisions in banking, e-commerce, healthcare access, and government portals. Distribution and scaling often run through partnerships with digital banking platforms, KYC/AML and fraud suites, and cloud ecosystems, with vendors such as BioCatch, LexisNexis Risk Solutions (BehavioSec), IBM, AU10TIX, IDnow, and Facephi appearing across capture, scoring, and platform integration roles.
Competitive Landscape
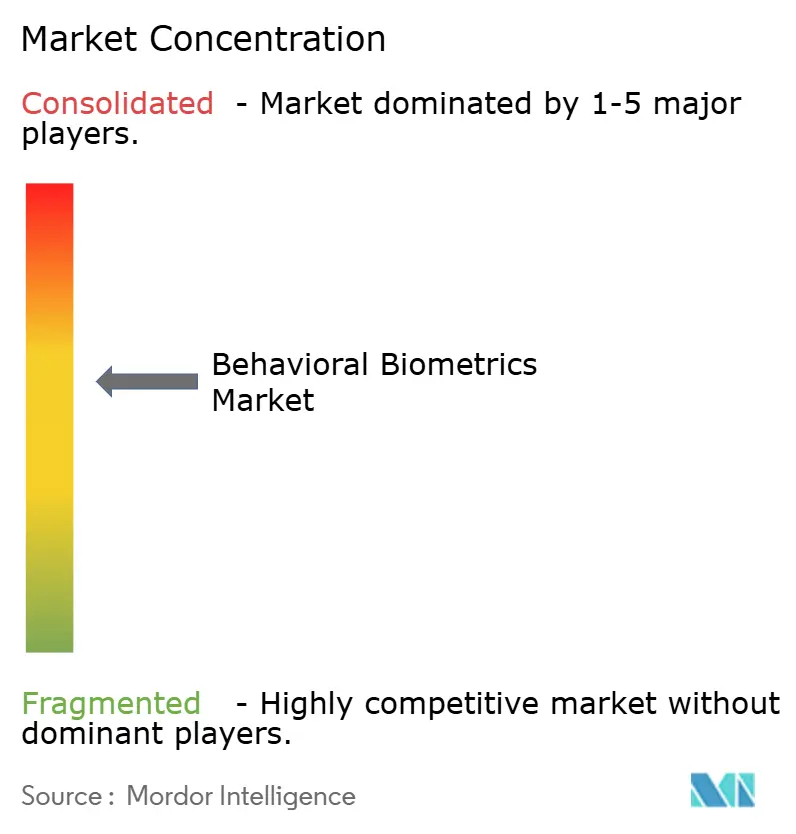
The market remains moderately fragmented. BioCatch, Mastercard’s NuData Security, BehavioSec, and TypingDNA headline offerings that span continuous session monitoring, passive liveness, and multimodal fusion. Established vendors benefit from global client footprints and integration pipelines with leading identity platforms, while specialists carve niches in high-accuracy keystroke or voice analytics.
Strategic alliances shape competition. IBM teamed with SecureAuth to embed behavioral analytics into its Security Verify product, while OneSpan acquired European technology to strengthen mobile authentication. Cloud-native challengers differentiate through developer-friendly APIs and usage-based pricing that attract digital-first enterprises.
Feature roadmaps center on reducing false rejections, supporting edge deployments, and enabling privacy-preserving federated learning. Vendors that demonstrate measurable fraud loss reductions and effortless user experience gain procurement preference, setting the tone for future consolidation in the behavioral biometrics market.
Behavioral Biometrics Industry Leaders
BioCatch Ltd.
Mastercard Incorporated (NuData Security)
Nuance Communications Inc.
SecureAuth Corporation
BehavioSec Inc.
- *Disclaimer: Major Players sorted in no particular order

Market Opportunities and Future Outlook
A key whitespace sits at the intersection of behavioral biometrics, device intelligence, and scam-specific fraud controls, where enterprises want continuous, low-friction defenses that reduce reliance on OTP and step-up challenges. Product moves such as BioCatchs Scams360 launch (July 2025) point to demand for behavioral analytics that detect authorized push payment and social-engineering patterns during the session, not only at login. That, in turn, is pushing vendors to package behavioral telemetry into workflows that fraud teams can operationalize through case management signals, explainability, and policy controls, while also integrating cleanly with existing risk engines.
Geographic expansion and longer-duration platform commitments are another opportunity area, supported by recent commercial deals and identity ecosystem programs. Facephi disclosed a five-year Central American banking contract (March 2026) covering mule account detection and behavioral biometrics, which underscores procurement preference for bundled, multi-use capabilities that cover onboarding and ongoing session risk. On the policy and ecosystem side, NIST SP 800-63-4 formalizing session monitoring (July 2025) and EU digital identity workstreams such as EUDI Wallet create a clearer path to embed continuous risk intelligence alongside identity verification, offering room for suppliers that can meet privacy-by-design expectations while delivering measurable fraud prevention outcomes.
Recent Industry Developments
- March 2026: Facephi disclosed a five-year contract with a Central American financial institution to deploy mule account detection and behavioral biometrics. The win highlights demand for multi-year, platform-level commitments that bundle continuous behavioral scoring with fraud-use cases beyond login, such as detecting illicit account usage patterns.
- July 2025: BioCatch launched Scams360, a behavioral analytics capability aimed at detecting authorized push payment scams by monitoring in-session patterns such as typing behavior, mouse movement, and hesitation. The release broadens behavioral biometrics from authentication into scam and social-engineering defense workflows used by bank fraud teams.
- December 2024: BioCatch announced an integration with the Q2 Digital Banking Platform, embedding behavioral biometrics into a widely used digital banking environment. This type of platform-native integration reduces deployment friction for banks and accelerates scaling of continuous authentication and fraud signals across retail banking user journeys.


Research Methodology Framework and Report Scope
Market Definition and Coverage
For this study, the behavioral biometrics market covers software and related services that identify or continuously authenticate a user based on behavior signals (such as typing rhythm, touch patterns, mouse movement, and gait) across digital channels.
Scope exclusions: Physical access control hardware and non-behavioral biometric modalities (such as fingerprint or facial recognition sold as standalone systems) are not counted unless they are bundled as part of a behavioral biometrics offering.
Segmentation Overview
- By Type
- Signature Analysis
- Keystroke Dynamics
- Voice Recognition
- Gait Analysis
- By Deployment
- On-premise
- On-cloud
- By Application
- Identity Proofing
- Continuous Authentication
- Risk and Compliance
- Fraud Detection and Prevention
- By End-User
- BFSI
- Retail and E-commerce
- Healthcare
- Government and Public Sector
- Other End-User
- By Geography
- North America
- United States
- Canada
- Mexico
- Europe
- Germany
- United Kingdom
- France
- Italy
- Spain
- Rest of Europe
- Asia-Pacific
- China
- Japan
- India
- South Korea
- Australia
- Rest of Asia-Pacific
- Middle East and Africa
- Middle East
- Saudi Arabia
- United Arab Emirates
- Rest of Middle East
- Africa
- South Africa
- Egypt
- Rest of Africa
- Middle East
- South America
- Brazil
- Argentina
- Rest of South America
- North America
Data Sources, Market Sizing, and Validation
Desk Research
Desk work starts by building a clean demand and supply map for behavioral biometrics in cybersecurity and identity stacks, then checking how adoption is being discussed in public data. We review sources such as NIST guidance on digital identity and authentication, FTC and other regulator publications on identity theft and fraud, and government cyber agencies that publish threat notes and breach advisories.
To ground the model in real buying patterns, we also pull context from sources such as SEC filings and earnings decks of relevant solution providers. We use trusted press coverage tied to fraud and account takeover trends, and peer reviewed papers that discuss behavioral signal accuracy and privacy tradeoffs. Patent databases are used to understand where innovation is focused and how quickly modalities are evolving. A paid subscription focused on company financials and intelligence is used selectively to fill gaps in revenue splits and regional exposure. These are illustrative sources, and many other public references were also used for data collection, validation, and clarification.
Primary Interviews and Surveys
Primary work is used to pressure test what we built from desk research, especially around pricing logic, packaging (platform versus point solution), and how buyers deploy behavioral analytics inside fraud and access flows. We spoke with a mix of solution providers, channel and implementation partners, and end user security and fraud leaders across key regions so assumptions could be corrected before totals were finalized.
Distribution of primary research fieldwork respondents
| Company type | Respondent position | Region |
|---|---|---|
| Top tier: 33% | CXOs: 14% | APAC: 40% |
| Mid tier: 51% | Functional/Unit leaders: 35% | EMEA: 33% |
| Smaller Players: 16% | Managers: 51% | Americas: 27% |
Market-Sizing & Forecasting
Sizing is built using top-down and bottom-up checks, so the final number stays realistic and repeatable. On the top-down side, security and fraud spend is translated into an addressable pool by applying adoption and attach-rate assumptions for continuous authentication and fraud prevention journeys, and then narrowed based on where behavioral signals are actually used (mobile banking, e-commerce checkout, account recovery, and step-up verification).
The model is guided by practical inputs that can be tracked over time, including digital transaction growth, account takeover and bot fraud incidence, regulatory push for strong customer authentication, the share of users on mobile versus desktop, and typical pricing constructs like per-user, per-transaction, or platform subscriptions. Forecasting is run mainly through scenario analysis, where adoption and pricing paths are varied around the expected fraud environment and enterprise security budgets, and then aligned to the consensus view shared by primary respondents. Bottom-up approximations are used as a cross-check by sampling vendor revenue signals, mapping major use cases, and applying reasonable average selling prices to estimated volumes. When a data point is missing, the gap is handled through proxy ratios that are validated in interviews.
Data Validation & Update Cycle
Outputs are validated through multiple checks so unusual jumps do not slip through. We compare implied penetration levels against independent signals like fraud loss commentary, public breach patterns, and deployment trends for identity and access tools, then investigate variances before final sign-off.
A second analyst review is completed for key assumptions, including currency timing and pricing progression, and re-contact is triggered when interview feedback conflicts with the model direction. Reports are refreshed annually, and interim updates are made when material events occur, such as major regulatory changes or step-changes in fraud tactics. Before delivery, a fresh final pass is completed so clients receive the latest updated view.
Mordor Intelligence's Behavioral Biometrics Market Sizing Compared With Other Published Estimates
Published market sizes for behavioral biometrics often differ because teams do not count the same things, and they apply different adoption and pricing paths. In practice, the spread usually comes from what is treated as behavioral-only versus broader fraud analytics, the year picked as the starting point, and how aggressively cloud deployments are assumed to scale.
Some external estimates bundle adjacent identity categories and broader analytics tooling into the same number, which can lift the total quickly. Mordor Intelligence counts only behavioral signal based authentication and continuous verification revenues (including related software and services) and keeps adjacent non-behavioral biometrics and general fraud platforms outside the total unless they are sold as part of the behavioral package.
Benchmark comparison
| Source | Market Size | Gaps in Research Methodology |
|---|---|---|
| Mordor Intelligence | USD 2.72 B (2025) | |
| Global Research Desk A | USD 3.40 B (2024) | Uses an earlier base year and is presented as a broader security and identity story, with scope language that can pull in wider fraud and zero-trust spending, which inflates the addressable pool. |
| Industry Research Desk B | USD 4.50 B (2024) | Reports a higher starting value that likely reflects wider category inclusion and different currency timing, and the pricing curve appears to move faster than what buyers and providers typically confirm in interviews. |
The benchmark spread mainly tracks to year choice and what gets bundled into the counted revenue. By tying totals to observable demand signals and then sanity-checking with supplier and buyer inputs, the final estimate stays traceable to clear steps that can be repeated in future refreshes.


Key Questions Answered in the Report
How fast is the behavioral biometrics market expected to grow through 2031?
The market is forecast to expand at a 26.95% CAGR, climbing from USD 2.72 billion in 2025 to USD 11.38 billion by 2031.
Which deployment model is gaining the most share in behavioral authentication?
Cloud delivery leads with 55.85% of 2025 revenue and is posting the quickest 28.20% CAGR because enterprises value scalability and rapid updates.
Why are financial institutions early adopters of behavioral biometrics?
Banks use continuous behavioral signals to meet strong customer authentication laws and to curb account-takeover fraud, supporting 85% cuts in false positives and faster threat detection.
What restrains widespread adoption among global user bases?
Algorithms trained on Western data suffer higher false rejections in multicultural populations, hitting 15-20% error rates and prompting costly retraining.
Which region shows the highest future growth potential?
Asia-Pacific leads with a projected 27.10% CAGR, propelled by mobile-first payments, government digital identity projects, and rapid e-commerce expansion.
How does behavioral biometrics fit within zero trust security?
Continuous behavioral scoring supplies dynamic trust signals that adjust user privileges in real time, reducing incident response times by 45% in early deployments.
Page last updated on:





