
Beeswax Market Size and Share
Market Overview
| Study Period | 2021 - 2031 |
|---|---|
| Market Size (2026) | USD 606.91 Million |
| Market Size (2031) | USD 764.56 Million |
| Growth Rate (2026 - 2031) | 4.73 % |
| Fastest Growing Market | Asia Pacific |
| Largest Market | Asia-Pacific |
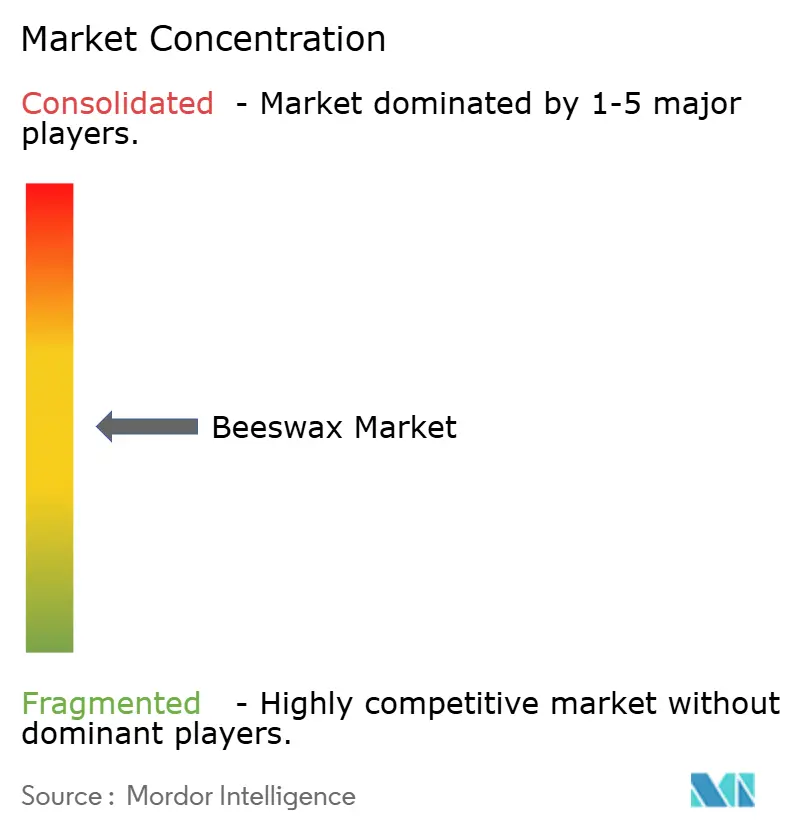
| Market Concentration | Medium |
Major Players
*Disclaimer: Major Players sorted in no particular order Image © Mordor Intelligence. Reuse requires attribution under CC BY 4.0. |
|
Beeswax Market Analysis by Mordor Intelligence
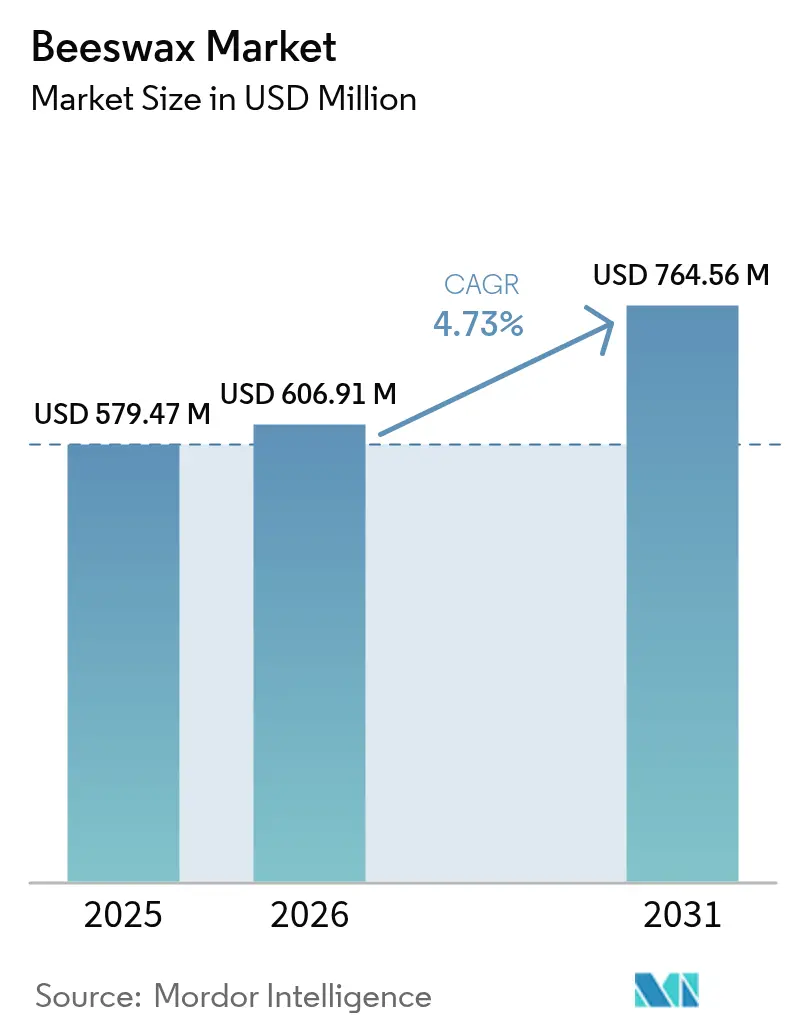
The global beeswax market size was valued at USD 579.47 million in 2025 and estimated to grow from USD 606.91 million in 2026 to reach USD 764.56 million by 2031, at a CAGR of 4.73% during the forecast period (2026-2031). The global beeswax market is driven by several interconnected factors, primarily the increasing consumer preference for natural, organic, and sustainable ingredients, as individuals move away from synthetic chemicals. This trend has particularly enhanced the use of beeswax in cosmetics, personal care, pharmaceuticals, and food products due to its moisturizing, emulsifying, and non-toxic properties. Additionally, rising disposable incomes and urbanization have further fueled the demand for beauty and wellness products containing beeswax. The eco-friendly nature of beeswax and its growing application as a biodegradable alternative in packaging and other industrial uses have also contributed to its appeal.
Key Report Takeaways
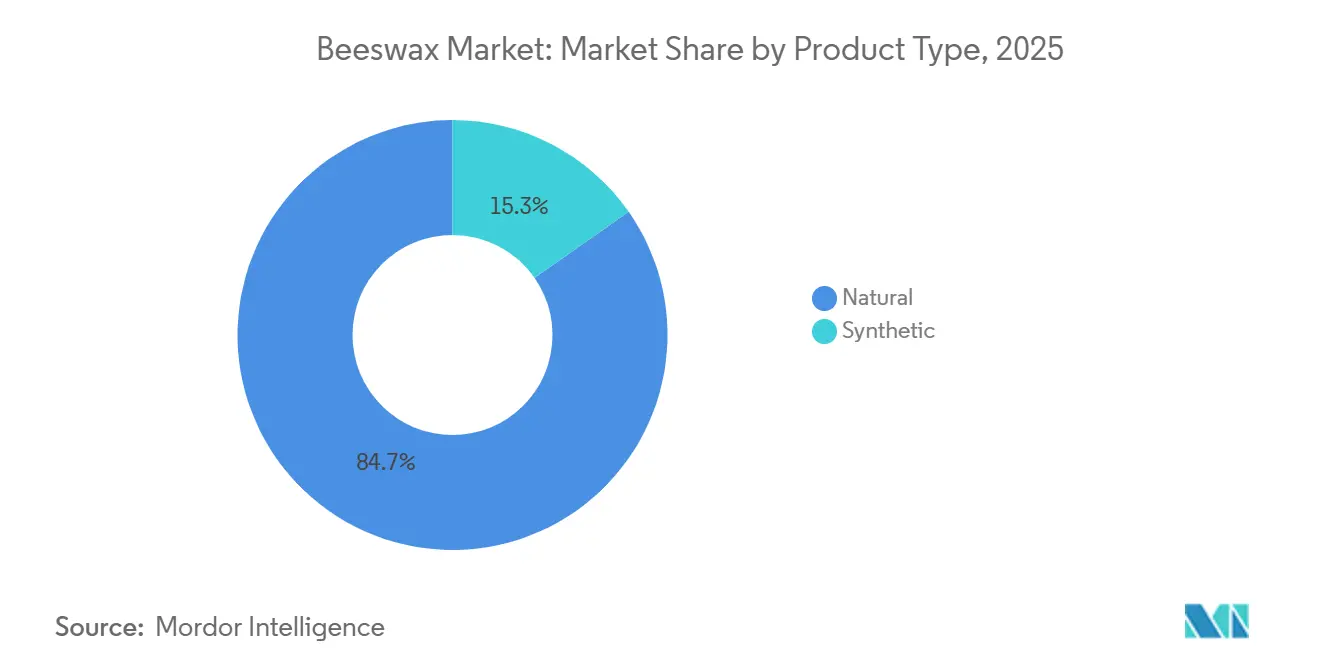
- By product type, natural beeswax held 84.71% of the 2025 beeswax market share, and synthetic grades are projected to post a 5.91% CAGR through 2031.
- By form, blocks led with 42.85% of 2025 revenue, while sheets/beads are forecast to expand at a 6.05% CAGR between 2026-2031.
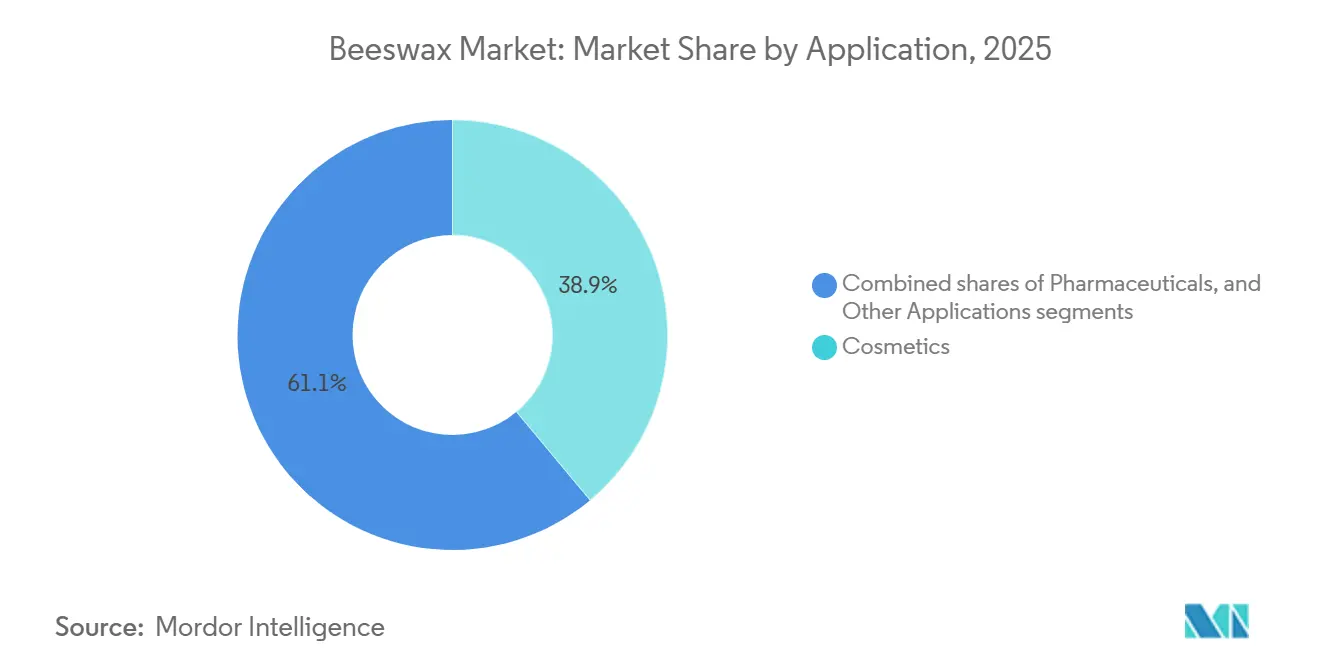
- By application, cosmetics contributed 38.94% of the 2025 value and are poised for a 6.23% CAGR over the forecast period.
- By geography, Asia-Pacific accounted for 37.69% of global revenue in 2025 and is projected to advance at a 6.32% CAGR during 2026-2031.
Note: Market size and forecast figures in this report are generated using Mordor Intelligence’s proprietary estimation framework, updated with the latest available data and insights as of 2026.
Global Beeswax Market Trends and Insights
Drivers Impact Analysis*
| Driver | (~) % Impact on CAGR Forecast | Geographic Relevance | Impact Timeline |
|---|---|---|---|
| Increasing preference for natural and organic ingredients in personal care | +1.2% | Global, with concentration in North America and Western Europe | Medium term (2-4 years) |
| Clean beauty and ingredient transparency movement | +0.9% | North America and European Union core, spillover to Asia-Pacific urban centers | Short term (≤ 2 years) |
| Expanding pharmaceutical applications | +0.7% | Global, led by North America and Europe for regulatory approvals | Long term (≥ 4 years) |
| Rising demand for non-toxic and allergen-free food additives and coatings | +0.6% | Global, with early gains in European Union and North America organic segments | Medium term (2-4 years) |
| Rising popularity of handmade and traditional crafts | +0.5% | North America, Europe, and Asia-Pacific artisanal markets | Short term (≤ 2 years) |
| Advancement in purification and processing technologies | +0.4% | Global, with technology hubs in North America and Europe | Long term (≥ 4 years) |
| Source: Mordor Intelligence | |||


Increasing preference for natural and organic ingredients in personal care
The growing consumer preference for natural and organic ingredients in personal care products is a key driver of growth in the global beeswax market. As awareness of sensitivities to synthetic chemicals and concerns about long-term skin health increase, manufacturers are reformulating skincare, lip care, haircare, and cosmetic products with plant- and hive-derived ingredients that are perceived as safer and more sustainable. Beeswax is particularly valued for its emollient, protective, and stabilizing properties, making it a preferred multifunctional ingredient in clean-label formulations. Regulatory standards further support this trend; for instance, the EU’s COSMOS standard mandates that at least 95% of physically processed agro-ingredients must be organic, positioning certified beeswax as a critical compliance component for brands targeting environmentally conscious consumers[1]Source: COSMOS Certification, "COSMOS-standard Cosmetics Organic and Natural Standard," media.cosmos-standard.org . This alignment between regulatory requirements and consumer preferences continues to drive the adoption of beeswax across both premium and mass-market personal care segments.
Clean beauty and ingredient transparency movement
The growing emphasis on clean beauty and ingredient transparency is a significant driver for the global beeswax market. Consumers are increasingly examining product labels and preferring formulations with recognizable, minimally processed, and naturally derived ingredients over synthetic alternatives. Beeswax benefits from this trend due to its natural origin, versatile properties, and established history of safe use in skincare and cosmetic products. Additionally, regulatory changes are strengthening transparency standards across the industry. The U.S. Modernization of Cosmetics Regulation Act of 2022 mandates cosmetic manufacturers to register their facilities with the FDA, disclose product ingredients in a public database, and report adverse events, thereby raising compliance requirements for all cosmetic raw materials, including beeswax[2]Source: U.S. Food and Drug Administration, "Modernization of Cosmetics Regulation Act of 2022 (MoCRA)," fda.gov . As brands adjust to stricter regulations and rising consumer expectations, beeswax emerges as a compliant and appealing ingredient for transparent, clean-label product lines.
Expanding pharmaceutical applications
Pharmaceutical applications are driving significant growth in the global beeswax market. Beeswax is extensively used in ointments, creams, suppositories, and controlled-release formulations due to its biocompatibility, stability, and natural thickening and binding properties. Its protective and moisture-retention characteristics make it ideal for topical treatments, wound care products, and dermatological preparations. With increasing demand for semi-solid dosage forms and plant-based excipients, pharmaceutical manufacturers are incorporating beeswax as a functional, naturally derived ingredient. Additionally, rising healthcare expenditure, an aging population, and a growing focus on skin-related therapies are further boosting beeswax usage in pharmaceutical manufacturing, solidifying its importance as a valuable excipient in modern drug formulations.
Rising demand for non-toxic and allergen-free food additives and coatings
The increasing demand for non-toxic and allergen-free food additives and coatings is driving growth in the global beeswax market. As consumers focus more on clean-label and minimally processed foods, manufacturers are adopting naturally derived ingredients to replace synthetic glazing agents and preservatives. Beeswax is extensively used as a food-grade coating for fruits, confectionery, and bakery products due to its moisture-barrier properties, ability to extend shelf life, and recognized safety profile. Its application in edible films and protective coatings supports efforts to reduce chemical additives while preserving product quality and freshness. With heightened regulatory scrutiny of artificial ingredients and growing awareness of food sensitivities, beeswax is gaining prominence as a reliable, naturally sourced alternative in food processing.
Restraints Impact Analysis*
| Restraint | (~) % Impact on CAGR Forecast | Geographic Relevance | Impact Timeline |
|---|---|---|---|
| Raw material supply variability due to climate and environmental factors | -0.8% | Global, acute in North America, Europe, and Asia-Pacific regions with intensive agriculture | Medium term (2-4 years) |
| Strict regulatory requirements in food and pharmaceutical sectors | -0.5% | North America and European Union, with spillover to Asia-Pacific export-oriented producers | Long term (≥ 4 years) |
| Risk of pesticide residues and contamination | -0.4% | Global, concentrated in regions with high agrochemical use | Short term (≤ 2 years) |
| Labor-intensive nature of beekeeping | -0.3% | North America and Europe high-wage economies, emerging pressure in Asia-Pacific | Medium term (2-4 years) |
| Source: Mordor Intelligence | |||
Variability in raw material supply, driven by factors such as climate change, disease outbreaks, and environmental stressors, significantly restrains the global beeswax market. Beeswax production is closely tied to the health and survival rates of honey bee colonies. Survey data from the United States for 2023-2024 illustrate the severity of this issue, with beekeepers reporting an estimated annual colony loss rate of 55.1%, significantly higher than the long-term average of 40.3%. Summer losses were recorded at 30.4%, while winter losses reached 37.3%[3]Source: Apiary Inspectors of America, "Preliminary Results from the 2023-2024 US Beekeeping Survey: Colony Loss and Management," apiaryinspectors.org. Commercial operators, who manage most colonies, faced even higher losses, with an annual mortality rate of 55.7%, well above historical averages[4]Source: Apiary Inspectors of America, "Preliminary Results from the 2023-2024 US Beekeeping Survey: Colony Loss and Management," apiaryinspectors.org. State-level data revealed substantial variation, with annual losses ranging from 17.7% to 76.2%, highlighting the uneven and unpredictable effects of environmental factors[5]Source: Apiary Inspectors of America, "Preliminary Results from the 2023-2024 US Beekeeping Survey: Colony Loss and Management," apiaryinspectors.org. These elevated and fluctuating colony mortality rates disrupt beeswax production, leading to supply instability and increased procurement costs for industries such as cosmetics, pharmaceuticals, and food processing, thereby limiting consistent market growth.
Strict regulatory requirements in food and pharmaceutical sectors
Strict regulatory requirements in the food and pharmaceutical industries constrain the global beeswax market by increasing compliance complexity and operational costs for manufacturers. Beeswax used in applications such as edible coatings, food glazing agents, medicinal ointments, and drug formulations must adhere to stringent standards for purity, contamination, and traceability to ensure consumer safety. Regulatory authorities mandate detailed specifications on factors such as pesticide residues, heavy metals, microbiological limits, and processing methods, necessitating extensive testing and certification prior to market approval. Additionally, variations in regulatory frameworks across regions complicate international trade, as suppliers must comply with differing labeling, quality, and documentation requirements. These rigorous standards, while critical for safety and quality assurance, can extend approval timelines, elevate production costs, and restrict market entry for smaller producers, thereby tempering overall market growth.
*Our forecasts treat driver/restraint impacts as directional, not additive. The impact forecasts reflect baseline growth, mix effects, and variable interactions.
Segment Analysis
By Product Type: Natural Dominance Anchors Value Chain
In 2025, natural beeswax accounted for 84.71% of the market share, underscoring its essential role in organic-certified cosmetics, pharmaceutical excipients, and food-grade coatings. The demand for natural beeswax is primarily driven by the increasing preference for plant- and hive-derived ingredients in cosmetics, personal care, pharmaceuticals, and clean-label food applications. Consumers are showing a growing inclination toward minimally processed, biodegradable, and sustainably sourced materials, positioning natural beeswax as a reliable alternative to petrochemical-based waxes. The rising popularity of organic beauty products, eco-friendly candles, and natural food coatings further boosts demand. Additionally, premiumization trends in skincare and wellness products are driving higher-value applications for certified and traceable natural beeswax.
Meanwhile, synthetic beeswax is projected to grow at a compound annual growth rate (CAGR) of 5.91% through 2031, driven by cost-conscious industrial formulators seeking paraffin-free alternatives with predictable melting points. The synthetic beeswax market benefits from the need for cost-effective, consistent, and scalable wax alternatives in large-volume industrial applications. Manufacturers prefer synthetic variants due to their uniform quality, controlled melting points, and stable supply, which is unaffected by climatic or apiculture-related fluctuations. The expanding use of synthetic beeswax in cosmetics, polishes, coatings, adhesives, and pharmaceutical formulations, where performance consistency is crucial, further supports market growth. Additionally, synthetic beeswax appeals to vegan and cruelty-free product segments, enabling brands to align with ethical positioning while maintaining formulation efficiency.

By Form: Blocks Lead While Sheets/Beads Gain Traction
Blocks accounted for a share 42.85% in 2025. The demand for block-form beeswax is primarily driven by bulk industrial buyers and traditional craft sectors that require raw, unprocessed wax for further customization. Cosmetic and pharmaceutical manufacturers often prefer block formats for large-batch melting, blending, and formulation processes, as blocks are easier to transport and store in high volumes. The candle-making industry, including artisanal and religious candle producers, also favors blocks due to their flexibility in shaping and remolding. Additionally, block beeswax is typically associated with lower processing costs, making it an economical choice for buyers in large-scale applications.
In contrast, sheets and beads are projected to grow at a compound annual growth rate (CAGR) of 6.05%. The growth of these forms is supported by their convenience, precision dosing, and ease of handling in small- to medium-scale production. Beeswax beads are particularly popular among cosmetic formulators and DIY skincare brands because they melt quickly and allow for accurate measurement, reducing waste and improving production efficiency. Beeswax sheets are widely used in candle rolling and craft applications, especially in educational, hobbyist, and decorative segments. The increasing popularity of home-based cosmetic production, handmade candles, and creative craft activities continues to drive demand for these user-friendly and value-added beeswax formats.
By Application: Cosmetics Leadership Drives Market Growth
In 2025, cosmetics accounted for 38.94% of application-based revenue and are projected to grow at a CAGR of 6.23%. The demand for beeswax in cosmetics is driven by its multifunctional properties as a natural thickener, emulsifier, and protective barrier agent. It is widely used in products such as lip balms, creams, mascaras, and lotions. Increasing consumer preference for clean-label, plant- and hive-derived ingredients has prompted brands to replace synthetic stabilizers with naturally sourced alternatives. Beeswax enhances texture, improves product stability, and provides moisture retention benefits, making it valuable for both premium and mass-market formulations. Additionally, the rising demand for organic, sustainable, and biodegradable personal care products further supports its adoption in skincare and color cosmetics.
In pharmaceutical applications, the demand for beeswax is driven by its role as a safe and biocompatible excipient in ointments, topical creams, suppositories, and controlled-release formulations. Its ability to provide structural consistency, stabilize active ingredients, and create protective barriers makes it suitable for dermatological and wound-care preparations. The increasing focus on semi-solid dosage forms, the expanding geriatric population requiring topical treatments, and the growing interest in naturally derived excipients are further encouraging its use. Additionally, pharmaceutical manufacturers value beeswax for its stability and compatibility with a wide range of therapeutic compounds.

Geography Analysis
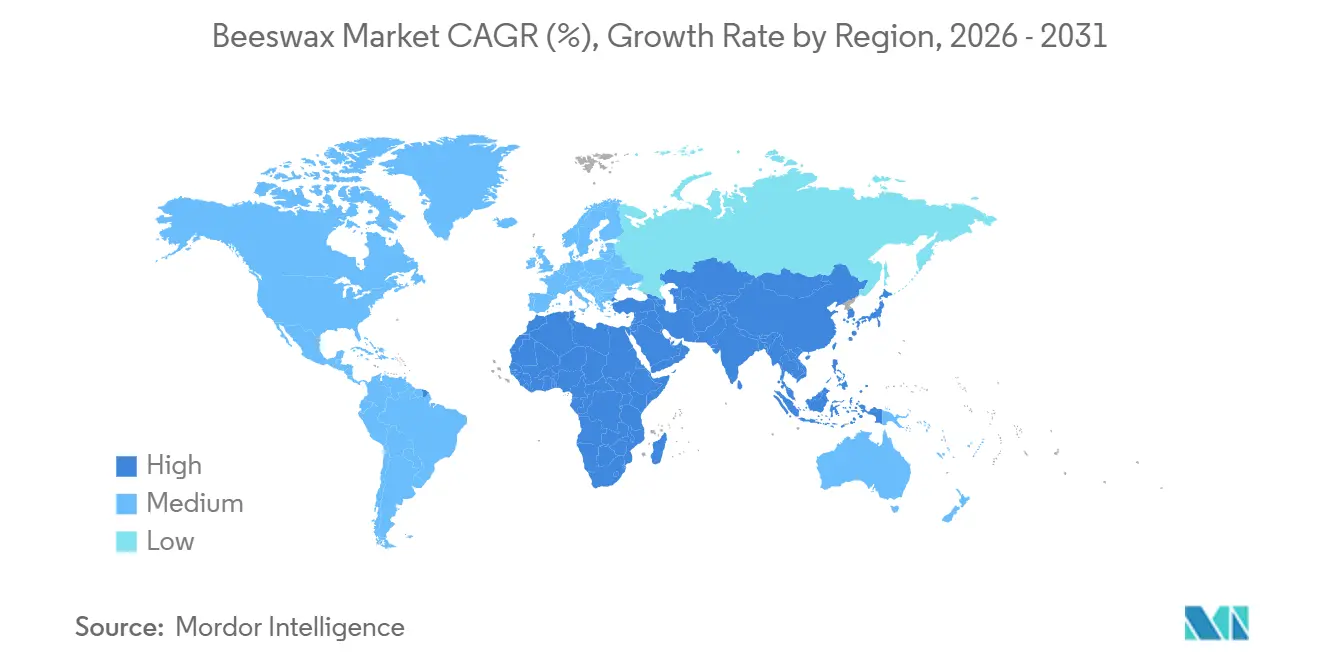
In 2025, Asia-Pacific accounted for 37.69% of the global market value and is projected to grow at a CAGR of 6.32% through 2031. The growth of the beeswax market in the Asia-Pacific is driven by the expansion of cosmetics and personal care manufacturing, rising disposable incomes, and increasing consumer preference for natural and herbal products. Countries such as China, India, Japan, and South Korea are experiencing strong demand for skincare, lip care, and traditional medicine products that utilize naturally derived ingredients. Additionally, growth in candle production, food processing, and pharmaceutical manufacturing supports regional consumption. The availability of raw materials, supported by large apiculture bases in parts of Asia, and the rapid growth of e-commerce platforms further enhance the distribution of beeswax-based products in the region.
In North America and Europe, the demand for beeswax is driven by established clean beauty markets, stringent regulatory standards promoting safer ingredients, and a strong consumer preference for organic and sustainable products. The growing interest in eco-friendly candles, natural food coatings, and plant-based pharmaceutical excipients is broadening its application scope. Trends toward premiumization in skincare and cosmetics, coupled with heightened awareness of ingredient transparency, further support beeswax adoption among both established brands and niche artisanal producers. Additionally, regulatory oversight and quality certifications in these regions strengthen confidence in responsibly sourced and traceable beeswax supplies.
Latin America and the Middle East represent emerging opportunities, with Brazil and Argentina expanding apiculture to serve domestic food-coating and export markets, while Saudi Arabia and the United Arab Emirates import pharmaceutical-grade beeswax to support growing cosmetics manufacturing hubs. Brazil's tropical climate enables year-round honey and beeswax production, though quality-control infrastructure lags North American and European standards, limiting access to premium pharmaceutical and organic-certified segments. The Middle East's cosmetics sector is adopting halal-certification frameworks that align with beeswax's natural provenance, creating niche demand streams that complement conventional applications. Africa's beekeeping potential remains underexploited due to limited refining capacity and export logistics, yet initiatives by development agencies to promote apiculture as a rural-livelihood strategy may unlock supply over the medium term.

Regulatory Landscape
Beeswax used in food applications is regulated as an approved additive in major markets, which raises the bar for specifications, labeling, and documentation. In the United States, beeswax is affirmed as GRAS under FDA food additive regulations (21 CFR 184.1973) for uses including as a surface-finishing agent, lubricant, and release agent. In the United Kingdom, beeswax is authorized as food additive E 901 under Food Standards Agency administration of assimilated EU food additive rules, supporting continued use in glazing and coating applications.
Compliance requirements are also tightening for trade flows into Europe. From November 29, 2024, the European Union implemented Regulation (EU) 2023/2652 requiring apiculture products, including beeswax intended for human consumption, to come from approved establishments registered in TRACES, with accompanying border-control documentation. For non-food uses, import pathways can differ. Great Britain import rules for beeswax for technical and cosmetic purposes reference Category 3 animal by-products and prescribed processing methods (Regulation (EC) 1069/2009 and implementing rules), while Australia applies biosecurity and food compliance requirements via the Imported Food Control Act 1992 and the Australia New Zealand Food Standards Code for food-use consignments.
Value Chain Analysis
The beeswax value chain starts with smallholder and commercial beekeepers producing wax from comb cappings and old comb during honey extraction, then moving through aggregation by local collectors, cooperatives, and traders. Primary processing typically involves melting, filtering, and drying, followed by sales into refining and fractionation, where specialist processors produce standardized blocks, pastilles/pellets, and sheets/beads to match customer specifications for cosmetics, pharmaceuticals, and food coatings. Established refiners such as Koster Keunen, Strahl & Pitsch, and British Wax Refining operate multi-origin sourcing and purification capabilities, which supports tighter control over color, odor, melting range, and contaminant limits required for regulated end uses.
Quality assurance and traceability are the main bottlenecks, particularly when origin lots are mixed and can increase exposure to residues and inconsistent composition. Sourcing programs that professionalize supply and digitize records (for example, MIS-based traceability initiatives implemented in parts of West Africa) help link wax to organized beekeeper groups and improve lot integrity. Export-oriented chains increasingly rely on direct partnerships between origin processors and European distribution hubs to reduce intermediated steps; one example is Tanzania International Bee Company Limited (Jambo Asali) contracting annual beeswax supply volumes to a Lithuanian buyer that serves as an EU distribution channel, combining refining compliance with logistics access to premium markets.
Competitive Landscape
The beeswax market is moderately fragmented, with established refiners such as Koster Keunen, Strahl & Pitsch, and British Wax Refining utilizing vertical integration, proprietary derivatives, and multi-country sourcing to target premium market segments. These companies leverage their control over the supply chain and advanced processing techniques to produce high-quality products that meet the stringent requirements of premium buyers. In contrast, regional processors and commodity traders cater to price-sensitive industrial buyers by focusing on cost-effective production and bulk supply.
Opportunities remain underexplored in pharmaceutical applications, including tamper-resistant formulations, buccal films, and transdermal patches, where beeswax's hydrophobic matrix properties provide potential advantages such as moisture resistance and controlled release, which are not fully leveraged compared to synthetic polymers. Additionally, in biodegradable food packaging, beeswax-shellac composites and corn-husk hybrids demonstrate performance comparable to plastic films at competitive costs, offering an eco-friendly alternative that aligns with increasing consumer demand for sustainable packaging solutions.
Emerging players, such as PLA-stearate wax producers, are appealing to cost-conscious formulators with renewable feedstock options. However, their inability to obtain USDA organic or COSMOS certification limits their access to premium cosmetics and food-grade markets, where certifications are critical for consumer trust and regulatory compliance. Technology adoption, including blockchain traceability, IoT-enabled hive monitoring, and AI-driven quality prediction, is still in its early stages. These advancements are primarily utilized by top-tier refiners who can distribute digital investment costs across large volumes, enabling them to enhance supply chain transparency, optimize hive productivity, and ensure consistent product quality. Meanwhile, mid-tier players rely on manual processes and third-party testing, leading to longer lead times and greater variability in quality, which can hinder their competitiveness in the market.
Beeswax Industry Leaders
-
Koster Keunen Inc.
-
Strahl & Pitsch Inc.
-
British Wax Refining Co. Ltd.
-
New Zealand Beeswax Ltd.
-
Paramold Manufacturing LLC
- *Disclaimer: Major Players sorted in no particular order

Market Opportunities and Future Outlook
The clearest opportunity is in export-ready, traceable supply tailored to regulated end uses, especially as documentation requirements rise. The EU move to require TRACES registration for apiculture product establishments (effective November 29, 2024) strengthens the pull for approved-origin sourcing, consistent testing, and auditable chain-of-custody, creating space for processors that can supply food-grade and pharmaceutical-grade specifications at scale. In parallel, clean beauty compliance pressures, including the United States Modernization of Cosmetics Regulation Act of 2022 (MoCRA), increase ingredient accountability for cosmetics brands, which favors suppliers that can provide documentation and quality systems for natural beeswax.
Origin-side investments and structured offtake channels also expand the pool of addressable supply for manufacturers that need dependable inputs. In Tanzania, the Forest Services Agency announced construction of a bee products processing factory in Manyoni District (Singida) with a budgeted investment of 200 million Tanzanian shillings, aimed at increasing processing capacity for honey and beeswax. At the same time, cross-border contracting is providing evidence of demand for this type of input security: Tanzania International Bee Company Limited (Jambo Asali) executed shipments under a contract structured around supplying 240 metric tons of beeswax annually to a Lithuanian firm serving as an EU distribution hub.
Recent Industry Developments
- May 2026: Koster Keunen announced a packaging change for pastillated and granulated products, moving from 25 kg cartons to 20 kg cartons effective August 3, 2026, aligned with OSHA ergonomic manual lifting guidance. The shift standardizes handling requirements for customers and can influence warehousing and outbound logistics planning for bulk wax users.
- January 2025: OQEMA Group and Koster Keunen formed a strategic partnership to distribute wax solutions across the Baltics, Central Eastern Europe, and South Eastern Europe. The collaboration expands route-to-market coverage for specialty wax portfolios and strengthens local availability for formulators sourcing natural wax inputs.
- November 2024: Koster Keunen launched Kester Wax K-70P, a plasticizer positioned for skincare balms and color cosmetics. The product extends the companys formulation toolbox for personal care manufacturers seeking performance additives aligned with natural-ingredient positioning.


Research Methodology Framework and Report Scope
Market Definition and Coverage
For this study, the beeswax market is defined as the revenue generated from beeswax sold as an ingredient or raw material into downstream uses, where pricing reflects typical wholesale and contract transactions in each region.
Scope exclusions: We exclude finished consumer products that only contain beeswax as a minor input, along with informal home harvesting that is not traded commercially.
Segmentation Overview
-
By Product Type
- Natural
- Synthetic
-
By Form
- Blocks
- Pellets/Pastilles
- Sheets/Beads
-
By Application
- Cosmetics
- Pharmaceuticals
- Other Applications
-
By Geography
-
North America
- United States
- Canada
- Mexico
- Rest of North America
-
South America
- Brazil
- Argentina
- Colombia
- Chile
- Peru
- Rest of South America
-
Europe
- United Kingdom
- Germany
- France
- Italy
- Spain
- Netherlands
- Poland
- Belgium
- Sweden
- Rest of Europe
-
Asia-Pacific
- China
- Japan
- India
- South Korea
- Australia
- Indonesia
- Thailand
- Singapore
- Rest of Asia-Pacific
-
Middle East and Africa
- Saudi Arabia
- South Africa
- United Arab Emirates
- Nigeria
- Morocco
- Egypt
- Turkey
- Rest of Middle East and Africa
-
North America
Data Sources, Market Sizing, and Validation
Desk Research
Desk work starts by mapping how beeswax moves from beekeeping to processors, traders, and end users, and then linking that flow to measurable statistics. Public sources were used to anchor supply and trade signals, such as FAOSTAT for apiculture outputs, UN Comtrade for beeswax-related trade flows, and national agriculture ministries for beekeeping and hive data where available.
We also reviewed standards and technical references (for example, ISO or pharmacopeia-style documents that spell out typical quality requirements), along with peer-reviewed papers that discuss composition, yield, and purification losses. Company filings, investor presentations, association websites, and credible press were used to cross-check capacity additions, demand shifts, and price movements. Where needed, paid subscriptions were used only for company financials and intelligence, patent databases, and shipment-level import and export data to validate directional patterns. These sources are illustrative and not exhaustive, and many other references were used for data collection, validation, and clarification.
Primary Interviews and Surveys
Primary work focused on interviews and surveys with beeswax processors, bulk traders, distributors, and end-use formulators, followed by quick re-contacts when assumptions moved. Since this is a global market, we ensured coverage across major producing and consuming regions so pricing, purity premiums, and channel margins were validated against buying behavior reported by respondents.
Distribution of primary research fieldwork respondents
| Company type | Respondent position | Region |
|---|---|---|
| Top tier: 38% | CXOs: 12% | APAC: 42% |
| Mid tier: 44% | Functional/Unit leaders: 35% | EMEA: 31% |
| Smaller Players: 18% | Managers: 53% | Americas: 27% |
Market-Sizing & Forecasting
Sizing is built using a top-down approach where production and trade data are used to reconstruct the commercially available beeswax pool by region, which is then adjusted for typical processing losses and cross-border re-exports. Once that pool is formed, it is converted into value using observed wholesale price ranges by grade, followed by channel margin checks so the final numbers reflect market transactions.
To keep the model practical, we used a small set of inputs that have clear links to beeswax supply and demand, such as beekeeping output trends, export and import volumes, the share of refined versus crude wax sold, average price spreads between yellow and white wax, and demand indicators from cosmetics and pharmaceutical formulation activity. When the data series had gaps, we used conservative proxy steps like regional averages, nearby-country trade behavior, and interview-based ratios, then tested sensitivity so one assumption could not swing the total too heavily. Forecasting is done using scenario analysis supported by regression-style checks, where the key drivers (trade volumes, pricing progression, and demand pull from personal care and pharma) are moved in line with what interviewees expect and what public indicators can support.
Data Validation & Update Cycle
Validation is done by comparing the model outputs against independent signals, including visible trade balances, price movements, and regional supply constraints, and then reviewing unusual jumps country by country. If a variance cannot be explained by a known event, we re-check the input series and re-contact sources to confirm whether the change is real or only a reporting artifact.
Before sign-off, the market model and assumptions are reviewed in multiple steps by another analyst so calculation logic, currency handling, and year alignment are consistent. The report is refreshed annually, and interim updates are made when material events occur, such as sharp price swings, policy changes affecting beekeeping, or major supply disruptions. Right before delivery, a final pass is performed so clients receive the latest updated view.
Mordor Intelligence's Beeswax Market Size Compared With Other Published Estimates
Published beeswax market values can vary a lot, even when the headline market name looks identical, because the counted products, pricing points, and time alignment are not always the same. Differences also show up when one estimate leans more on trade and production signals, while another leans more on end-use demand assumptions that are harder to observe.
The main gap comes from whether refined and blended wax streams, plus downstream markups, are counted as part of the core beeswax value, and Mordor Intelligence keeps the scope tied to commercially traded beeswax and typical wholesale pricing by region, before final-product value is layered in. A second driver is how price progression is handled, since some sources apply one global average price, while others adjust for grade mix changes and purity premiums. Timing also matters because currency conversion dates and the chosen base year can shift the value even when volume signals are similar.
Benchmark comparison
| Source | Market Size | Gaps in Research Methodology |
|---|---|---|
| Mordor Intelligence | USD 606.91 M (2026) | |
| Global Consultancy A | USD 642.02 M (2025) | Uses an earlier base year and typically applies broader application coverage with a single global growth and price path, which can pull in more downstream value and lift the headline figure versus a traded-wax view. |
| Industry Publisher B | USD 563.00 M (2024) | Anchors on an older base year and may under-capture newer price lifts and trade recovery, and the grade-mix and channel margin treatment is less transparent, which can compress the market value. |
The spread across sources is mostly explained by what is treated as market value, the base year chosen, and how grade-related pricing is updated over time. By keeping each step traceable to production, trade, and realistic wholesale pricing checks, our estimate stays easier to reproduce and to adjust when new supply or demand signals emerge.


Key Questions Answered in the Report
What is the estimated global value of the beeswax market in 2026?
The beeswax market size reached USD 606.91 million in 2026.
Which application segment consumes the most beeswax?
Cosmetics lead, accounting for 38.94% of 2025 revenue and expanding at a 6.23% CAGR through 2031.
Why are synthetic waxes gaining traction?
They offer consistent quality and residue-free profiles, supporting a 5.91% CAGR, particularly in pharmaceutical and food-contact uses.
Which region dominates beeswax production?
Asia-Pacific supplies 37.69% of global revenue, driven primarily by India’s large-scale output.
Page last updated on:


 Your data is secure and never sold or shared.


