Authentication And Brand Protection Market Size and Share
Market Overview
| Study Period | 2020 - 2031 |
|---|---|
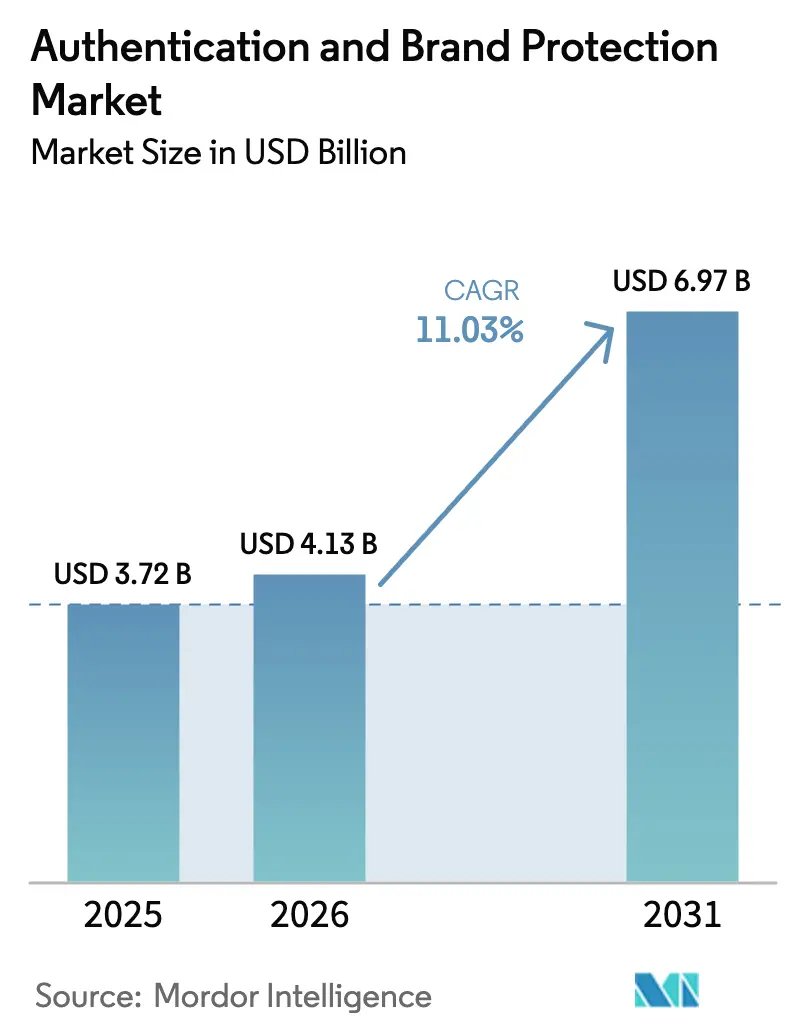
| Market Size (2026) | USD 4.13 Billion |
| Market Size (2031) | USD 6.97 Billion |
| Growth Rate (2026 - 2031) | 11.03% CAGR |
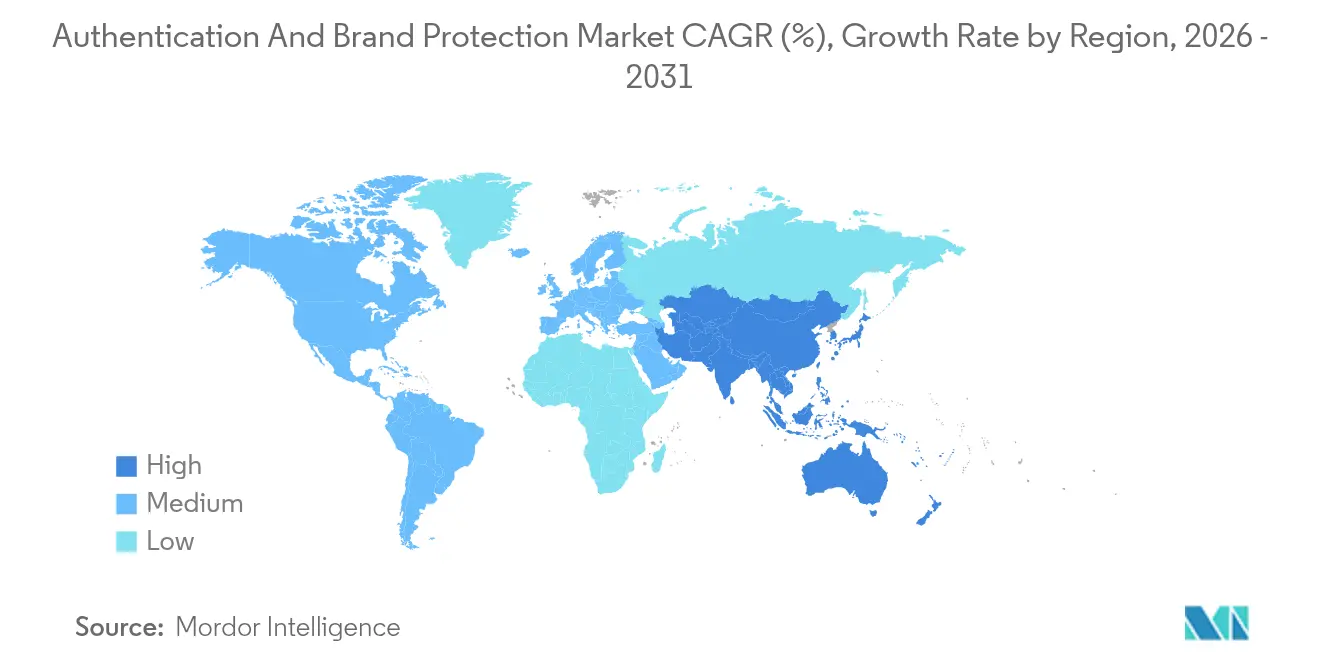
| Fastest Growing Market | Asia Pacific |
| Largest Market | North America |
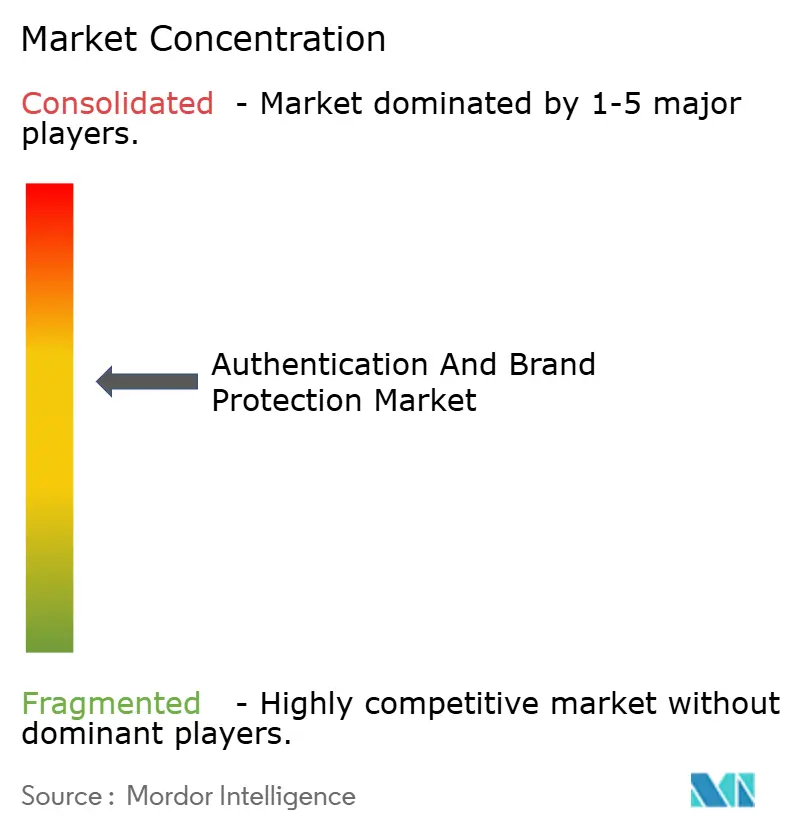
| Market Concentration | Medium |
Major Players *Disclaimer: Major Players sorted in no particular order Image © Mordor Intelligence. Reuse requires attribution under CC BY 4.0. | |
Authentication And Brand Protection Market Analysis by Mordor Intelligence
The authentication and brand protection market size is expected to grow from USD 3.72 billion in 2025 to USD 4.13 billion in 2026 and is forecast to reach USD 6.97 billion by 2031 at 11.03% CAGR over 2026-2031. Uptake accelerates as regulators impose serialization mandates, luxury houses digitize provenance records, and e-commerce magnifies cross-border counterfeit risk. Pharmaceutical compliance deadlines under the FDA’s Drug Supply Chain Security Act (DSCSA) concentrate near-term spending, while the European Union’s Digital Product Passport rules extend similar requirements to high-end apparel and accessories. Blockchain-secured ledgers, RFID/NFC tags, and QR-centric smartphone checks now form an integrated security stack that supports both supply-chain auditability and direct-to-consumer engagement. The ascent of AI-generated counterfeits and data-sovereignty laws raises implementation complexity, yet it also heightens board-level recognition that brand protection is mission-critical infrastructure.
Key Report Takeaways
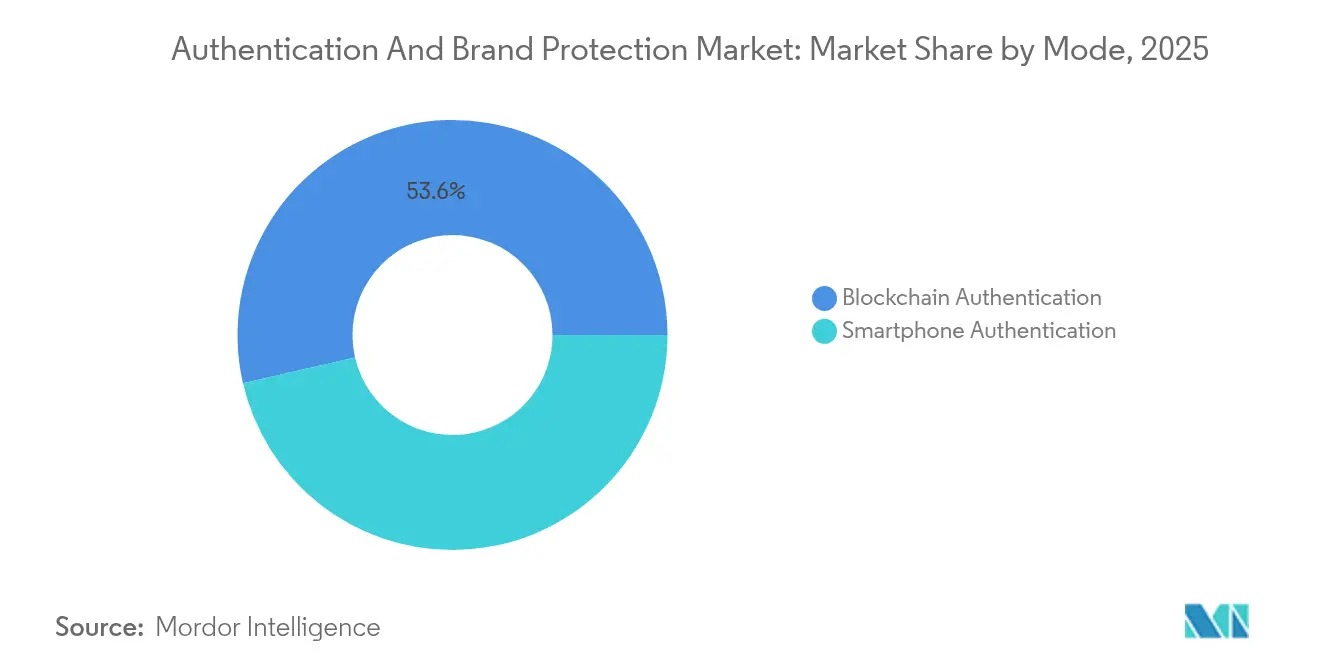
- By mode, blockchain authentication held 53.60% of authentication and brand protection market share in 2025; smartphone authentication is projected to expand at a 12.13% CAGR through 2031.
- By technology, RFID/NFC commanded 28.40% share of the authentication and brand protection market size in 2025, while QR codes post the fastest 11.54% CAGR to 2031.
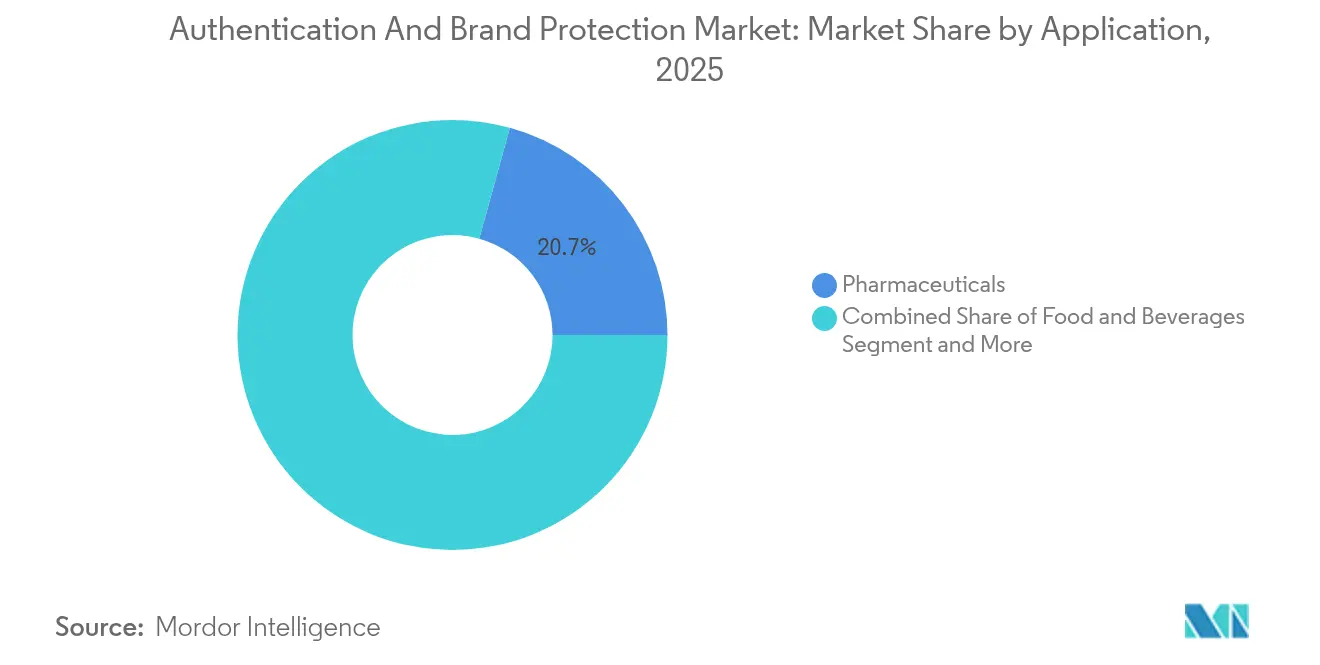
- By application, pharmaceuticals captured 20.70% of authentication and brand protection market size in 2025; luxury goods and fashion lead growth at a 11.87% CAGR through 2031.
- By end-user, brand owners and manufacturers represented 68.50% of demand in 2025; law-enforcement agencies demonstrate an 10.74% CAGR as public-sector investment rises.
- By geography, North America generated 32.10% of 2025 revenue, as Asia Pacific is set to grow 11.98% annually up to 2031.
Note: Market size and forecast figures in this report are generated using Mordor Intelligence’s proprietary estimation framework, updated with the latest available data and insights as of 2026.
Global Authentication And Brand Protection Market Trends and Insights
Drivers Impact Analysis*
| Driver | (~) % Impact on CAGR Forecast | Geographic Relevance | Impact Timeline |
|---|---|---|---|
| Rising FDA DSCSA serialization deadlines for U.S. pharma | +2.1% | North America, with spillover to global pharma supply chains | Short term (≤ 2 years) |
| Exploding cross-border e-commerce from China to Europe | +1.8% | Global, with concentration in China-EU trade corridors | Medium term (2-4 years) |
| Luxury brands' pivot to NFC-enabled "digital passports" | +1.5% | Europe, North America, with expansion to Asia Pacific | Medium term (2-4 years) |
| F&B recalls accelerating adoption of tamper-evident QR | +1.2% | Global, with early adoption in North America and Europe | Short term (≤ 2 years) |
| Blockchain-backed carbon-traceability mandates in DACH | +0.9% | DACH region, expanding to broader EU | Long term (≥ 4 years) |
| GCC excise-tax stamps for tobacco and alcohol | +0.6% | Middle East, with potential expansion to emerging markets | Medium term (2-4 years) |
| Source: Mordor Intelligence | |||
Rising FDA DSCSA serialization deadlines
Pharmaceutical traceability rules finalize in November 2025, obliging every U.S. supply-chain actor to exchange EPCIS data and verify unique identifiers.[1]Food and Drug Administration, “Drug Supply Chain Security Act Product Tracing Requirements,” fda.gov TraceLink’s full set of GS1 US Trustmarks illustrates the interoperability hurdle and reinforces the premium on vendor experience. Global producers standardize on U.S. requirements to avoid dual inventories, effectively extending DSCSA influence worldwide.
Exploding cross-border e-commerce from China to Europe
Operation Calypso exposed EUR 700 million (USD 749 million) in duty fraud, underlining how counterfeiters exploit fragmented customs checks.[2]European Public Prosecutor’s Office, “Investigation Calypso,” eppo.europa.eu Beijing’s Smart Customs system processes 260 billion data records with AI image analytics, establishing a new baseline for digital risk screening. Brands bolster authentication budgets to keep pace with this technological escalation.
Luxury brands’ pivot to NFC-enabled digital passports
EU Digital Product Passport obligations took effect in 2024, making item-level provenance compulsory for luxury goods. LVMH, Prada, and Cartier jointly back the Aura Blockchain Consortium to issue immutable certificates that shoppers read with a tap of their phones. Semiconductor firms like STMicroelectronics supply secure NFC silicon that embeds cryptographic keys at the point of manufacture.[3]STMicroelectronics, “Blockchain & NFC for Luxury Brands,” st.com
F&B recalls accelerating tamper-evident QR adoption
The FDA’s 2024 warnings to PepsiCo on Salmonella risks renewed executive focus on rapid trace-and-isolate capabilities. Governments now mandate scannable excise stamps; Kenya’s Soma Label app verifies bottled-water authenticity at point of sale.
Restraints Impact Analysis*
| Restraint | (~) % Impact on CAGR Forecast | Geographic Relevance | Impact Timeline |
|---|---|---|---|
| AI-generated "super-fakes" lowering counterfeit cost curve | -1.4% | Global, with concentration in major counterfeiting hubs | Short term (≤ 2 years) |
| High unit-cost of DNA taggants for low-margin FMCG | -0.8% | Global, particularly affecting emerging markets | Medium term (2-4 years) |
| Inter-operability gaps between national track-and-trace hubs | -0.7% | Global, with acute challenges in cross-border trade | Long term (≥ 4 years) |
| Data-sovereignty restrictions slowing cloud deployment | -0.6% | Regional, with varying intensity across jurisdictions | Medium term (2-4 years) |
| Source: Mordor Intelligence | |||
AI-generated super-fakes lowering counterfeit cost curve
Generative AI allows crime groups to copy security inks, holograms, and even microscopic patterns, eroding the deterrent value of first-generation features. Bosch’s Origify platform responds with optical signatures that register invisible surface topology, yet higher R&D spend pressures vendor margins.
Data-sovereignty restrictions slowing cloud deployment
Russia, China, and Saudi Arabia now require in-country hosting of product ledgers, fragmenting global platforms into regional silos. Providers invest in multi-tenant sovereign clouds or pursue edge processing to sidestep transfer bans, a move that adds operating cost and lengthens deployment cycles.
*Our forecasts treat driver/restraint impacts as directional, not additive. The impact forecasts reflect baseline growth, mix effects, and variable interactions.
Segment Analysis
By Mode: Blockchain Dominance Meets Mobile Innovation
Blockchain authentication accounted for a 53.60% share of the authentication and brand protection market in 2025, reflecting enterprise faith in tamper-proof ledgers that satisfy audit requirements. Smartphone authentication records a 12.13% CAGR through 2031 as brands seek consumer-driven validation at low incremental cost. Immutable blockchain entries secure serialization data, while user-friendly mobile apps convert verification into a loyalty touchpoint. The combination compresses the cost of trust while widening coverage across post-purchase channels.
The authentication and brand protection market size attached to smartphone-centric deployments is projected to add USD 1.17 billion between 2026 and 2031, supported by universal camera access and falling tag pricing. Luxury groups pair QR or NFC tags with blockchain roots to meet both compliance and engagement objectives. Pharmaceutical wholesalers rely on distributed ledgers for pedigree reconciliation, a practice that regulators now treat as best-in-class.


By Type: Overt Features Lead Digital Transformation
Overt features such as holograms and color-shifting inks retained 36.70% revenue in 2025, because visible cues still reassure end-consumers at first glance. Digital formats register a 12.31% CAGR through 2031 as companies embed cryptographic codes that update over the air. Covert and forensic features remain critical for customs and law-enforcement inspections, yet their adoption rate trails due to higher unit cost.
The authentication and brand protection market benefits from hybrid labels that combine overt design with a dynamic digital payload. Shoppers now scan a hologram-backed QR to unlock carbon disclosures, while inspectors rely on ultraviolet threads that connect to back-office dashboards. Such multi-layer structures future-proof investments against rising AI counterfeit threats.
By Offering: Products Foundation Enables Services Growth
Security-feature products delivered 63.00% of 2025 turnover because every scheme begins with a physical marker. Service revenue accelerates at 11.92% CAGR as clients outsource program design, tag issuance, and anomaly analytics. Solution platforms, notably track-and-trace suites, sit between product and service lines by transforming static identifiers into transactional data.
Authentication strategists now bundle consulting with subscription analytics to lift lifetime value. Pharmaceutical clients purchase serialised labels then pay for recall simulation exercises. In parallel, customs agencies license machine-vision algorithms that flag high-risk shipments, a model that pushes recurring revenue above one-off hardware sales.
By Technology: RFID Leadership Faces QR Code Disruption
RFID/NFC retained a 28.40% share because the tags carry ample data, survive harsh logistics, and enable contactless scan speeds. QR codes grow fastest at 11.54% CAGR given their near-zero marginal cost and smartphone reach. DNA taggants and digital watermarking remain niche, yet they command premium pricing where forensic certainty overrides budget constraints.
Avery Dennison’s USD 100 million RFID hub in Mexico illustrates long-run confidence in radio-frequency tech. Simultaneously, food brands deploy variable QR codes that rotate every production lot, creating a moving target for counterfeiters. This dual-track landscape ensures no single technology monopolizes spend, which sustains vendor diversity.
By Authentication Channel: Mobile Apps Drive Consumer Engagement
Mobile apps generated 46.60% of 2025 revenue as camera-based scans became routine in everyday shopping. Embedded hardware grows 11.63% annually because IoT sensors now ship with built-in crypto chips that attest originality on power-up. Web portals remain for enterprise dashboards, yet end-users seldom open laptops just to authenticate goods.
The rise of NFC-enabled digital product passports joins mobile ease with chipset security. Identiv and partners promote unified standards so any compliant phone can validate origin without special software. Such harmonization lowers onboarding friction across global markets.
By Application: Pharmaceuticals Anchor Luxury Growth
Pharmaceuticals delivered 20.70% of 2025 revenue due to mandatory unit-level codes. Luxury goods and fashion advance 11.87% yearly as counterfeit handbags, sneakers, and watches erode brand equity. Food and beverage applications spike whenever safety recalls dominate headlines, proving that consumer trust is perishable.
Authentication and brand protection market share in luxury is poised to exceed 15.35% by 2031 as every premium item ships with a digital identity card. Tradelinked serials in medicines reduce diversion losses; NFC passports in couture create post-sale storytelling. Both sectors illustrate how compliance and marketing now intersect.
By End-User: Brand Owners Lead Law-Enforcement Acceleration
Brand owners and manufacturers held 68.50% of demand in 2025 because liability rests with the trademark holder. Law-enforcement uptake climbs at 10.74% CAGR as agencies deploy forensic kits and cloud dashboards to disrupt supply chains. Distributors, wholesalers, and 3PLs integrate scanners at cross-dock points to maintain custody integrity.
Authentication programs succeed when every node participates, so contractual clauses increasingly oblige logistics partners to scan serialized codes. Regulators fine non-compliant actors, which nudges even resistant wholesalers to modernize. Vendors that deliver plug-and-play modules gain share fastest.
Geography Analysis
North America contributed 32.10% of 2025 revenue, supported by stringent DSCSA enforcement and mature e-commerce that rewards sellers who offer proof of authenticity. The authentication and brand protection market size for the region is forecast to reach USD 2.82 billion by 2031, sustained by repeat pharmaceutical orders and strong adoption in food safety programs.
Europe ranks second through its Digital Product Passport and EUDR frameworks that force upstream logging of material provenance. Luxury conglomerates headquartered in Paris and Milan scale blockchain deployments region-wide, ensuring traceability past the point of sale. Customs authorities adopt AI screeners funded by Operation Calypso seizures, catalyzing further investment in authentication scanners.
Asia Pacific records the highest 11.98% CAGR to 2031. Rising middle-class consumption, rampant marketplace imports, and government smart-customs initiatives converge. China’s AI inspection platform sets best practice for other ASEAN members. Brands respond by embedding variable QR codes localized to language and tax rules per market.

Competitive Landscape
The field remains moderately fragmented. The top five players control slightly below 40% combined revenue, reflecting high specialization by technology and vertical. Leaders differentiate through vertically integrated stacks that pair physical markers with software analytics. TraceLink’s 16 GS1 trustmarks signal regulatory depth, while Digimarc’s digital watermark patents strengthen deterrence against illicit replication.
Strategic investments focus on plant expansion, cloud analytics, and consortium governance. Avery Dennison scales RFID capacity to lock in cost leadership, pursuing LEED certification to align with sustainability procurement criteria. De La Rue pivots to SaaS-based Traceology to create annuity income and smooth cyclical passport orders.
Partner ecosystems form another battleground. Semiconductor giants seed reference designs with security IP blocks, aiming to become default silicon in every smart label. Consulting firms bundle digital-passport advisory into ESG offerings, embedding brand protection inside broader value-chain transformation projects.
Authentication And Brand Protection Industry Leaders
Authentix.
AlpVision SA
De La Rue plc
Honeywell International Inc.
Avery Dennison Corporation.
- *Disclaimer: Major Players sorted in no particular order

Recent Industry Developments
- March 2025: Forest Stewardship Council launched FSC Trace, a blockchain platform that automates deforestation-compliance records and strengthens chain-of-custody credibility.
- January 2025: TraceLink secured all 16 GS1 US conformance trustmarks, positioning its network as the de-facto standard for DSCSA data exchange.
- December 2024: IDEMIA released IDQR, a laser-engraved code that merges physical durability with remote biometric verification.


Global Authentication And Brand Protection Market Report Scope
Authentication and brand protection encompass a range of technologies and strategies aimed at verifying product authenticity End users are increasingly adopting pay-as-you-go and subscription models. Vendors in these sectors often forge long-term partnerships with their clients, leading to revenue generation through sales.
The authentication and brand protection market is segmented by mode (smartphone authentication and blockchain authentication), by type (overt, covert, forensic, and digital), by technology type (security labels & ink, holograms, barcodes, RFID, QR codes, invisible ink and graphics, and microprinting), by application (pharmaceuticals, retail and e-commerce, BFSI, consumer electronics, manufacturing, government, and others (building and construction, luxury goods etc), by geography (North America, Europe, Asia Pacific, Latin America, Middle East and Africa). The market sizes and forecasts are provided in terms of value (USD) for all the above segments.
| Smartphone Authentication |
| Blockchain Authentication |
| Overt |
| Covert |
| Forensic |
| Digital |
| Products (Security Features) |
| Solutions (Track-and-Trace / Serialization) |
| Services (Managed and Consulting) |
| Security Labels and Inks |
| Holograms |
| Barcodes |
| RFID / NFC |
| QR Codes |
| Invisible Ink and Graphics |
| Microprinting |
| Digital Watermarking |
| DNA Tagging |
| Online / Web |
| Mobile Apps |
| Embedded Hardware |
| Pharmaceuticals |
| Food and Beverages |
| Retail and E-commerce |
| Consumer Electronics |
| Automotive and Industrial |
| Luxury Goods and Fashion |
| Tobacco and Alcohol |
| Government Documents and Currency |
| Others (Aerospace, Agrochemicals, Building Materials) |
| Brand Owners / Manufacturers |
| Distributors / Wholesalers |
| Logistics and 3PL |
| Law Enforcement |
| North America | United States | |
| Canada | ||
| Mexico | ||
| South America | Brazil | |
| Argentina | ||
| Rest of South America | ||
| Europe | United Kingdom | |
| Germany | ||
| France | ||
| Italy | ||
| Spain | ||
| Nordics | ||
| Benelux | ||
| Rest of Europe | ||
| Asia Pacific | China | |
| Japan | ||
| India | ||
| South Korea | ||
| ASEAN | ||
| Australia | ||
| New Zealand | ||
| Rest of Asia Pacific | ||
| Middle East and Africa | Middle East | GCC |
| Turkey | ||
| Israel | ||
| Rest of Middle East | ||
| Africa | South Africa | |
| Nigeria | ||
| Egypt | ||
| Rest of Africa | ||
| By Mode | Smartphone Authentication | ||
| Blockchain Authentication | |||
| By Type | Overt | ||
| Covert | |||
| Forensic | |||
| Digital | |||
| By Offering | Products (Security Features) | ||
| Solutions (Track-and-Trace / Serialization) | |||
| Services (Managed and Consulting) | |||
| By Technology | Security Labels and Inks | ||
| Holograms | |||
| Barcodes | |||
| RFID / NFC | |||
| QR Codes | |||
| Invisible Ink and Graphics | |||
| Microprinting | |||
| Digital Watermarking | |||
| DNA Tagging | |||
| By Authentication Channel | Online / Web | ||
| Mobile Apps | |||
| Embedded Hardware | |||
| By Application | Pharmaceuticals | ||
| Food and Beverages | |||
| Retail and E-commerce | |||
| Consumer Electronics | |||
| Automotive and Industrial | |||
| Luxury Goods and Fashion | |||
| Tobacco and Alcohol | |||
| Government Documents and Currency | |||
| Others (Aerospace, Agrochemicals, Building Materials) | |||
| By End-User | Brand Owners / Manufacturers | ||
| Distributors / Wholesalers | |||
| Logistics and 3PL | |||
| Law Enforcement | |||
| By Geography | North America | United States | |
| Canada | |||
| Mexico | |||
| South America | Brazil | ||
| Argentina | |||
| Rest of South America | |||
| Europe | United Kingdom | ||
| Germany | |||
| France | |||
| Italy | |||
| Spain | |||
| Nordics | |||
| Benelux | |||
| Rest of Europe | |||
| Asia Pacific | China | ||
| Japan | |||
| India | |||
| South Korea | |||
| ASEAN | |||
| Australia | |||
| New Zealand | |||
| Rest of Asia Pacific | |||
| Middle East and Africa | Middle East | GCC | |
| Turkey | |||
| Israel | |||
| Rest of Middle East | |||
| Africa | South Africa | ||
| Nigeria | |||
| Egypt | |||
| Rest of Africa | |||


Key Questions Answered in the Report
Why is the authentication and brand protection market growing at double-digit pace?
Government serialization mandates, AI-driven counterfeiting threats, and brand-owner demand for direct consumer engagement underpin the 11.03% CAGR over 2026-2031.
Which segment adds the most revenue between 2026 and 2031?
Smartphone authentication contributes the largest incremental gain as universal camera phones lower adoption barriers.
How do blockchain and QR codes complement each other?
Blockchain secures immutable ledgers, while QR codes offer a low-cost consumer interface that retrieves the blockchain record, marrying security with convenience.
What does DSCSA compliance require by November 2025?
U.S. pharma stakeholders must verify and exchange EPCIS data for every saleable unit, a mandate that elevates serialization platforms to core operational systems.
Page last updated on:


