Market Overview
| Study Period | 2020 - 2031 |
|---|---|
| Forecast Data Period | 2026 - 2031 |
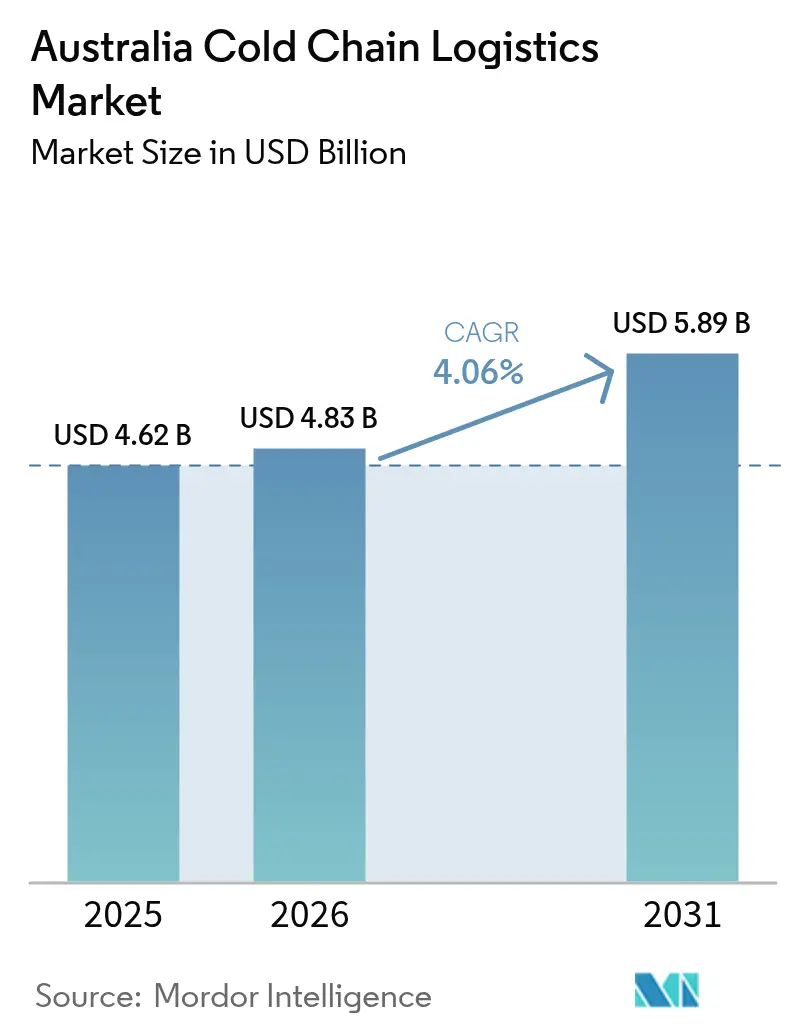
| Base Year Market Size (2025) | USD 4.62 Billion |
| Market Size (2026) | USD 4.83 Billion |
| Market Size (2031) | USD 5.89 Billion |
| Growth Rate (2026 - 2031) | 4.06% CAGR |
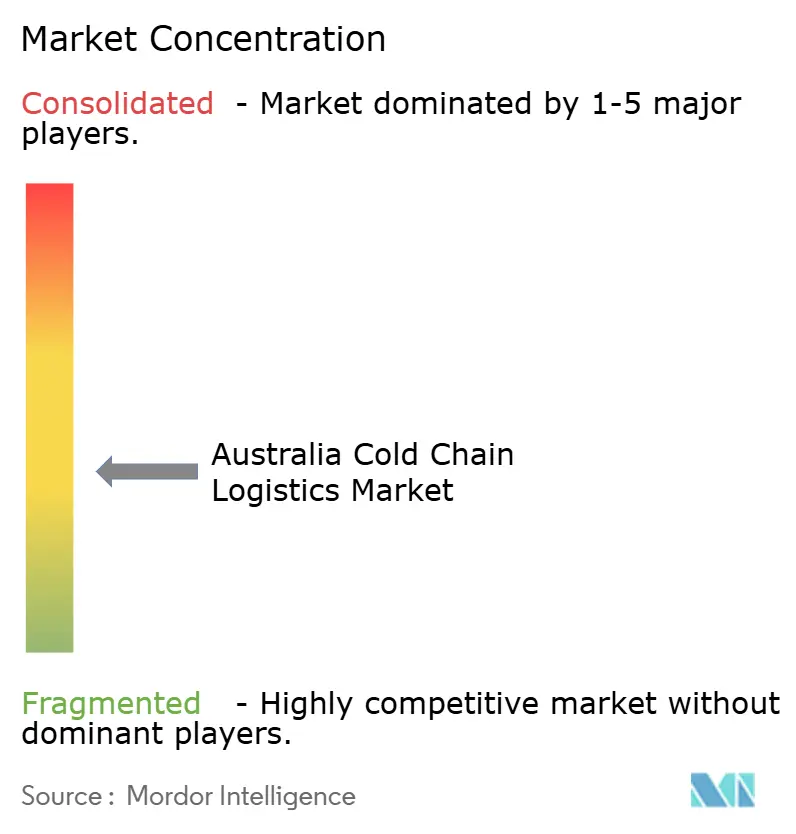
| Market Concentration | Medium |
Major Players *Disclaimer: Major Players sorted in no particular order Image © Mordor Intelligence. Reuse requires attribution under CC BY 4.0. | |
Australia Cold Chain Logistics Market Analysis by Mordor Intelligence
The Australia cold chain logistics market size is projected to reach from USD 4.62 billion in 2025 to USD 4.83 billion in 2026, and to reach USD 5.89 billion by 2031, growing at a CAGR of 4.06% from 2026 to 2031.
Growing meal-kit subscriptions, live-seafood export recovery, and mandatory Scope-3 emission reporting are reshaping service mix, technology priorities, and modal choices across the cold chain logistics Australia market. Operators are expanding hydrogen fuel-cell pilots, AI-based predictive-maintenance platforms, and telemetry-enabled containers to cut downtime, slash spoilage, and meet decarbonization targets. Yet pallet-pool imbalances, biosecurity-related port delays, and volatile HFO refrigerant prices continue to compress margins and complicate capital planning within the cold chain logistics Australia market. Consolidation momentum is visible as Lindsay Australia, Lineage Logistics, and NewCold race to secure scale advantages while niche providers specialize in micro-fulfillment, deep-frozen pharmaceuticals, and premium seafood links.
Key Report Takeaways
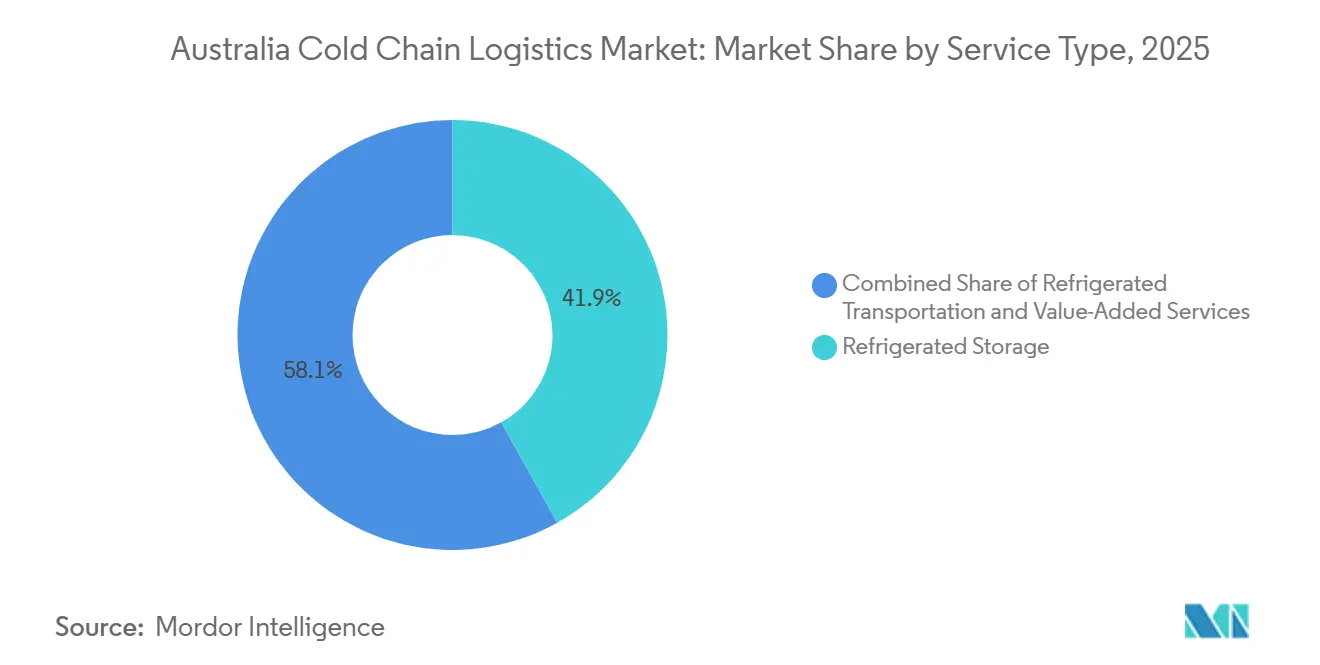
- By service type, refrigerated storage led with 41.91% of Australia cold chain logistics market share in 2025, value-added services are forecast to expand at a 4.64% CAGR to 2031.
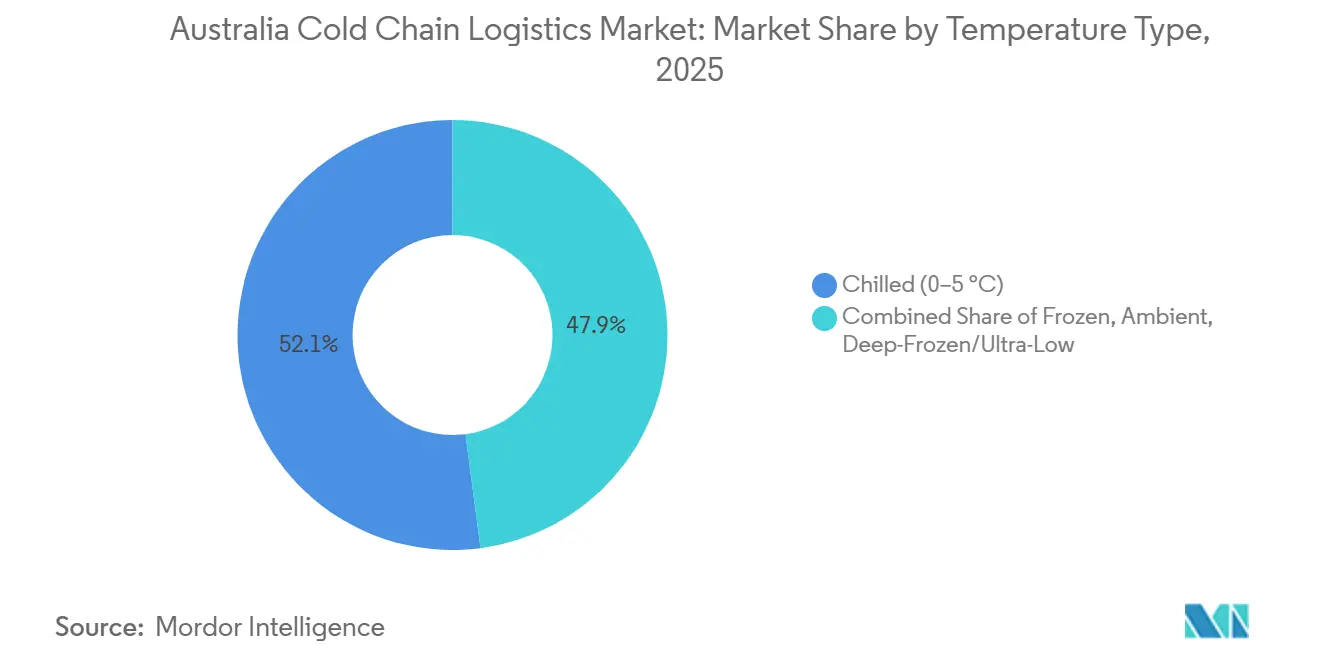
- By temperature type, chilled applications commanded 52.07% of the Australia cold chain logistics market size in 2025, while deep-frozen and ultra-low segments are projected to grow at a 5.23% CAGR through 2031.
- By application, meat & poultry accounted for 23.73% of the Australia cold chain logistics market in 2025, and ready-to-eat meals are advancing at a 5.17% CAGR through 2031.
Note: Market size and forecast figures in this report are generated using Mordor Intelligence’s proprietary estimation framework, updated with the latest available data and insights as of 2026.
Australia Cold Chain Logistics Market Trends and Insights
Drivers Impact Analysis*
| Driver | (~) % Impact on CAGR Forecast | Geographic Relevance | Impact Timeline |
|---|---|---|---|
| Meal-kit & Q-commerce boom driving dense micro-cold depots | +0.7% | Sydney, Melbourne, Brisbane metro zones | Short term (≤ 2 years) |
| Food-waste-to-landfill targets catalyzing digitized cold chains | +0.5% | National, food-manufacturing hubs | Medium term (2-4 years) |
| Live-seafood export surge demanding telemetry-enabled fresh logistics | +0.4% | Tasmania, South Australia, Western Australia | Short term (≤ 2 years) |
| Scope-3 emission accounting nudging modal shift to reefer rail & coastal shipping | +0.6% | Interstate corridors, port cities | Long term (≥ 4 years) |
| AI-based predictive-maintenance platforms lowering reefer downtime | +0.5% | National, fleet operators | Medium term (2-4 years) |
| Hydrogen fuel-cell reefer trucks piloted for long-haul decarbonization | +0.3% | Queensland, Western Australia pilot zones | Long term (≥ 4 years) |
| Source: Mordor Intelligence | |||


Meal-Kit & Q-Commerce Boom Driving Dense Micro-Cold Depots
Woolworths operated more than 100 Metro60 outlets by 2026, each integrating multi-temperature zones that hold fresh produce at 2-4 °C and frozen SKUs at -18 °C. Coles’ automated customer fulfillment centers now push 10,000+ online orders daily through chilled pick zones, while dedicated last-mile fleets equipped with insulated totes protect temperature integrity on 30-minute routes. Meal-kit firms such as HelloFresh and Marley Spoon rely on sortation hubs near capital cities, dispatching 120,000 kits a week in refrigerated vans that sustain 0-5 °C envelopes until doorstep drop-off. Rapid-grocery partnerships between Uber Eats, DoorDash, and independent grocers are turning dark-store footprints into high-density cold chain logistics Australia market nodes[1]Australian Competition and Consumer Commission, “Supermarkets Inquiry 2024-25,” accc.gov.au.
Food-Waste-to-Landfill Targets Catalyzing Digitized Cold Chains
Australia aims to halve food waste by 2030; perishable freight currently generates roughly a quarter of the 7.6 million tons lost each year. IoT sensors now blanket fleets to flag <0.5 °C deviations, blockchain ledgers create end-to-end temperature proofs, and AI demand-forecast engines trim stock-outs and over-ordering. Linfox has reduced shrinkage by 12% through predictive stock rotation, while Food Agility CRC pilots show digital traceability extends shelf life by up to three days for horticulture cargo[2]End Food Waste Australia, “Food Cold Chain Sector Action Plan,” endfoodwaste.com.au.
Live-Seafood Export Surge Demanding Telemetry-Enabled Fresh Logistics
Survival of live consignments hinges on water kept between 8-12 °C with real-time logging of dissolved oxygen and pH for the full 48-hour trip. Geraldton Fishermen’s Co-operative fitted reefers with Microlise telematics to provide continuous GPS and temperature feeds that satisfy Chinese import protocols. AI-driven computer-vision checks developed by iMOVE CRC verify species and grade, then post results to immutable ledgers that secure premium prices. Similar telemetry rigs now protect abalone and mud crab exports, elevating technology uptake across the cold chain logistics Australia market.
Scope-3 Emission Accounting Nudging Modal Shift to Reefer Rail & Coastal Shipping
From July 2025, large shippers must declare freight carbon, intensifying scrutiny of diesel-based chilled transport that burns 30-40% more fuel than ambient hauls. Pacific National’s Melbourne-Brisbane reefer service trims up to 70% emissions per tonne-kilometer, and the 1,700 km Inland Rail, due 2027, promises double-stacked container capacity for temperature-controlled loads. Intermodal models combining rail line-haul with short-haul road legs are already saving Woolworths and Coles 45% emissions on Adelaide-Perth dairy lanes. Coastal shipping trials between Sydney and Cairns show further potential once cabotage hurdles and plug-in reefer berths are resolved, strengthening the environmental credentials of the cold chain logistics Australia market.
Restraints Impact Analysis*
| Restraint | (~) % Impact on CAGR Forecast | Geographic Relevance | Impact Timeline |
|---|---|---|---|
| Pallet-pool imbalance and reverse-logistics gaps inflating back-haul costs | –0.5% | National, regional networks | Short term (≤ 2 years) |
| Port congestion & heightened biosecurity checks delaying perishables | –0.6% | Sydney, Melbourne, Brisbane ports | Medium term (2-4 years) |
| Escalating insurance premiums for temperature excursions | –0.4% | National, pharma corridors | Short term (≤ 2 years) |
| Volatile HFO refrigerant feedstock prices disrupting cap-ex budgeting | –0.5% | National, facility construction | Medium term (2-4 years) |
| Source: Mordor Intelligence | |||
Pallet-Pool Imbalance and Reverse-Logistics Gaps Inflating Back-Haul Costs
One-way pallet rentals have surged because 15-20% of CHEP and Loscam assets sit stranded in end-market regions, while outbound refrigerated back-hauls price 40-60% lower than inbound hauls, eroding incentives to reposition empties. Blockchain pilots by Linfox and Toll promise end-to-end pallet visibility but interoperability gaps slow scale-up. The Australian Packaging Covenant Organisation’s 2025 roadmap stresses reuse, yet lacks binding finance to fix structural imbalances.
Port Congestion & Heightened Biosecurity Checks Delaying Perishables
Average dwell time for containerized perishables climbed to 3.8 days in 2025 as intensified stink-bug and khapra beetle protocols required extra fumigation and manual inspections. Demurrage at USD 150-250 daily plus the new Biosecurity Protection Levy inflate import costs, while exporters of live seafood face 12-hour holds that jeopardize product vitality. Planned 2026 upgrades to the Integrated Cargo System aim to re-automate risk screening, yet transitional hiccups keep clearance times volatile, pressuring the cold chain logistics Australia market[3]Department of Agriculture, Fisheries and Forestry, “Container Inspection Fees,” agriculture.gov.au.
*Our forecasts treat driver/restraint impacts as directional, not additive. The impact forecasts reflect baseline growth, mix effects, and variable interactions.
Segment Analysis
By Service Type: Value-Added Services Capture Margin-Rich Complexity
By service type, refrigerated storage dominated the Australia cold chain logistics market size in 2025, accounting for a 41.91% share, while value-added services are projected to grow at a 4.64% CAGR through 2031. Refrigerated storage remained the backbone of the sector, anchored by advanced facilities such as NewCold’s automated warehouses offering 100,000-pallet capacity with AS/RS cranes operating at temperatures as low as –25 °C. Within this segment, public warehousing supports SMEs seeking seasonal flexibility, whereas private facilities leased by retailers ensure consistent, dedicated throughput.
At the same time, value-added services including blast-freezing, tempering, labelling, and cross-docking continued to command 20-40% margin premiums over basic storage, reflecting manufacturers’ increasing reliance on specialized providers. This trend is reinforced by the growth of grocery omnichannel models, which demand more precise inventory management. Together, integrated storage and transport solutions are strengthening customer retention and enhancing competitive positioning across the market.


By Temperature Type: Deep-Frozen Applications Gain Pharmaceutical and Premium Seafood Traction
By temperature type, chilled applications led the Australia cold chain logistics market share in 2025 with a 52.07% share, while deep-frozen and ultra-low segments are set to expand at a 5.23% CAGR through 2031. Chilled freight continues to underpin key supply chains such as dairy, fresh produce, and ready meals, all of which require tight 0–5 °C control. Frozen loads (-18 °C to 0 °C) still represent the core volume segment for products like ice cream, meat, and vegetables. However, demand is steadily shifting toward deep-frozen and ultra-low categories below -20 °C, driven by high-value applications including biologics and sashimi-grade seafood. The allocation of cold chain capacity for mRNA vaccine storage has also increased significantly, supported by investments such as GDP-certified freezers and expanded pharmaceutical production.
At the same time, capital intensity rises considerably for cascade and cryogenic systems capable of reaching -60 °C, yet end users are willing to absorb these costs due to the high-margin protection offered for sensitive goods like premium tuna exports and biologics. Advanced infrastructure developments now include GDP-validated ultra-low storage integrated with dedicated last-mile delivery units that maintain strict temperature compliance throughout transit. Additionally, energy-efficient ambient buffer vestibules between temperature zones are becoming standard practice, helping reduce thermal shock while significantly lowering energy consumption across multi-temperature warehouse environments
By Application: Ready-to-Eat Meals Accelerate Amid Urbanization and Convenience Demand
By application, meat and poultry remained the leading segment in the Australia cold chain logistics market in 2025 with a 23.73% share, while ready-to-eat meals are expected to grow at a 5.17% CAGR through 2031. In contrast, the rapid rise of ready-to-eat meals is being driven by dual-income households prioritizing convenience, pushing logistics providers to ensure consistent 2-4 °C delivery across last-mile networks.
Other segments are also shaping market dynamics with distinct temperature and handling requirements. Fruits and vegetables require strict 0–2 °C cold treatment, often extending up to 21 days for export products such as Asia-bound table grapes. Fish and seafood operators are investing in oxygenated tanks and real-time telemetry systems to preserve the value of live cargo. Dairy supply chains benefit from vertically integrated processing facilities and shared refrigerated transport fleets, while pharmaceuticals and biologics are increasingly dependent on ultra-cold storage solutions, with shipment volumes rising following recent capacity expansions. Together, these evolving needs are diversifying service offerings and sustaining investment momentum across the cold chain logistics Australia market.
Geography Analysis
New South Wales and Victoria form the core of Australia’s cold chain logistics market, supported by strong demand and established distribution networks, while limited industrial space in Sydney is accelerating the shift toward high-bay automated warehouses to enhance efficiency. At the same time, Melbourne continues to attract investment across key food and logistics precincts, with ongoing capacity expansions supporting steady regional growth and increasing demand from both domestic and export supply chains.
Brisbane leverages proximity to Queensland’s horticulture output and handles 45% of national perishable exports via its port, with specialized seafood and mango lanes feeding Asia. Western and South Australia each track near-4% growth, underpinned by live lobster, wine, and mining camp catering contracts that demand robust cold supply into remote areas. Tasmania’s niche premium seafood channels funnel through Hobart and Launceston air freight nodes, justifying telemetry-rich cold stores despite small volume[4]Inland Rail, “Project Overview,” artc.com.au .
The 1,700 km Inland Rail promises 60-70% emission cuts per tons-kilometer and could divert 10-15% of interstate cold freight from road once operational in 2027. Satellite warehouses in Albury-Wodonga, Toowoomba, and Bunbury help major 3PLs shorten last-mile distances and uphold shelf-life integrity across vast Australian geographies, safeguarding growth of the cold chain logistics Australia market.
Competitive Landscape
The cold chain logistics Australia market shows moderate fragmentation: the top 10 operators held about 38% combined share in 2025. NewCold cemented leadership by pairing automated warehouses with a recently acquired transport arm, while Lineage Logistics’ July 2024 IPO unlocked capital for acquisitions such as Fremantle City Coldstores. Lindsay Australia’s AUD 108.2 million (USD 69.25 million). SRT takeover in May 2025 signaled consolidation pressure as scale advantages around fleet utilization and multi-temperature density become pivotal.
Technology is the principal battleground. AI predictive-maintenance modules now differentiate service reliability; blockchain traceability secures export premiums; and hydrogen or battery-electric trucks win retailer RFQs linked to Scope-3 targets. Private-equity appetite remains high as infrastructure funds view temperature-controlled assets as resilient yield plays with secular e-grocery tailwinds.
White-space still exists. Micro-fulfillment hubs near CBDs, GDP-certified pharma vaults, and green-fuel long-haul corridors attract new entrants that carve defensible niches even as legacy 3PLs scale. Industry advocacy through the Australian Refrigerated Warehouse & Transport Association ensures safety codes and emissions standards evolve in tandem with technological innovation, sustaining orderly progression of the cold chain logistics Australia market.
Australia Cold Chain Logistics Industry Leaders
NewCold Advanced Cold Logistics
Toll Group
Linfox
Lineage Logistics
Americold Logistics
- *Disclaimer: Major Players sorted in no particular order

Recent Industry Developments
- December 2025: Americold Realty Trust announced a new partnership with Australian convenience retail brand On the Run to provide storage and distribution services supporting rapid national expansion essentially broadening Americold’s cold chain service scope.
- June 2025: NewCold announced a major expansion of cold logistics operations in Australia, including a new Sydney facility adding 100,000 frozen pallet positions
- May 2025: Lindsay Australia joined RWTA, expanding cold chain coverage across five states
- March 2025: Toll Group announced USD 200 million fleet upgrade adding nearly 400 Euro 6 prime movers.


Australia Cold Chain Logistics Market Report Scope
By Service Type
| Refrigerated Storage | Public Warehousing |
| Private Warehousing | |
| Refrigerated Transportation | Road |
| Rail | |
| Sea | |
| Air | |
| Value-Added Services |
By Temperature Type
| Chilled (0-5°C) |
| Frozen (-18-0°C) |
| Ambient |
| Deep-Frozen / Ultra-Low (less than-20°C) |
By Application
| Fruits and Vegetables |
| Meat and Poultry |
| Fish and Seafood |
| Dairy and Frozen Desserts |
| Bakery and Confectionery |
| Ready-to-Eat Meals |
| Pharmaceuticals and Biologics |
| Vaccines and Clinical Trial Materials |
| Chemicals and Specialty Materials |
| Other Perishables |
| By Service Type | Refrigerated Storage | Public Warehousing |
| Private Warehousing | ||
| Refrigerated Transportation | Road | |
| Rail | ||
| Sea | ||
| Air | ||
| Value-Added Services | ||
| By Temperature Type | Chilled (0-5°C) | |
| Frozen (-18-0°C) | ||
| Ambient | ||
| Deep-Frozen / Ultra-Low (less than-20°C) | ||
| By Application | Fruits and Vegetables | |
| Meat and Poultry | ||
| Fish and Seafood | ||
| Dairy and Frozen Desserts | ||
| Bakery and Confectionery | ||
| Ready-to-Eat Meals | ||
| Pharmaceuticals and Biologics | ||
| Vaccines and Clinical Trial Materials | ||
| Chemicals and Specialty Materials | ||
| Other Perishables | ||


Key Questions Answered in the Report
How large is the cold chain logistics Australia market in 2026?
It is estimated at USD 4.83 billion, positioned to grow to USD 5.89 billion by 2031.
Which service segment is expanding fastest through 2031?
Value-added services, covering blast-freezing, labeling, and cross-docking, are projected to advance at a 4.64% CAGR.
What temperature class is driving new infrastructure spending?
Deep-frozen and ultra-low storage below –20 °C, largely for biologics and premium seafood, is set to grow at 5.23% CAGR.
Which restraint has the greatest negative impact on growth?
Biosecurity-related port delays reduce forecast CAGR by 0.6%, more than any other current headwind.
How are electricity costs influencing strategy?
Tripled power prices prompt operators to adopt solar roofs, airtight construction, and low-GWP refrigerants to curb operating expenses.
How are Scope-3 emission rules changing freight choices?
Mandatory reporting from July 2025 is steering long-haul perishables toward rail and, where viable, coastal shipping to cut carbon up to 70%.
Page last updated on:


