
Market Overview
| Study Period | 2021 - 2031 |
|---|---|
| Forecast Data Period | 2026 - 2031 |
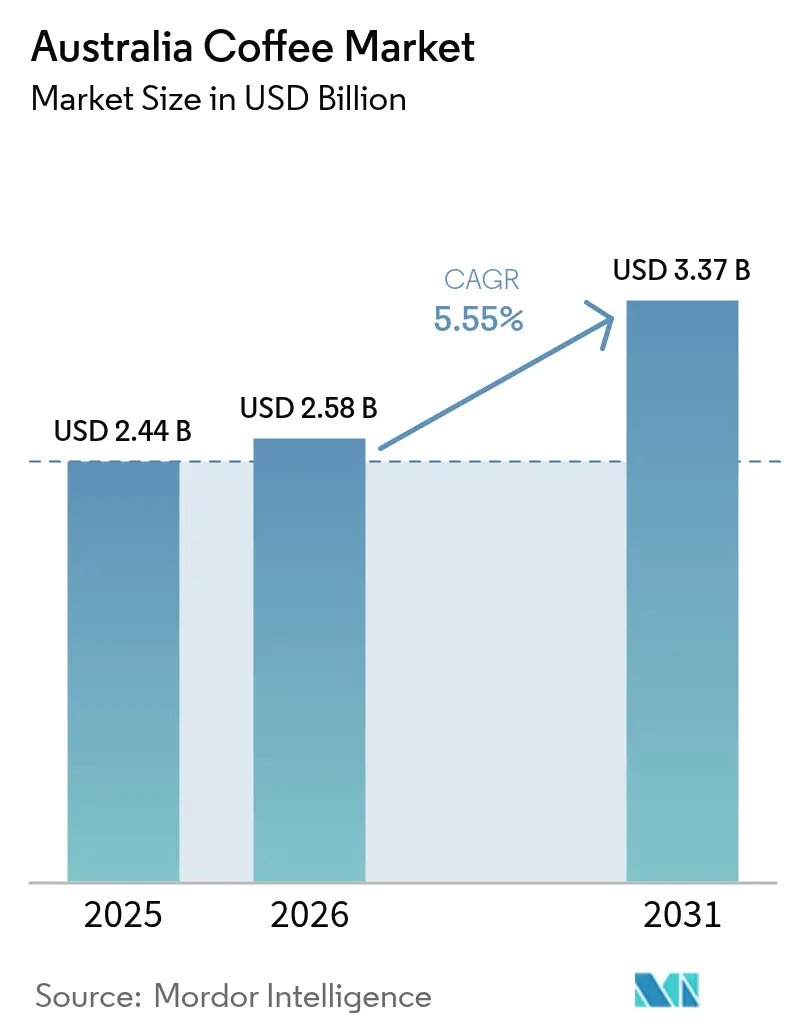
| Base Year Market Size (2025) | USD 2.44 Billion |
| Market Size (2026) | USD 2.58 Billion |
| Market Size (2031) | USD 3.37 Billion |
| Growth Rate (2026 - 2031) | 5.55% CAGR |
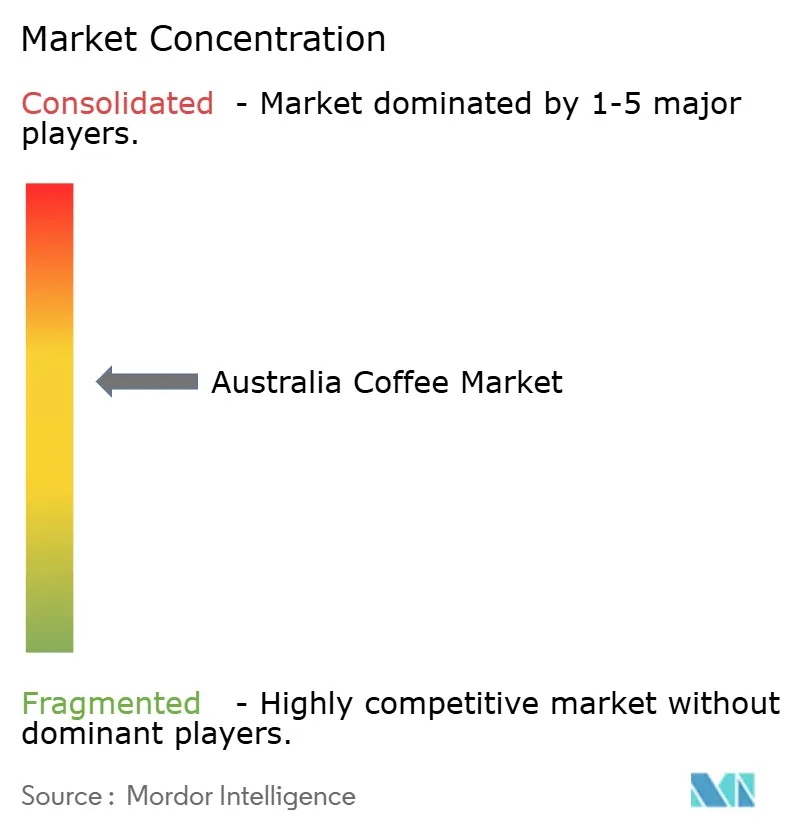
| Market Concentration | Medium |
Major Players *Disclaimer: Major Players sorted in no particular order Image © Mordor Intelligence. Reuse requires attribution under CC BY 4.0. | |
Australia Coffee Market Analysis by Mordor Intelligence
The Australian coffee market size was valued at USD 2.44 billion in 2025 and estimated to grow from USD 2.58 billion in 2026 to reach USD 3.37 billion by 2031, at a CAGR of 5.55% during the forecast period (2026-2031). Driven by rising disposable incomes and an expanding café culture, consumers are increasingly willing to pay a premium for quality. Even as household budgets tighten, premium coffee labels are outpacing their value counterparts, underscoring the nation's entrenched coffee culture, with residents consuming a staggering 16.3 million cups daily[1]Source: Kathy Chapman, “Coffee companion: how that muffin or banana bread adds to your waistline,” sydney.edu.au. Shifts towards single-origin beans, functional ingredients, and ready-to-drink (RTD) options are not only expanding the market but also pushing up average selling prices. In 2024, surges in green coffee prices prompted larger roasters to secure forward contracts and diversify their sourcing. This strategy, aimed at margin protection, is now being mirrored by smaller independent roasters. While the competitive landscape remains moderate with the top five players enjoying scale advantages, niche specialists are thriving by curating unique origin stories, emphasizing direct trade, and advocating for sustainability certifications.
Key Report Takeaways
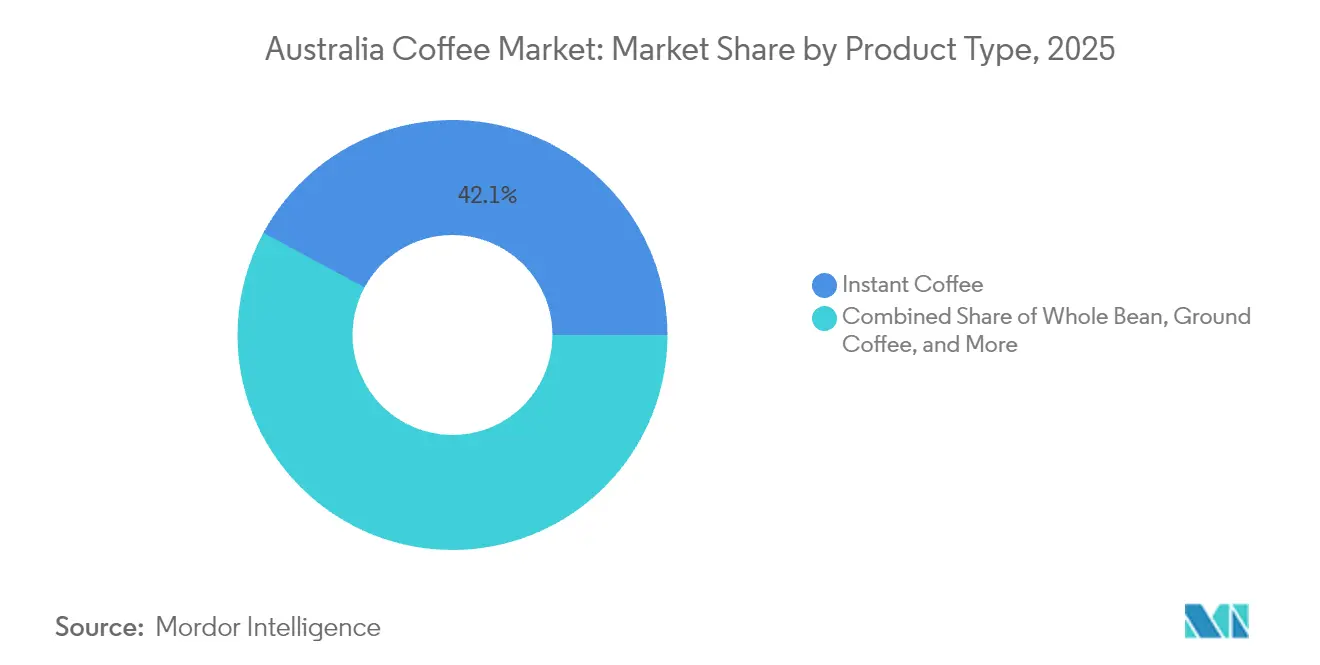
- By product type, instant coffee led with 42.11% of the Australian coffee market share in 2025, whereas RTD coffee is climbing at a 6.82% CAGR through 2031.
- By flavor, plain variants dominated with an 86.74% slice of the Australian coffee market size in 2025, while flavored options record a 7.48% CAGR over the same horizon.
- By bean type, Arabica captured 58.26% of the Australian coffee market size in 2025; Robusta is advancing at a 6.19% CAGR to 2031.
- By category type, conventional coffee held 78.05% revenue share in 2025; specialty coffee is set to rise at a 7.71% CAGR over the forecast window.
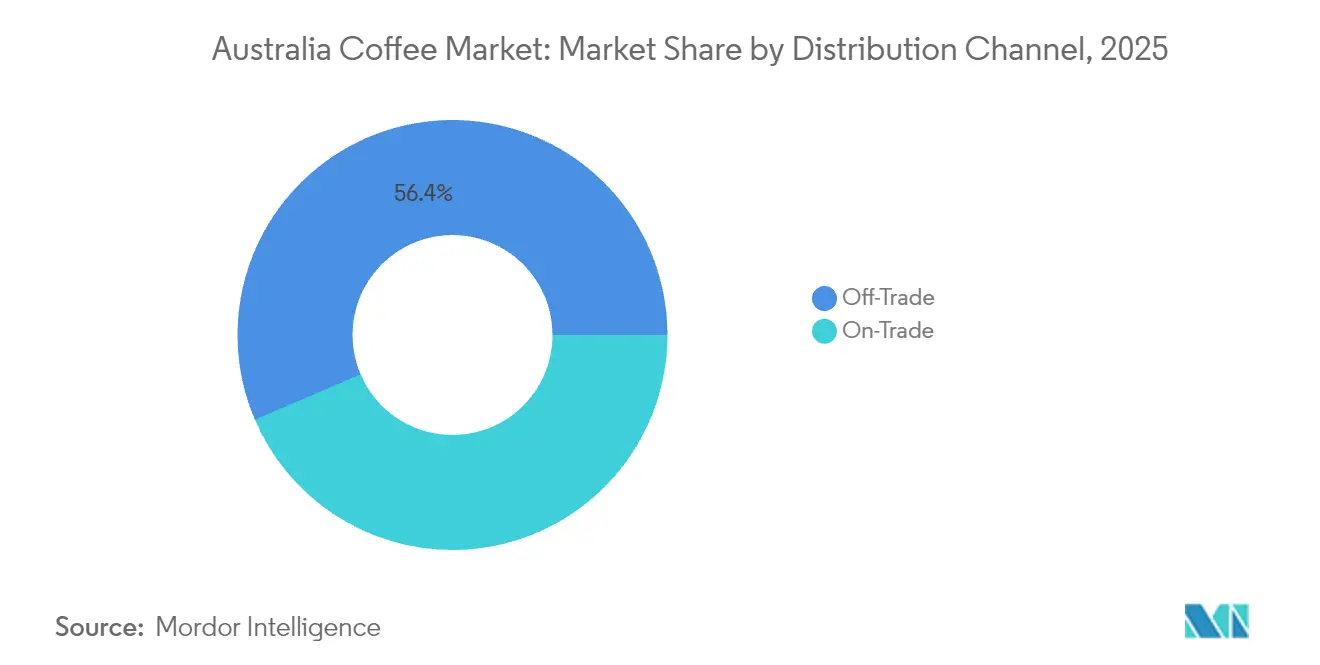
- By distribution channel, off-trade outlets secured 56.44% of sales in 2025, while on-trade venues are projected to post a 7.08% CAGR through 2031.
- By geography, New South Wales commanded 33.95% of the Australian coffee market share in 2025; Queensland is projected to grow the fastest at 6.41% CAGR to 2031.
Note: Market size and forecast figures in this report are generated using Mordor Intelligence’s proprietary estimation framework, updated with the latest available data and insights as of 2026.
Australia Coffee Market Trends and Insights
Drivers Impact Analysis*
| Driver | (~) % Impact on CAGR Forecast | Geographic Relevance | Impact Timeline |
|---|---|---|---|
| Growing demand for functional and specialty coffee range | +1.2% | National, with premium segments in NSW and Victoria | Medium term (2-4 years) |
| Premiumisation and single-origin positioning | +0.9% | Urban centers across NSW, Victoria, Queensland | Long term (≥ 4 years) |
| Growth of RTD/cold-brew formats | +1.4% | National, with higher adoption in Queensland and NSW | Short term (≤ 2 years) |
| Growth of home-barista equipment boosting whole-bean sales | +0.8% | Metropolitan areas across all states | Medium term (2-4 years) |
| Growth in the coffee house stores fueling market demand | +1.1% | National, with concentration in major cities | Medium term (2-4 years) |
| Innovation in coffee brewing methods | +0.7% | Technology hubs in NSW and Queensland | Long term (≥ 4 years) |
| Source: Mordor Intelligence | |||


Growing Demand for Functional and Specialty Coffee Range
In Australia, consumers are increasingly drawn to coffee products that offer benefits beyond just caffeine stimulation, resulting in a surge in premium coffee offerings. The specialty coffee segment, encompassing organic and single-origin varieties, indicates a maturing palate among Australian coffee drinkers. This shift mirrors a larger wellness trend, positioning coffee as a conduit for antioxidants, adaptogens, and other health-enhancing compounds. Additionally, the USDA's Strengthening Organic Enforcement rule, which took effect in March 2023, imposes stricter certification standards on organic coffee imports. While this could tighten supply, it simultaneously raises quality benchmarks. Furthermore, market players are increasingly partnering with producers, experimenting with fermentation techniques and fruit infusions, to craft unique flavor profiles that command premium prices.
Premiumization and Single-Origin Positioning
In Australia, coffee enthusiasts are increasingly willing to pay a premium for traceable, single-origin products, especially those with compelling origin stories. Specialty coffee roasters, capitalizing on direct trade relationships and transparent supply chains, command price premiums of 25-40% over commodity coffee. Consumers are now viewing coffee purchases as experiential investments rather than mere transactions. This trend of premiumization is further fueled by the expansion of café culture, where coffee tastings and educational experiences are becoming significant revenue drivers, surpassing traditional beverage sales. The regulatory landscape reinforces this trend by introducing stricter organic certification requirements. These not only safeguard the premium positioning of compliant producers but also raise barriers for newcomers. Regionally, consumers in Melbourne and Sydney are at the forefront of embracing single-origin products, while Brisbane is swiftly catching up in the premium segment.
Growth of RTD/Cold-Brew Formats
Driven by convenience demands and technological innovations that enhance product quality and shelf stability, ready-to-drink coffee formats are the fastest-growing segment of the coffee market. in 2024, the University of Queensland's breakthrough ultrasonic cold brew technology slashes production time from 24 hours to under 3 minutes, all while preserving flavor integrity. This innovation, as highlighted by the University of Queensland, could revolutionize the economics of RTD manufacturing, paving the way for broader market penetration[2]Source: University of Queensland, “Australia Leads the Charge with an Ultrasonic Cold Brew Coffee in Mere Minutes,” uq.edu.au. By addressing the constraints of traditional cold brew production, this advancement aligns perfectly with the growing consumer demand for premium, convenient products. The surge in RTD popularity is largely fueled by shifting consumption patterns, especially among younger demographics. These consumers increasingly value portability and consistent quality, often sidelining traditional brewing rituals. The segment's growth mirrors a broader industry trend, leaning towards functional, on-the-go products that not only deliver caffeine but also an experiential edge. Furthermore, RTD products enjoy a distribution advantage, leveraging established beverage channels to achieve a market reach that outpaces traditional coffee formats. This advantage not only facilitates rapid scaling but also amplifies brand-building prospects.
Growth of Home-Barista Equipment Boosting Whole-Bean Sales
As consumers increasingly seek café-quality experiences at home, the demand for whole-bean coffee surges, fueled by the rise of sophisticated home brewing equipment. This trend, which gained traction during pandemic lockdowns, continues to thrive, bolstered by the widespread availability of equipment and a surge in educational content on digital platforms. The rise of home-barista culture is reinforcing itself: as consumers invest in better brewing equipment, they increasingly opt for higher-quality beans, justifying the investment with fewer café visits and improved brewing skills. Advances in technology have made formerly professional-grade machines more affordable and easier to use at home. Retail data reflects this shift, showing a clear link between espresso machine purchases and specialty bean sales, meaning that owning such equipment often drives demand for premium coffee. This trend particularly benefits the whole-bean segment, which delivers higher margins and offers consumers superior freshness and control over their coffee.
Restraints Impact Analysis*
| Restraint | (~) % Impact on CAGR Forecast | Geographic Relevance | Impact Timeline |
|---|---|---|---|
| Substitute beverages and functional drinks | -0.6% | National, with higher impact in younger demographics | Medium term (2-4 years) |
| Volatile green-coffee prices and FX swings | -1.3% | National, affecting all market segments | Short term (≤ 2 years) |
| Supply-chain/logistics bottlenecks | -0.8% | Import-dependent regions, particularly major cities | Short term (≤ 2 years) |
| Health concerns over caffeine and sugar | -0.4% | National, with regulatory focus from FSANZ | Long term (≥ 4 years) |
| Source: Mordor Intelligence | |||
Volatile Green-Coffee Prices and FX Swings
In 2024, green coffee prices in Australia hit a 50-year peak, with raw coffee prices surging by AUD 6 per kilogram and an overall inflation rate of 77%, as reported by mycuppa[3]Source: mycuppa, “mycuppa January 2025 News,” mycuppa.com.au. This round of market turmoil is largely the result of rough weather conditions in major coffee-growing regions. Brazil’s Arabica harvest fell short of expectations, and Vietnam’s Robusta crop was hit hard by drought, leaving global supplies tighter than usual, as Pablo & Rusty’s points out. Adding to the pressure, the Australian dollar has slipped against the US dollar, pushing up import costs and squeezing margins across the industry. Importers now find themselves in a tricky position: they’re reluctant to stock up at inflated prices but still need enough coffee to keep supply steady. With costs climbing, companies are forced into difficult choices: raise prices for consumers or absorb the margin squeeze themselves. Both paths carry risks, especially if higher prices prompt budget-conscious shoppers to cut back or switch to more affordable alternatives.
Supply-Chain/Logistics Bottlenecks
Australia's geographic isolation, coupled with its reliance on imported green coffee, exposes the nation to vulnerabilities in its supply chain. These vulnerabilities not only hinder market growth but also complicate operations. In 2024, logistical challenges were exacerbated by geopolitical tensions, resulting in disruptions to shipping routes, surges in fuel prices, and congestion at ports. These issues, highlighted by Padre Coffee, have driven up transportation costs and extended delivery timelines[4]Source: Padre Coffee, “Coffee Prices 2024: A Year in Review,” padrecoffee.com.au. Smaller roasters and specialty coffee importers, lacking the scale and inventory buffers of their multinational counterparts, feel the brunt of these bottlenecks. Moreover, extended shipping durations and less-than-ideal storage conditions pose risks to the quality of green coffee, potentially compromising it before it is processed. As a result, market players are compelled to hold larger inventory levels, straining their working capital and inflating storage costs, all while exerting pressure on cash flow. In response to these challenges, regional supply chain initiatives are shifting their focus towards diversifying their source countries. There's a notable shift in focus towards Asia-Pacific origins, especially Papua New Guinea and Indonesia. However, challenges related to quality and scale present hurdles for immediate substitutions.
*Our forecasts treat driver/restraint impacts as directional, not additive. The impact forecasts reflect baseline growth, mix effects, and variable interactions.
Segment Analysis
By Product Type: Instant Dominance Faces RTD Disruption
In 2025, instant coffee holds a dominant 42.11% market share, underscoring the practical coffee habits of Australian consumers. Meanwhile, the Ready-to-Drink (RTD) coffee segment is surging at a brisk 6.82% CAGR, poised to outpace its counterparts through 2031. This divergence in growth rates signals a shift in consumption trends, with younger urban professionals increasingly favoring the convenience of RTD options over traditional brewing methods. Ground coffee enjoys robust sales through retail channels, while a rise in home brewing equipment and strategic alliances with machine manufacturers bolsters the popularity of coffee pods and capsules. Whole-bean coffee, although commanding a smaller volume, caters to premium markets and specialty retailers, yielding higher profit margins.
Not only does this technology overcome traditional hurdles in RTD manufacturing, but it also ensures the preservation of flavor integrity. This positions the product for wider market acceptance and a premium status. As the market evolves, there's a pronounced shift towards product innovation, emphasizing functional benefits and unique flavor profiles. Manufacturers are now incorporating adaptogenic ingredients and rare flavors, not just to capture consumer interest, but also to validate their premium pricing strategies.


By Flavor: Plain Coffee Dominance Challenged by Innovation
In 2025, plain coffee captures a commanding 86.74% of the market share, underscoring the Australian palate's loyalty to traditional coffee flavors. Meanwhile, flavored variants are on an upward trajectory, boasting a 7.48% CAGR growth rate projected through 2031. This surge hints at a burgeoning appetite for product differentiation. Such growth signals a maturing palate, eager to explore innovative flavor fusions. This is especially evident in the ready-to-drink (RTD) and specialty coffee arenas, where flavor innovation stands as the key differentiator. While traditional plain coffee enjoys a robust consumer base, appealing across diverse demographics, its sustained dominance is anchored in consistent quality and familiar taste profiles.
The flavored coffee boom is particularly pronounced in premium segments. Here, consumers exhibit a greater willingness to pay a premium for distinctive experiences and added functional benefits. The focus of innovation has shifted towards natural flavor integration. This is achieved through careful selection of coffee origins, specific processing techniques, and the use of complementary ingredients, steering clear of artificial flavoring. This approach resonates with the growing trend of health-conscious consumers. Additionally, seasonal flavors and limited-edition releases not only stir excitement among loyal customers but also entice newcomers in search of fresh experiences. The segment harnesses the power of social media marketing, where its visually striking and unique flavors often gain organic traction, thanks to consumer shares and collaborations with influencers.
By Category Type: Specialty Coffee Premiumization Accelerates
In 2025, conventional coffee commands a dominant 78.05% market share. However, specialty coffees, encompassing organic and single-origin varieties, are on a robust trajectory, boasting a 7.71% CAGR growth rate projected through 2031. This surge underscores consumers' readiness to invest more for quality, traceability, and ethical sourcing. Such a trend resonates with a larger movement towards conscious consumption and experiential buying, positioning coffee not just as a beverage but as a medium for expressing values and indulging in sensory experiences. Specialty coffee's edge lies in its direct trade relationships, compelling storytelling, and robust margin structures, all of which bolster sustainable business practices.
In 2024, the USDA rolls out its Strengthening Organic Enforcement rule, presenting a dual-edged sword for specialty coffee importers. While it mandates stricter certification and traceability, potentially tightening supply and elevating quality benchmarks, it also opens avenues for growth, as highlighted by Roast Magazine. On the other hand, conventional coffee leverages its scale, ensuring consistent availability and winning over a broad consumer base, especially in price-sensitive markets and institutional settings. As consumers become more educated and café culture flourishes, the market hints at a continued premiumization, celebrating the nuances of quality and origin.

By Bean Type: Arabica Leadership Faces Robusta Resilience
In 2025, Arabica coffee commands a 58.26% market share, underscoring Australian consumers' preference for its superior flavor and aromatic complexity. Meanwhile, Robusta coffee is projected to grow at a 6.19% CAGR through 2031, driven by cost considerations and blend optimization strategies. This trend highlights the ongoing market tension between quality and economic pressures, especially as green coffee prices hit historic highs in 2024. While Arabica enjoys a premium position due to established consumer preferences and quality associations, it grapples with supply challenges stemming from climate-related issues in major growing regions like Brazil and Colombia.
Robusta's growth is fueled by enhanced cultivation and processing techniques that boost flavor without sacrificing cost or supply reliability. Even with drought challenges, Vietnamese Robusta showcases a climate resilience that Arabica lacks, making it a strategic choice for importers aiming for supply diversification. Furthermore, the trend of increasing Robusta percentages in blends is a testament to its cost-effectiveness, especially in instant coffee and commercial segments where price sensitivity often overshadows flavor premiums.
By Distribution Channel: Off-Trade Dominance Meets On-Trade Innovation
In 2025, off-trade channels capture a 56.44% market share, leveraging convenience, competitive pricing, and a broad product range across supermarkets, specialty stores, and online platforms. Meanwhile, on-trade channels, fueled by the rise of café culture and a focus on experiential value, are witnessing a robust growth rate of 7.08% CAGR, projected through 2031. This disparity in growth rates highlights a shift in consumer behavior, with coffee being increasingly enjoyed as a social experience rather than just a caffeine fix. Supermarkets and hypermarkets continue to lead, capitalizing on their scale, promotional prowess, and the allure of one-stop shopping, especially for regular coffee buyers.
Australia’s booming café culture is giving on-trade channels a major lift, with BeanScene noting that the number of coffee shops has jumped by around 30% in recent years. This wave of new cafés is creating fresh consumption occasions while boosting brand visibility. Specialty stores are also thriving, appealing to premium buyers with curated selections and knowledgeable staff who turn shopping into an educational experience, often justifying higher price points and strengthening loyalty. At the same time, online retail is carving out a solid share of the market. Subscriptions and direct-to-consumer models are particularly popular among enthusiasts looking for specific origins or brands that aren’t always stocked in traditional retail outlets, making e-commerce a key channel for specialty and premium offerings.
Geography Analysis
In 2025, New South Wales commands a 33.95% share of the Australian coffee market, capitalizing on Sydney's stature as the nation's largest metropolis and commercial hub. Meanwhile, Queensland is the fastest-growing region, boasting a 6.41% CAGR through 2031, fueled by its rising population and an evolving café culture. NSW's market leadership is bolstered by its dense urban populace, elevated disposable incomes, and a rich coffee tradition that caters to both premium and volume segments across varied consumption moments. The state's port infrastructure streamlines coffee imports, and its distribution networks adeptly serve both local and national markets. Sydney's diverse populace fuels a demand for varied coffee styles and premium offerings, with inner-city locales particularly thriving in specialty coffee and café density.
Queensland's robust growth is attributed to its surging population, a growing tourism sector, and an evolving café culture, all of which unveil fresh consumption avenues in urban and regional markets. Notably, Brisbane's coffee scene is shifting towards a preference for flat whites over traditional cappuccinos, signaling a refined palate and a trend towards premiumization, as highlighted by the Brisbane Times. The Gold Coast showcases regional growth, with Zarraffa's Coffee not only inaugurating new outlets but also eyeing further expansion statewide. Queensland's demographic advantage is evident, especially among its younger populace, who are more inclined towards ready-to-drink (RTD) coffee and are open to exploring novel formats and flavors.
Melbourne anchors Victoria's market presence, hailed as Australia's coffee capital. Melbourne's emphasis on premium offerings and specialty coffee innovations not only shapes local trends but also resonates nationally. The depth of Melbourne's coffee culture casts a beneficial shadow over the broader Victorian market, with suburban and regional areas mirroring metropolitan consumption habits and quality standards. The state's coffee landscape champions artisanal methods and direct trade, bolstering both specialty coffee premiumization and a diverse range of origins. Meanwhile, the rest of Australia showcases a tapestry of regional markets, each with its unique growth narrative. From Western Australia's economy swayed by mining cycles to South Australia's coffee culture intertwined with its wine region, these markets exhibit resilience. Local café establishments and community-centric coffee ventures cater to both residents and tourists, fostering a stable demand that underpins consistent growth, even when distanced from major import and distribution hubs.
Regulatory Landscape
Coffee sold in Australia must comply with the Australia New Zealand Food Standards Code, administered by Food Standards Australia New Zealand (FSANZ). The framework includes requirements that affect ingredient declarations, nutrition information, and caffeine-related statements where applicable. In March 2026, the FSANZ Board approved Proposal P1056, updating compositional and labelling requirements for high-caffeine beverages, with relevance for coffee-containing drinks that exceed 200 mg of caffeine per serve. This tightens how higher-caffeine products are presented to consumers.
On the import side, the Department of Agriculture, Fisheries and Forestry (DAFF) administers biosecurity and imported food controls under the Biosecurity Act 2015. Importers use BICON to determine specific import conditions for green coffee beans and roasted coffee, while the Imported Food Inspection Scheme (IFIS) manages inspection and testing based on FSANZ risk classifications. Compliance history and documented food-safety systems, including options such as a Food Import Compliance Agreement where applicable, can influence inspection frequency and speed-to-market for imported coffee products.
Competitive Landscape
The Australian coffee market is moderately consolidated, with global giants and agile independents coexisting. Nestlé SA and JDE Peet’s leverage their international sourcing networks to manage commodity price fluctuations and drive growth in instant coffee sales. Domestic leader Vittoria Coffee, strengthened by strong café partnerships, recently defended its jar design against JDE, highlighting its brand equity. Luigi Lavazza secures premium shelf space through exclusive supermarket deals and barista training, while Starbucks Coffee Australia introduces localized beverage innovations in high-traffic suburban locations.
Technology is reshaping the industry. Ultrasonic cold-brew systems have cut batch times, enabling faster product launches, while boutique roasters offering carbon-neutral roasting and blockchain-verified payments appeal to environmentally conscious consumers. Equipment collaborations between grinder manufacturers and specialty cafés bundle beans and machinery, creating reliable revenue streams.
Price volatility is prompting players to reassess their hedging strategies and diversify their sourcing. Larger companies import from Brazil, Colombia, and Ethiopia, while smaller roasters benefit from nearby origins such as Papua New Guinea and Timor-Leste. Marketing narratives that highlight farmer support and sustainable practices help brands justify price adjustments and maintain consumer trust. Together, these dynamics foster competition and elevate quality for Australian coffee drinkers.
Australia Coffee Industry Leaders
Nestle SA
Vittoria Coffee Pty Ltd.
Luigi Lavazza S.p.A.
JDE Peet’s
Starbucks Corporation
- *Disclaimer: Major Players sorted in no particular order

Market Opportunities and Future Outlook
RTD, cold coffee, and at-home premium formats are expanding the addressable space beyond traditional hot café consumption, which supports room for concentrate-style products, single-serve innovation, and flavored extensions that translate café-style beverages into retail. Company actions reflect this shift, including Nespresso highlighting iced and novelty coffee as growth levers alongside a new flagship presence in Sydney (Pitt Street Mall) in 2026, and Nestle extending convenient, flavor-led formats through Nescafe launches such as KitKat-inspired mixes and espresso concentrate range extensions.
At the same time, supply-chain volatility and compliance pressures are encouraging investment in more resilient, higher-control operating models. This opens practical opportunities in automation, traceability, and modular roasting capacity. Capability upgrades are also supported by the Australian Government Modern Manufacturing Initiative (MMI) for food and beverage technology adoption and the AgriFutures Australia Australian Coffee Industry RD&E Plan 2025-2030, which frames Australian-grown coffee as an emerging priority sector. In parallel, shared-use regional processing infrastructure for locally produced coffee and circular-economy initiatives, supported by industry bodies such as the Australian Coffee Traders Association, create whitespace for service providers and brand owners to differentiate via provenance, sustainability credentials, and more stable sourcing options.
Recent Industry Developments
- May 2026: Nestle Australia rolled out the Nescafe Make Your World masterbrand campaign across screens, social, and influencer channels. The push reinforces brand salience in a market where at-home consumption is gaining share and supports faster trial of extensions such as mixes and concentrates alongside core instant lines.
- April 2026: Keurig Dr Pepper completed its USD 24.9 billion acquisition of JDE Peet's, closing on April 1, 2026. The combination places JDE Peet's coffee portfolio under a broader global beverage platform, strengthening scale in sourcing and brand investment that can influence competitive intensity in Australia across instant, pods, and on-trade aligned brands.
- March 2026: The FSANZ Board approved Proposal P1056 updating compositional and labelling requirements for high-caffeine beverages, with relevance for coffee-containing drinks that exceed 200 mg of caffeine per serve. This signals tighter consumer transparency and may affect product labeling and compliance for coffee beverages in Australia.


Research Methodology Framework and Report Scope
Market Definition and Coverage
For this study, the market is defined as the total value of coffee products sold for consumption in Australia across retail and foodservice, counted at the point of sale and reported in USD for the stated base year.
Scope exclusions: We do not treat tea, cocoa, coffee machines, grinders, or cafe food items as part of the coffee market value.
Segmentation Overview
- By Product Type
- Whole Bean
- Ground Coffee
- Instant Coffee
- Coffee Pods and Capsules
- Ready-to-Drink (RTD) Coffee
- By Flavor
- Plain
- Flavored
- By Category Type
- Conventional Coffee
- Specialty Coffee (Organic/Single-Origin)
- By Bean Type
- Arabica
- Robusta
- Others
- By Distribution Channel
- On-Trade
- Off-Trade
- Supermarkets / Hypermarkets
- Specialty Stores
- Convenience Stores
- Online Retail Stores
- Other Off-Trade Distribution Channels
- By States
- New South Wales
- Victoria
- Queensland
- Rest of Australia
Data Sources, Market Sizing, and Validation
Desk Research
Desk work starts by mapping demand and supply signals that can be checked without paywalls, and then translating them into market inputs we can explain. We refer to sources such as the Australian Bureau of Statistics for household spend and CPI trend direction, the Australian Department of Agriculture, Fisheries and Forestry for food category context, and customs trade statistics for green and roasted coffee movement into the country.
To keep assumptions realistic, we also review sources such as industry association releases, peer-reviewed food science and nutrition journals for consumption patterns, and company annual reports and investor presentations for pricing and channel commentary. In parallel, we use paid subscriptions for company financials and intelligence, plus shipment-level import and export databases to sanity-check volumes and origin mix when public data is not granular enough. These sources are illustrative only, and many other public and paid references were used for data collection, validation, and research clarification.
Primary Interviews and Surveys
Primary work focuses on verifying what desk sources cannot fully explain, especially channel splits, price realization, and mix shift between formats like pods, instant, and ready-to-drink. We speak with a mix of roasters, importers, distributors, retail category teams, and foodservice operators across Australia, and the feedback is used to adjust conversion factors, check growth drivers, and confirm that the final numbers reflect real purchasing behavior.
Distribution of primary research fieldwork respondents
| Company type | Respondent position | Region |
|---|---|---|
| Top tier: 39% | CXOs: 12% | |
| Mid tier: 46% | Functional/Unit leaders: 32% | |
| Smaller Players: 15% | Managers: 56% |
Market-Sizing & Forecasting
Sizing is built using a top-down approach where national consumption and trade signals are reconstructed into an addressable coffee value pool, and then allocated across formats and channels using validated shares. To keep the totals practical, we corroborate them with selective bottom-up checks such as sampled brand and private label price points, format-level volume proxies, and distributor and retailer channel checks, which are then used to tune the final outputs.
Key inputs used in the model include coffee import volumes and origin mix, observed retail price ranges by format (whole bean, ground, instant, pods and capsules, and RTD), on-trade versus off-trade split, inflation and coffee price pass-through timing, and mix shift toward premium and convenient formats. When company disclosures are incomplete, gaps are handled by using peer benchmarks and interview-based ranges, followed by sensitivity tests so the final number does not hinge on a single assumption.
Forecasting is done using scenario analysis supported by short-cycle indicators like inflation, out-of-home traffic signals, and expected green coffee price direction, and then reviewed against expert expectations for premiumization and format adoption. The final forecast is published only after the growth path and the implied per-capita consumption trajectory look consistent with what interviewees see in stores and cafes.
Data Validation & Update Cycle
Outputs are validated through triangulation across independent signals, including trade flow direction, retail pricing movement, and channel mix checks from interviews. If the model produces sharp jumps, the drivers are re-tested, and we re-contact respondents when the variance cannot be explained by a known event like a price spike or a format shift.
Before sign-off, the work is reviewed in multiple steps, starting with assumption checks, followed by year-by-year reasonability tests, and then a final internal review of tables and narrative. The report is refreshed annually, and interim updates are made when material changes occur, after which a fresh pre-delivery pass is completed so clients receive the latest updated view.
Mordor Intelligence's Australia Coffee Market Size Compared Against Other Published Estimates
It is normal to see different market sizes for Australia coffee because sources do not always count the same products, channels, or pricing basis, and they may also anchor to different base years. Differences also appear when some publishers lean more on reported revenue pools, and others lean more on consumption and trade based reconstruction.
Some estimates lean toward a narrower definition that mostly reflects packaged coffee sold through retail shelves, and they may not fully capture foodservice turnover or RTD sold through multiple channels. In the Mordor Intelligence methodology, the total is built to include on-trade and off-trade value across whole bean, ground, instant, pods and capsules, and RTD coffee, with channel shares and price realization checked through interviews and trade signals so the final number stays tied to what is actually purchased in Australia.
Benchmark comparison
| Source | Market Size | Gaps in Research Methodology |
|---|---|---|
| Mordor Intelligence | USD 2.44 B (2025) | |
| Industry Research Publisher A | USD 1.41 B (2025) | Likely undercounts the market by emphasizing retail packaged coffee value and omitting parts of foodservice and multi-channel RTD sales, which reduces the addressable value pool even when the base year matches. |
| Syndicated Listing Platform B | USD 1.64 B (2025) | Often aligns to a packaged coffee definition by product type and modern retail channels, and it can apply simplified average pricing and currency timing, which can compress the total versus a channel-inclusive value build. |
The spread in the table is mainly explained by whether foodservice and broader channel RTD sales are counted, and by how pricing and mix are updated for the base year. By keeping scope rules explicit and then stress-testing shares and price realization with repeatable checks, the study produces a practical total that can be re-run and audited as market conditions change.


Key Questions Answered in the Report
How large is the Australia coffee market in 2026?
The Australia coffee market size is USD 2.58 billion in 2026.
What is the expected CAGR for coffee sales in Australia through 2031?
Australian coffee revenue is forecast to rise at a 5.55% CAGR from 2026 to 2031.
Which coffee segment is growing fastest?
Ready-to-drink and cold-brew products lead with a projected 6.82% CAGR.
Which Australian state shows the highest growth potential for coffee?
Queensland is the fastest-growing region, projected at a 6.41% CAGR through 2031.
Page last updated on:




