Atlanta Data Center Market Size and Share
Market Overview
| Study Period | 2020 - 2031 |
|---|---|
| Forecast Data Period | 2026 - 2031 |
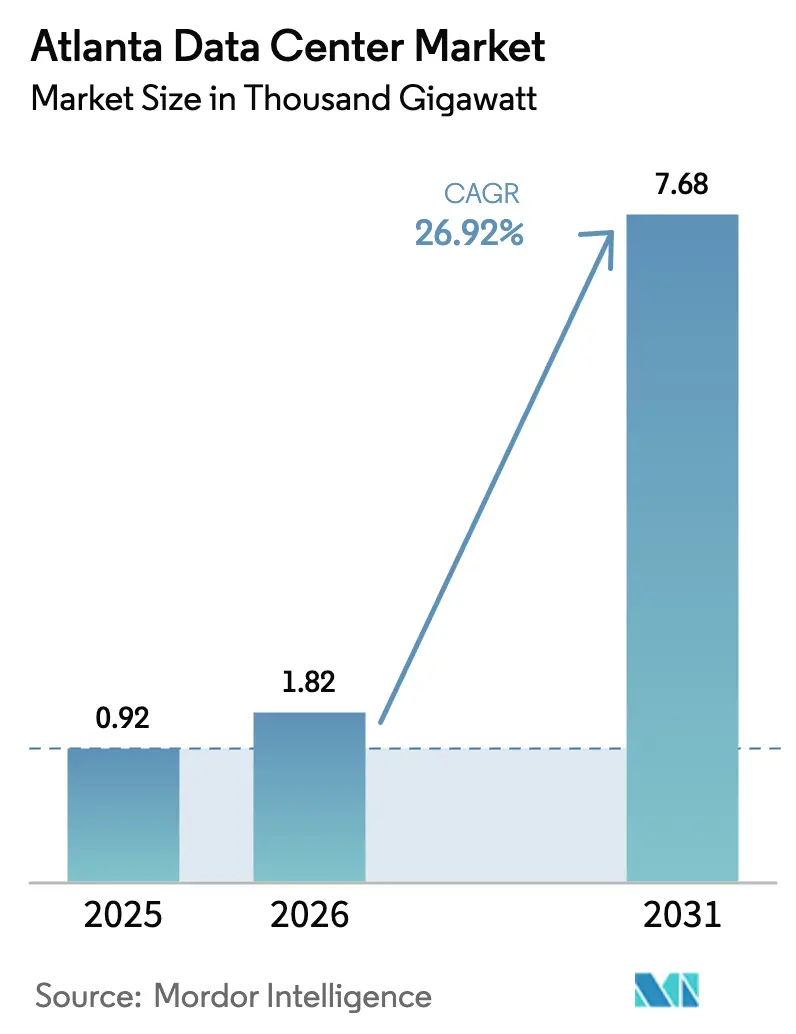
| Base Year Market Size (2025) | 0.92 Thousand gigawatt |
| Market Volume (2026) | 1.82 Thousand gigawatt |
| Market Volume (2031) | 7.68 Thousand gigawatt |
| Growth Rate (2026 - 2031) | 26.92% CAGR |
| Market Concentration | Medium |
Major Players *Disclaimer: Major Players sorted in no particular order Image © Mordor Intelligence. Reuse requires attribution under CC BY 4.0. | |
Atlanta Data Center Market Analysis by Mordor Intelligence
The Atlanta data center market size in 2026 is estimated at 1.82 GW of installed IT power, up from 0.92 GW in 2025, with 2031 projections showing 7.68 GW of installed IT power, growing at a 26.95% CAGR over 2026-2031. This growth pace elevates the region from an emerging hub to a core node in North America’s digital infrastructure map. Demand is led by hyperscale operators chasing lower power costs, abundant fiber routes, and consistent tax abatements. Annual net absorption hit 705.8 MW in 2024—outpacing Northern Virginia for the first time—and 2,159.3 MW of additional capacity is under construction. Power constraints in legacy hubs, advances in AI workloads and a maturing regional dark-fiber grid continue to reroute large deployments toward metro Atlanta. Developers are building on speculation despite pre-lease rates approaching 89% for projects already under way.
Key Report Takeaways
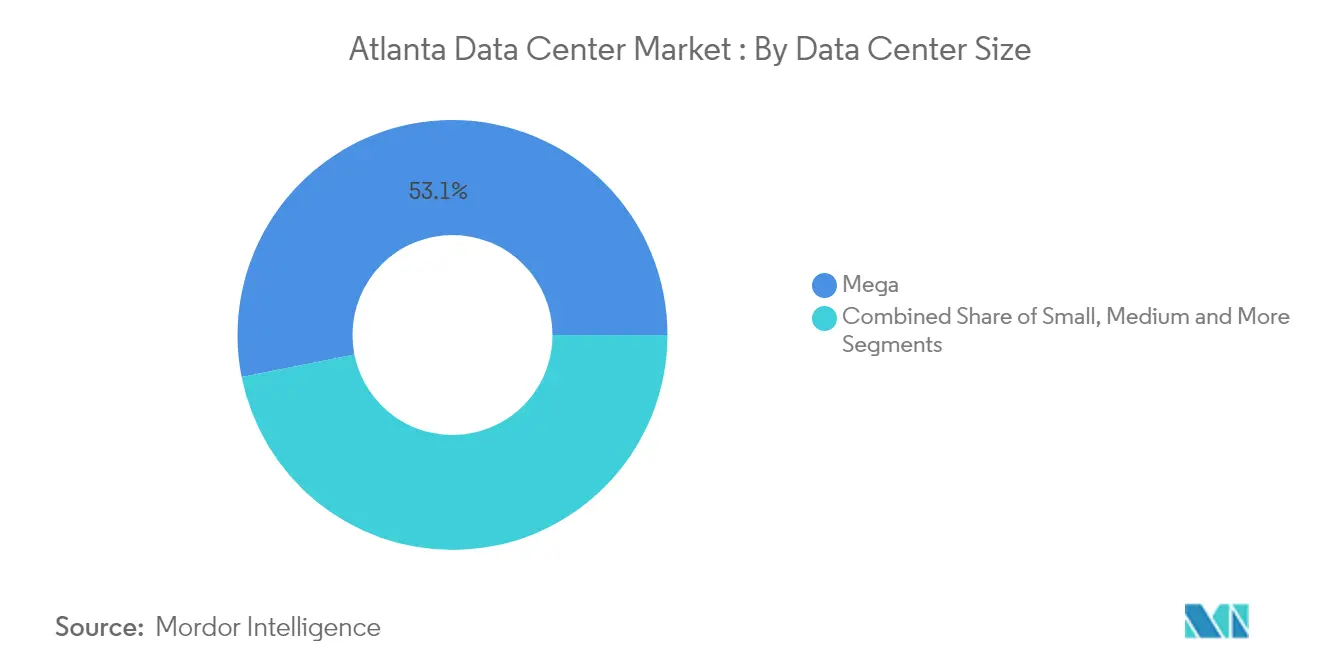
- By data-center size, Mega facilities led with 53.12% of Atlanta data center market share in 2025, while the Massive tier is projected to expand at a 28.73% CAGR through 2031.
- By tier, Tier 3 sites captured 65.72% share in 2025; Tier 4 is forecast to grow fastest at 28.54% CAGR.
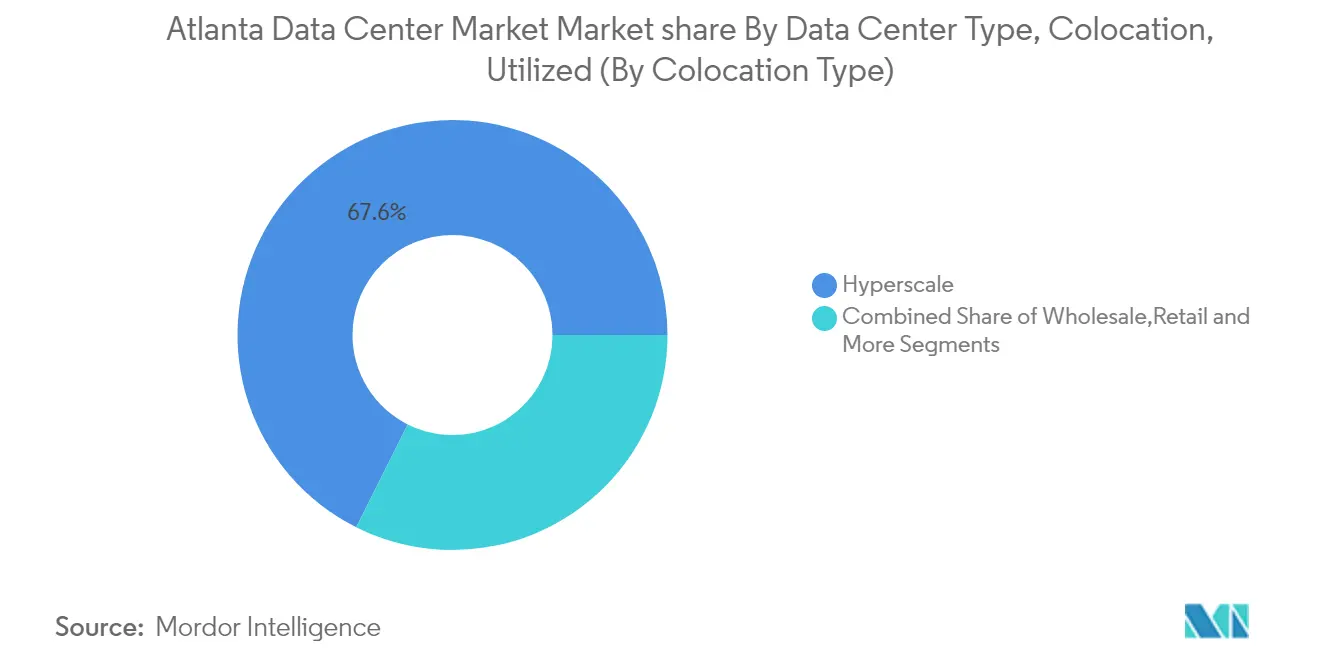
- By colocation model, hyperscale accounted for 67.61% of the Atlanta data center market size in 2025 and is advancing at a 31.85% CAGR.
- By end-user group, cloud providers held 28.47% share of the Atlanta data center market size in 2025 and are set to expand at a 34.62% CAGR to 2031.
Note: Market size and forecast figures in this report are generated using Mordor Intelligence’s proprietary estimation framework, updated with the latest available data and insights as of 2026.
Atlanta Data Center Market Trends and Insights
Drivers Impact Analysis*
| Driver | (~)% Impact on CAGR Forecast | Geographic Relevance | Impact Timeline |
|---|---|---|---|
| AI / cloud-led hyperscale builds | 6.9% | Metro Atlanta, with concentration in Douglas and Fulton Counties | Medium term (2-4 years) |
| Edge-computing and latency-sensitive workloads | 5.5% | Urban Atlanta core and suburban nodes | Medium term (2-4 years) |
| Georgia tax and renewable-energy incentives | 5.0% | Statewide, with concentration in metro counties | Short term (≤ 2 years) |
| Surging AI power constraints in NoVA divert demand | 4.2% | Metro Atlanta, particularly southern suburbs | Short term (≤ 2 years) |
| Surplus dark-fiber along I-285 and I-20 corridors | 3.3% | Metro Atlanta ring and east-west corridor | Medium term (2-4 years) |
| Sub-sea cable upgrade via Myrtle Beach landing | 2.8% | Atlanta to coastal South Carolina corridor | Medium term (2-4 years) |
| Source: Mordor Intelligence | |||
AI / Cloud-Led Hyperscale Builds: Reshaping Power Requirements
Atlanta’s newest hyperscale campuses are being engineered for rack densities exceeding 40 kW to satisfy AI training clusters. Microsoft alone is investing USD 1.8 billion in three local facilities totaling 324 MW.[1]David Chernicoff, “Details Emerge on Microsoft’s $1.8 Billion Investment in Atlanta Data Centers,” Data Center Frontier, datacenterfrontier.com Electric Power Research Institute notes AI already accounts for 10–20% of data-center electricity draw nationwide, a share that could push sector demand to 9.1% of U.S. generation by 2030. Premium pricing follows the newest builds owing to their liquid cooling, extra switchgear and on-site substations, while legacy halls face retrofit pressures. The clustering of these sites in the southern metro is forming purpose-built utility zones where redundant transmission, looped fiber and 100-acre parcels converge.
Edge-Computing and Latency-Sensitive Workloads: Driving Urban Deployments
Mobile gaming, tele-health and financial-trading platforms are spurring a lattice of micro-facilities across downtown Atlanta. American Tower has added edge nodes near Peachtree Center to keep hop counts under five milliseconds. Vapor IO and Comcast are piloting last-mile edge services to dovetail with existing cable plant. EdgeConneX operates two sites totaling 16 MW within a three-mile radius of city hall. These deployments trim network latency for AI inference, interactive media and autonomous-vehicle telemetry, positioning metro Atlanta as both a core and edge nexus.
Georgia Tax and Renewable-Energy Incentives: Fiscal Catalysts
A 100% sales-tax exemption on server equipment above USD 15 million continues to tilt site-selection models in the state’s favor. Legislative efforts to pause the incentive were vetoed in May 2024. Operators are leveraging the credit to offset the cost of renewable-energy PPAs, satisfying ESG mandates while capping utility rates near USD 0.05/kWh. Public-private partnerships tied to solar and battery storage are accelerating as players seek hedge mechanisms against peak tariffs.
Surging AI Power Constraints in NoVA Divert Demand: Geographic Redistribution
Transmission backlogs in Loudoun County have pushed wait times for new megawatt blocks beyond four years. As a result, Atlanta topped 705.8 MW of net absorption in 2024, dwarfing Northern Virginia’s 451.7 MW tally. Developers now prioritize markets with surplus generation over proximity to established internet exchanges, turning Atlanta’s 500 kV network and modular substation programme into clear differentiators.
Restraints Impact Analysis*
| Restraint | (~) % Impact on CAGR Forecast | Geographic Relevance | Impact Timeline |
|---|---|---|---|
| Utility power-delivery lead-times | -4.2% | Metro Atlanta, particularly southern growth corridors | Medium term (2-4 years) |
| Escalating land and construction costs | -3.3% | Prime locations near fiber and power infrastructure | Short term (≤ 2 years) |
| Prospective water-usage restrictions for cooling | -2.2% | Metro Atlanta water districts | Medium term (2-4 years) |
| Skilled labor gap for high-density builds | -1.4% | Metro Atlanta construction and operations workforce | Short term (≤ 2 years) |
| Source: Mordor Intelligence | |||
Utility Power-Delivery Lead-Times: Critical Infrastructure Bottleneck
Georgia Power expects industrial electricity demand to multiply 17-fold by 2035, with data centers absorbing 80% of that growth. Average lead times for high-voltage extensions approach four years, forcing phased build-outs and on-site gas turbine deployments. Metro mayors warn that 8.2 GW of extra capacity is required by 2030 to keep pace with bookings.[2]Staff Writer, “Meeting Focuses on Georgia’s Data Center Growth,” GACities, gacities.com New state rules now compel large projects to co-fund sub-station upgrades to shield residential customers from rate hikes.
Escalating Land and Construction Costs: Economic Pressure Points
Digital Realty’s USD 120 million outlay for 97 acres in Forest Park equates to more than USD 1.2 million per developable acre.[3]Staff Reporter, “Digital Realty Buys Land for Data Center Development Projects,” CoStar, costar.com Steel prices, high-capacity transformers and liquid-cooling components are inflating overall project budgets by double digits. The Wall Street Journal notes that zoning boards now scrutinize energy-intensive proposals as data-center footprints cannibalize industrial land. These pressures are catalyzing modular construction techniques, multistory layouts and creative land-banking strategies to preserve yields.
*Our forecasts treat driver/restraint impacts as directional, not additive. The impact forecasts reflect baseline growth, mix effects, and variable interactions.
Segment Analysis
By Data Center Size: Mega Facilities Redefine Scale
Mega sites held 53.12% of Atlanta data center market share in 2025, translating into 467.5 MW of active IT capacity in 2025. This dominance pushes the Atlanta data center market size for mega builds toward 1.57 GW by mid-decade as announced expansions come online. Economies of scale allow operators to undercut power costs and deploy SCADA-enabled distribution at room scale rather than row scale. Amazon Web Services’ USD 11 billion Georgia program involves multiple 100 MW+ blocks and sets a blueprint for campus-style resiliency. The Massive tier (20–100 MW) is forecast to climb 28.73% annually as second-tier clouds and SaaS vendors secure future-proven footprints. Meanwhile, Medium and Large categories remain relevant for private-cloud transition workloads, edge caching and compliance-driven isolation zones. Smaller (sub-5 MW) halls have pivoted toward telco edge clusters and research labs that prize proximity over watt scale.
Economically, mega campuses secure PUE values near 1.2 by integrating rooftop heat-exchanger loops and on-site chilled-water plants. Land aggregation tactics bundle parcels into 200-acre super sites, reducing municipal approvals per megawatt delivered. The strategy also supports multi-building phasing that aligns capital draws with pre-leased commitments, preserving developer IRRs. Over the next five years, the Atlanta data center market is expected to shift another 12 percentage points toward mega and massive stock as AI rack densities exceed 80 kW and require specialized power trenways.


By Tier Type: Reliability Premium Tightens
Tier 3 inventory occupied 65.72% of active floor space in 2025, underlining its status as the standard for mission-critical yet cost-sensitive deployments. The Atlanta data center market size allocated to Tier 3 halls is projected to surpass 2.42 GW by 2031 as enterprises retire on-premises server rooms. However, Tier 4 is registering a 28.54% CAGR, buoyed by machine-learning clusters, fintech clearing systems and defense workloads that cannot tolerate a single point of failure. Operators justify the capex premium by commanding service-level agreements featuring five-nines uptime and shorter mean-time-to-repair. Flexential’s Alpharetta site illustrates Tier 4 economics with liquid cooling, up-flow containment and 1,500 W per square foot densities.
Tier 1 and Tier 2 footprints cater mainly to archival storage, staging areas and disaster-recovery seats, but their share is sliding as price differentials narrow. Design trends show Tier 3 sites integrating selective Tier 4 attributes—dual utility feeds, segmented busways and battery-energy-storage systems—to future-proof assets without a full Tier 4 price tag.
By Utilized , Colocation Type: Hyperscale Economics Transform Supply
Hyperscale colocation captured 67.61% of rented power in 2025 and is expanding at a brisk 31.85% CAGR, underscoring its role as the region’s growth engine. This trajectory places hyperscale’s Atlanta data center market size above 2.49 GW by 2031. The 324 MW TA Realty–EdgeConneX venture consolidates sub-station, cooling tower and fiber entrance facilities at campus level, demonstrating wholesale cost dilution. Wholesale colocation continues to serve media encoding, remote desktop and ORM systems that require dedicated cages but not an entire building. Retail colocation, though smaller, remains critical for connectivity-rich workloads, supporting network peering points and DR instances.
Economies of scale have lowered hyperscale’s lease-adjusted cost per kilowatt by up to 30% versus retail space, but they introduce tenant-concentration risk. Landlords mitigate this exposure through staggered expiration profiles, shell spec builds and multi-cloud exchange platforms that diversify revenue streams.
By Utilized, End User: Cloud Providers Anchor Demand
Cloud and IT services accounted for a 28.47% stake in 2025—equating to more than 250.5 MW of leased capacity—and will outpace all other verticals with a 34.62% CAGR to 2031. This expansion alone could add 1.06 GW of incremental draw to the Atlanta data center market. Microsoft’s 324 MW project in Union City validates hyperscalers’ sustained growth path. Telecom operators remain influential, rolling out 5G core nodes and mobile-edge computing gateways. Financial-services usage is rising on the back of low-latency trading and real-time fraud analytics, while healthcare, government, and media continue to diversify colocation demand mixes.
The multi-vertical profile buffers the Atlanta data center market against cyclical slowdowns and dilutes single-sector exposure. Fiber expansions such as Bandwidth IG’s 330-route-mile project now cover Rockdale, Newto,n and Henry counties, underpinning east-west latency targets and reinforcing carrier-neutral site value.
Geography Analysis
Metro Atlanta overtook Northern Virginia in 2024 net absorption after securing 705.8 MW of positive take-up versus only 18 MW the prior year. Inventory ballooned 222% to 1,000.4 MW, positioning the region as North America’s second-largest cluster. Southern suburbs—namely Douglas, Henry and Fulton Counties—host the bulk of 2,159.3 MW under construction, drawn by large-parcel availability and direct access to 500 kV transmission.
Henry County alone has 500 MW in the pipeline, accelerated by targeted rezoning along State Route 20. Bandwidth IG’s fiber mesh expansion now interlinks Rockdale, Newton and Dekalb, softening single-carrier dependency and making fringe submarkets viable. DC BLOX’s Myrtle Beach–to-Atlanta dark-fiber corridor improves long-haul diversity and sets the stage for future subsea redundancy into South America and Europe.
Regional spillover extends into South Carolina and Alabama, where lower land costs and common transmission providers simplify redundant-path engineering. The American Society of Civil Engineers cites USD 7 billion earmarked for Georgia grid improvements between 2023 and 2025, enhancing sub-station redundancy and storm resilience across the broader Southeast
Competitive Landscape
The Atlanta data center market exhibits moderate concentration as incumbent operators scale and newcomers carve specialised niches. QTS controls the largest single-site footprint with 970,000 sq ft in its Atlanta-Metro campus, supported by an on-site Georgia Power sub-station datacentremagazine.com. Digital Realty, Equinix and Switch are expanding via both greenfield builds and land banking; Digital Realty has secured nine parcels since 2024, including Forest Park’s 97-acre tract. Stack Infrastructure, Flexential and Vantage focus on high-density pod designs, while DC BLOX differentiates through carrier-hotel interconnection.
Strategic alliances strengthen ecosystem stickiness. Digital Realty, Vapor IO, and Hivelocity now offer a combined core-to-edge bare-metal stack that shortens deployment timelines for latency-sensitive workloads. H5 Data Centers pairs low-latency Southern Telecom fiber with its 345 Courtland Street site to win financial-trading tenants h5datacenters.com. Competitive tension is intensifying around land and transformer supply; operators increasingly pre-order generators and switchgear 18 months ahead to lock pricing.
Sustainability credentials are emerging as a key differentiator. PowerSecure’s on-site microgrid for Edged Energy’s new facility showcases integrated diesel-replacement strategies digitalinfranetwork.com. Carbon-free hourly-matching PPAs and reclaimed-water cooling systems are becoming table stakes for cloud bidders. As competition deepens, service innovation—rather than raw footprint—will likely define winning positions through 2030.
Atlanta Data Center Industry Leaders
Digital Realty
Equinix Inc.
Vantage Data Centers
QTS Realty Trust
Switch Inc.
- *Disclaimer: Major Players sorted in no particular order

Recent Industry Developments
- May 2025: Flexential acquired the Douglasville 2 and Norcross facilities, adding 37.8 MW of owned capacity and shifting from leasehold to fee-simple assets
- April 2025: Digital Realty spent USD 156 million on Atlanta land, including a 97-acre Forest Park tract slated for a 200 MW campus
- April 2025: ‘Project Bunkhouse’ proposed a USD 19 billion, 8.7 million sq ft development across 12 buildings in Bartow County
- March 2025: A 6.2 million sq ft campus outside Atlanta entered rezoning review, signaling sustained hyperscale appetite
- January 2025: Bandwidth IG doubled its metro fiber network to 330 route miles across 10 counties
- January 2025: PowerSecure began energizing Edged Energy’s sustainable campus using on-site generation and battery support


Research Methodology Framework and Report Scope
Market Definitions and Key Coverage
Our study defines the Atlanta data center market as all purpose-built facilities within the 29-county metropolitan area that supply contiguous IT load to cloud service providers, colocation tenants, and enterprise users, measured in installed IT power (MW) and the monetized value of that load. According to Mordor Intelligence, capacity delivered through wholesale, retail, hyperscale, and modular halls is captured, while captive on-premise server rooms are not.
Scope exclusion: Micro-edge sites below 250 kW and telecom central offices converted for limited compute fall outside the study.
Segmentation Overview
- By Data Center Size
- Small
- Medium
- Large
- Hyperscale
- By Tier Type
- Tier 1 and 2
- Tier 3
- Tier 4
- By Data Center Type
- Cloud Service Providers (CSPs)
- Enterprise, Modular and Edge
- Colocation
- Non-Utilized
- Utilized
- Colocation Type
- Retail
- Wholesale
- Colocation Type
- By End User Industry
- Cloud and IT
- Telecom
- Media and Entertainment
- Government
- BFSI
- Manufacturing
- E-Commerce
- Other End User
Detailed Research Methodology and Data Validation
Primary Research
Structured interviews with facility developers, utility planners, hyperscale procurement leads, and real-estate brokers across Atlanta, Douglas, and Henry counties helped refine absorption assumptions, stress-test tariff pass-through logic, and verify future power reservations. Web surveys of enterprise IT managers supplemented views on migration pacing and average rack density.
Desk Research
Mordor analysts began with public domain statistics from the U.S. Energy Information Administration, Georgia Public Service Commission docket filings, and up-to-date Census demographics, which clarify power supply, tariffs, and addressable demand. Additional context came from Data Center Coalition briefs, IEEE power-density papers, and import logs that trace chiller and switch-gear volumes, followed by company 10-Ks and REIT presentations accessed via Dow Jones Factiva. These illustrate our desk research base; many further sources supported data collection, validation, and nuance.
Market-Sizing & Forecasting
The baseline is anchored by a top-down build that reconstructs regional demand from utility interconnection queues, substation upgrades, and historical net absorption, which are then reconciled with bottom-up spot checks of supplier roll-ups, sampled lease rates multiplied by contracted MW, and channel checks. Key variables include installed IT load, pipeline-to-inventory ratio, average power price, land cost progression, and hyperscale share of total take-up. Forecasts to 2030 employ multivariate regression overlaid with ARIMA smoothing to reflect permitting lags. Gaps in bottom-up estimates are bridged using disclosure ranges vetted during primary calls.
Data Validation & Update Cycle
Outputs pass variance screens against independent benchmarks, and anomalies trigger re-contact with respondents before analyst sign-off. Reports refresh annually, with interim updates when material events such as utility rate cases or leases above 100 MW are announced, ensuring clients receive the latest view.
Why Mordor's Atlanta Data Center Baseline Commands Reliability
Published estimates often diverge because firms apply different geographic cut-outs, treat single-year absorption as market size, or roll forward pipelines without scrubbing for power-availability risk. Our disciplined scope selection, dual-path modeling, and yearly refresh temper both over-optimistic and overly conservative counts.
Benchmark comparison
| Market Size | Anonymized source | Primary gap driver |
|---|---|---|
| 880 MW installed IT power (2024) | Mordor Intelligence | - |
| 705.8 MW net absorption (2024) | Global Consultancy A | Uses one-year leasing activity as baseline; omits existing inventory |
| 716 MW operating capacity (2024) | Regional Consultancy B | Excludes under-construction assets already contractually committed |
| 150 MW colocation absorption (H1 2025) | Trade Journal C | Focuses only on multi-tenant halls, ignores hyperscale self-builds |
These comparisons show that by aligning scope, variables, and vetting steps, Mordor Intelligence offers a balanced, transparent baseline that decision-makers can trace and replicate with confidence.


Key Questions Answered in the Report
What is the projected size of the Atlanta data center market by 2031?
The market is expected to reach 3.68 GW of installed IT power by 2031, growing at a 26.92% CAGR.
Why are hyperscale operators prioritizing Atlanta over Northern Virginia?
Transmission delays and power caps in Northern Virginia have redirected demand to Atlanta, where utility headroom, tax incentives and lower energy prices accelerate build schedules.
Which data-center size segment is growing fastest?
The Massive segment (20–100 MW) is forecast to expand at a 28.73% CAGR between 2026 and 2031.
How significant are tax incentives in Georgia’s data-center strategy?
Georgia offers a 100% sales-tax exemption on server equipment investments above USD 15 million, a policy that materially lowers capex and has been reaffirmed by recent veto action.
What are the chief bottlenecks facing Atlanta data-center developers?
The most pressing issues are four-year utility lead times for new substations and escalating land prices that exceed USD 1 million per acre in power-rich corridors.
How is sustainability influencing competitive positioning?
Operators are integrating on-site microgrids, hour-by-hour renewable PPAs and recycled-water cooling to satisfy ESG requirements and differentiate bids, especially for AI workloads requiring high rack densities.
Page last updated on:


