
Market Overview
| Study Period | 2020 - 2031 |
|---|---|
| Forecast Data Period | 2026 - 2031 |
| Base Year Market Size (2025) | 142.61 Million metric normal cubic meters per hour (mm nm³/h) |
| Market Volume (2026) | 161.51 Million metric normal cubic meters per hour (mm nm³/h) |
| Market Volume (2031) | 301.15 Million metric normal cubic meters per hour (mm nm³/h) |
| Growth Rate (2026 - 2031) | 13.26 % |
| Market Concentration | Low |
Major Players *Disclaimer: Major Players sorted in no particular order Image © Mordor Intelligence. Reuse requires attribution under CC BY 4.0. | |
Asia-Pacific Syngas Market Analysis by Mordor Intelligence
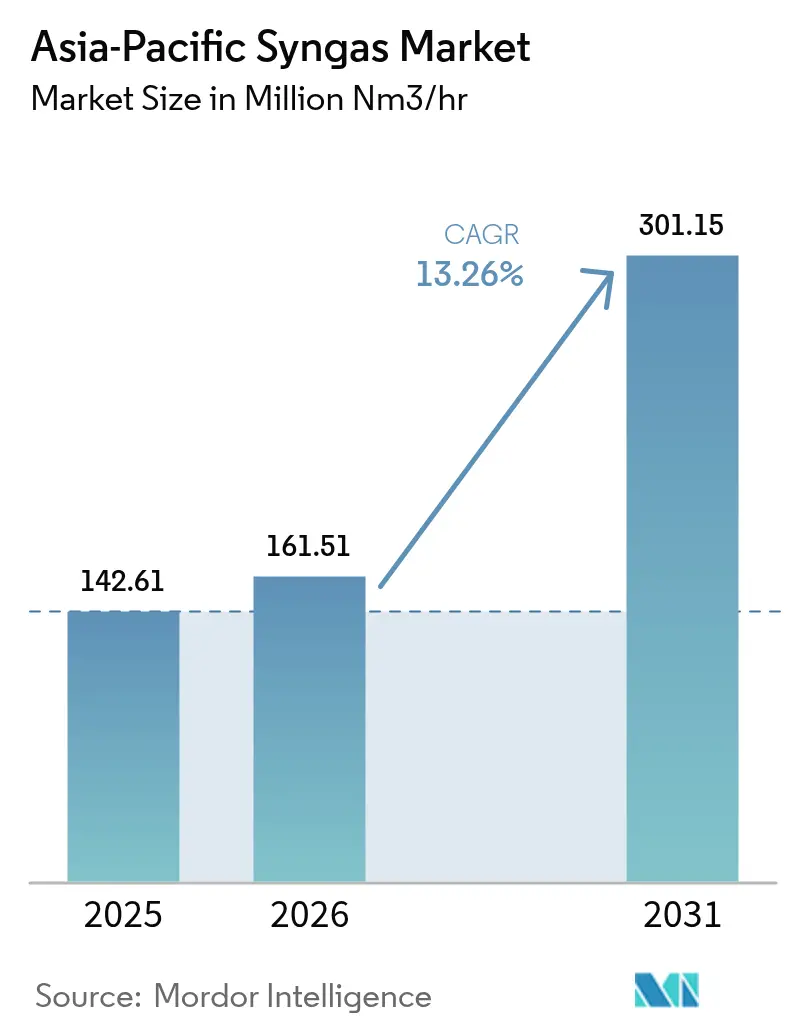
Asia-Pacific Syngas Market size in 2026 is estimated at 161.51 million metric normal cubic meters per hour (mm nm³/h), growing from 2025 value of 142.61 million metric normal cubic meters per hour (mm nm³/h) with 2031 projections showing 301.15 million metric normal cubic meters per hour (mm nm³/h), growing at 13.26% CAGR over 2026-2031.
- The Asia-Pacific Sngas market was negatively affected by the COVID-19 pandemic. China was worst hit by the COVID pandemic in the region. The pandemic resulted in the closure of chemical production plants in countries like India and China, thereby affecting the market for syngas. However, the market recovered well after the restrictions were lifted. The market recovered significantly, owing to the rise in consumption of syngas in power generation and chemical industries.
- The growing demand for syngas from the electricity and chemical industry, increasing environmental awareness and government regulations on renewable fuel use, and increasing hydrogen demand for fertilizers are expected to drive the growth of the market.
- The syngas production plant setup requires high capital investment and funding, which is expected to hinder market growth.
- The development of underground coal gasification technology is likely to act as an opportunity in the future.
- China is expected to dominate the market due to the rising demand for syngas in the power generation and chemical industries. It is also expected to register the highest CAGR during the forecast period.
Note: Market size and forecast figures in this report are generated using Mordor Intelligence’s proprietary estimation framework, updated with the latest available data and insights as of 2026.
Asia-Pacific Syngas Market Trends and Insights
Ammonia Application Segment to Dominate the Market
- Syngas is a byproduct of the industrial synthesis of ammonia and fertilizer. Throughout this process, methane (from natural gas) reacts with water to produce carbon monoxide, and hydrogen (from natural gas) reacts with water to produce carbon monoxide and hydrogen. The gasification process is used to transform any carbon-containing substance into longer hydrocarbon chains.
- Through the Haber-Bosch process, syngas can be turned into ammonia, which is a standard part of fertilizers. During this process, nitrogen from the air is mixed with hydrogen from the syngas to make ammonia, which can then be used to make different kinds of fertilizers.
- Using syngas as a source of raw materials to make fertilizer has a number of advantages. For example, syngas can be made from a number of different materials, which gives companies more options and makes them less reliant on a single raw material. Also, making syngas from biomass by gasifying it can help cut down on greenhouse gas emissions compared to making fertilizer from fossil fuels.
- China accounts for approximately 7% of the overall agricultural acreage globally, thus feeding 22% of the world’s population. The country is the largest producer of various crops, including rice, cotton, potatoes, and others. Hence, the demand for ammonia, which is used as a fertilizer, is rapidly increasing owing to the large-scale agricultural activities in the country.
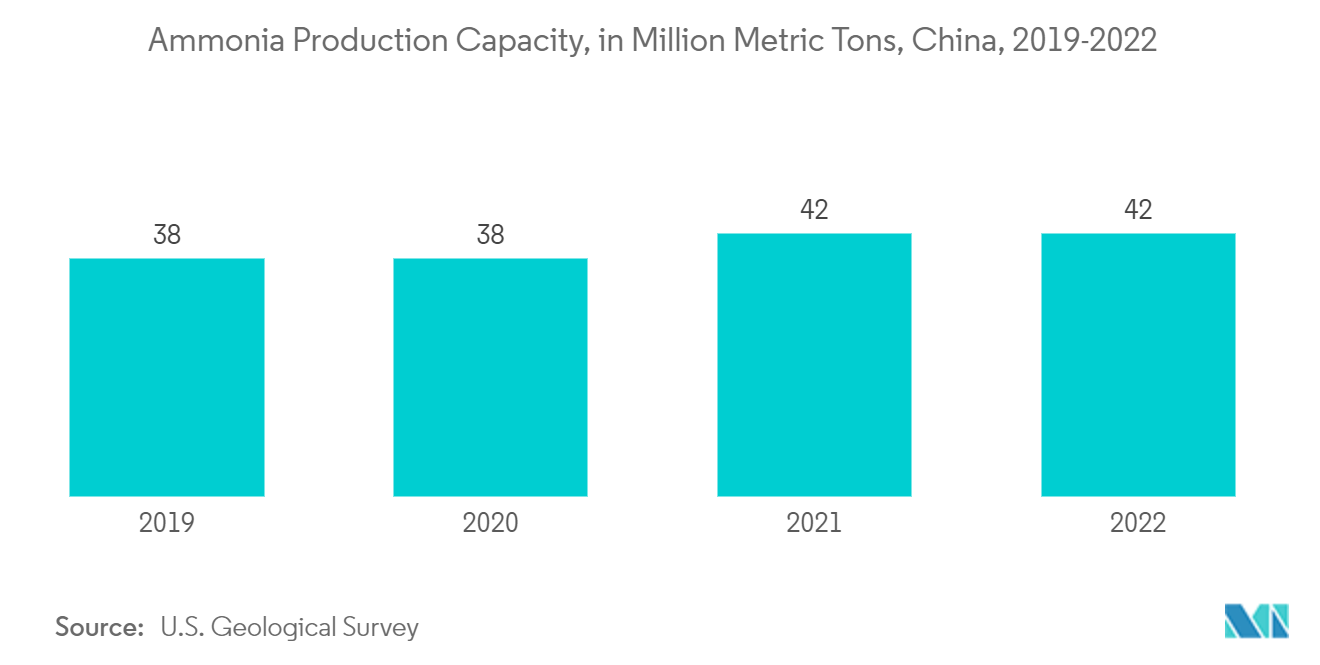
- China is the largest producer and consumer of ammonia in the world. According to the US Geological Survey (USGS), the country produced 42 million metric tons in 2022. The demand for ammonia in the country is rising due to increasing applications in the agriculture industry, such as fertilizers, textiles, pharmaceuticals, and mining.
- Similarly, in India, the demand for ammonia is increasing in the agriculture, textile, and chemical industries. Thus, various companies are increasing their ammonia production capacity in the country. For instance, in May 2023, Deepak Fertilisers and Petrochemicals Corporation (DFPC) announced that it would be commissioning a new USD 522.5 Million ammonia plant and start production by the start of the second half of this year. The company is adding a capacity of 5,00,000 million tonnes per annum (MTPA) at Taloja in Maharashtra, which would take the total ammonia capacity to 6,28,700 MTPA.
- Thus, the increasing demand for ammonia is expected to drive the Asia-Pacific syngas market during the forecast period.


China to Dominate the Asia-Pacific Market
- In the Asia-Pacific region, China is the largest economy in terms of GDP. China is one of the fastest emerging economies and has become one of the biggest production houses in the world today. The country's manufacturing sector is one of the significant contributors to the country's economy.
- In China, the demand for syngas is increasing from power generation, chemicals and fertilizers, liquid fuels, and gaseous fuel applications. Thus, various companies are increasing the production capacity of syngas in the country, thereby driving the market.
- In China, Air Products was awarded a long-term onsite contract to supply syngas to Jiutai New Material Co. Ltd for its high-value mono-ethylene glycol project in Hohhot, China. The facility is designed to produce over 500,000 Nm3/hr of syngas, comprised of five gasifiers, two approximately 100,000 Nm3/hr air separation units (ASU) with syngas purification and processing, and associated infrastructure and utilities.
- China is a significant producer and exporter of fertilizers, particularly ammonia-based fertilizers. The country is home to several significant chemical businesses that specialize in fertilizer manufacture, and its ammonia-based fertilizers are in high demand both domestically and internationally.
- In the chemical industry, syngas is used to make chemicals and fuels. To make syngas, coal, petroleum coke, and biomass are turned into gas. In the chemical business, syngas is used to make methanol, ammonia, and hydrogen. Through the "gas-to-liquids" (GTL) process, carbon monoxide and hydrogen react to turn syngas into methanol. Methanol can be used to make formaldehyde, acetic acid, and other things.
- Syngas is both a fuel and a raw material. It can be used to heat boilers and heat exchangers in chemical plants and for other high-temperature industrial uses. According to the BASF chemical outlook report, the chemical production capacity in China will increase by 7.7% in 2022 as compared to the growth rate of 6.6% during the previous year. Thus the growth in the chemical industry is expected to drive the demand for syngas in the country.
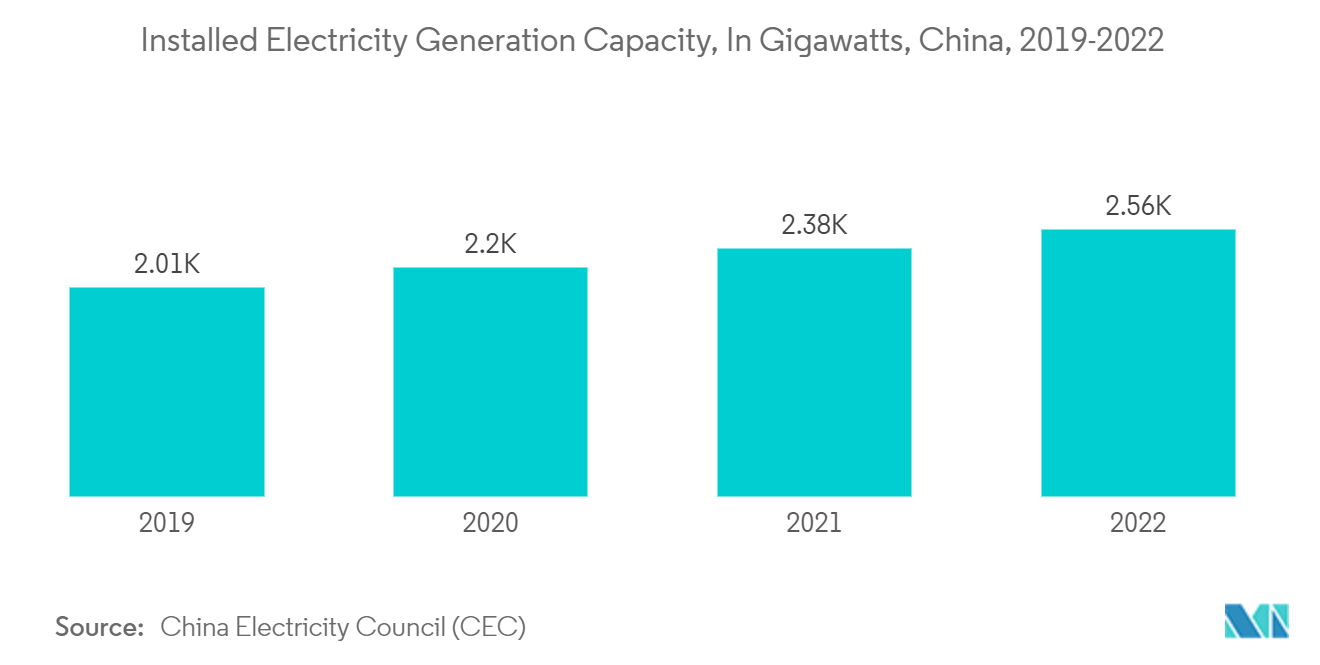
- Increasing power generation in the country is boosting the demand for syngas. According to the China Electricity Council (CEC), in 2022, the power generation capacity in the country is registered at 2559.4 gigawatts, as compared to 2376.1 gigawatts of power generation capacity in the previous year. Thus, the increasing power generation capacity is expected to drive the demand for sungas in the country.
- Thus, the growth in chemical, fertilizer, and power generation industries is expected to drive the Asia-Pacific syngas market during the forecast period.
Value Chain Analysis
The Asia-Pacific syngas value chain starts with feedstock supply (coal, natural gas, pet coke, biomass) sourced from domestic mining and import channels, followed by midstream technology selection and plant buildout (gasifiers, reformers, air separation units, syngas cleanup and compression). Engineering, procurement and construction capability, plus access to critical equipment such as ASUs and gasifiers, influences project schedules and costs. In China, coal-to-gas and coal-to-chemicals projects typically specify integrated packages for air separation and downstream processing within industrial parks.
Downstream, syngas is largely consumed captive or under long-term onsite supply arrangements by ammonia and fertilizer producers, methanol and derivatives makers, coal-to-olefins or coal-to-chemicals complexes, and select power and fuel applications. Industrial gas majors and local suppliers participate through onsite generation and pipeline networks around large customers, while safety and operating standards are reinforced through regional industry bodies such as the Asia Industrial Gases Association (AIGA). Policy-led programs also influence the chain, including India’s National Coal Gasification Mission focus on enabling coal gasification routes for fertilizers, which supports integration between coal supply, gasification units, and fertilizer offtake.
Competitive Landscape
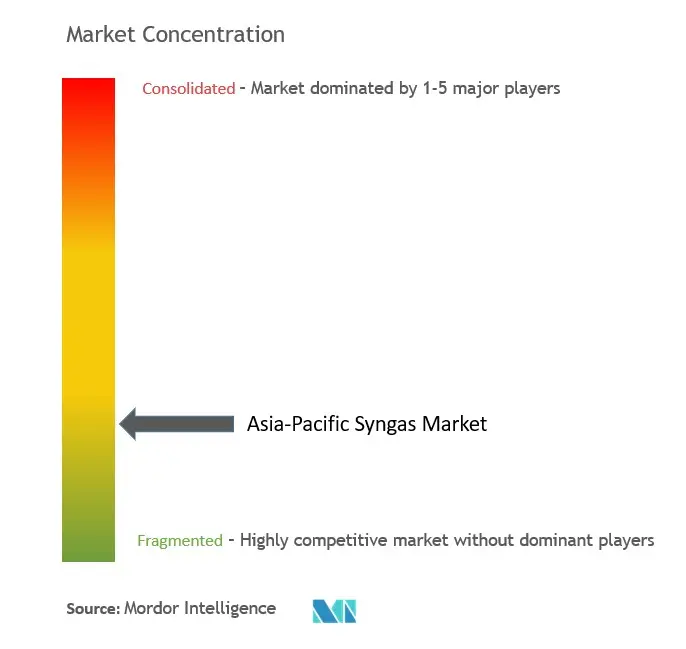
The Asia-Pacific Syngas Market is fragmented in nature. Some of the major players in the market include (not in any particular order) include Air Products and Chemicals, Inc., Air Liquide, Haldor Topsoe A/S, Linde plc, and Sasol, among others.
Asia-Pacific Syngas Industry Leaders
Air Products and Chemicals, Inc.
Linde plc
Air Liquide
Sasol
Haldor Topsoe A/S
- *Disclaimer: Major Players sorted in no particular order

Market Opportunities and Future Outlook
Integrated coal gasification-to-chemicals complexes continue to create room for syngas production tied to captive downstream demand, which can reduce logistics exposure and improve offtake certainty. In India, government and project activity around coal gasification provides a clearer line of sight to future syngas demand centers. In May 2026, the Union Cabinet cleared an INR 37,500 crore scheme to promote surface coal and lignite gasification, targeting conversion of 75 million tonnes of coal. In April 2026, Bharat Coal Gasification and Chemicals Limited (BCGCL) and Mahanadi Coalfields Limited (MCL) signed a land agreement for an indigenous coal-to-ammonium nitrate project in Odisha, reported at INR 25,000 crore. Together, these initiatives support syngas-linked chains such as ammonia and ammonium nitrate for fertilizers and industrial explosives, consistent with the report’s chemicals and ammonia application base.
Low-carbon syngas and hydrogen pathways also broaden the opportunity set, particularly where projects incorporate carbon capture or biogenic and renewable inputs alongside conventional feedstocks. Singapore’s refining and petrochemical hub is pursuing decarbonization options for hydrogen production, highlighted by Air Liquide’s November 2025 MoU with Aster Chemicals and Energy to collaborate on an auto-thermal reformer unit with integrated carbon capture. In China, continued buildout of large coal-to-gas and coal-to-chemicals assets, including projects in Xinjiang and other resource-rich provinces, reinforces demand for large onsite syngas systems and supporting units such as ASUs and purification, while raising the bar for standards-led safe operations and reliable industrial-park utilities across the region.
Recent Industry Developments
- April 2026: Air Liquide announced the groundbreaking of a new air separation unit (ASU) in Huizhou, Guangdong Province, China, targeting supply to the Pearl River Delta. The additional onsite and merchant oxygen and nitrogen capability supports syngas and syngas-adjacent industrial operations that depend on stable oxygen supply. It also improves localized supply reliability for large customers.
- November 2025: Air Liquide and Aster Chemicals and Energy Pte. Ltd. signed an MoU to collaborate on a low-carbon hydrogen production project in Singapore using an auto-thermal reformer unit with integrated carbon capture. The agreement points to closer alignment between syngas-generation technology choices and carbon management requirements in regional refining and petrochemical hubs.
- July 2024: Linde plc reported mechanical completion of its Singapore Jurong Island new gasification project, a major investment to supply hydrogen and syngas to ExxonMobil’s integrated manufacturing complex. The milestone added large-scale, long-term onsite supply infrastructure in one of Asia-Pacific’s key petrochemical clusters, reinforcing the role of integrated hubs in anchoring syngas demand.


Research Methodology Framework and Report Scope
Market Definition and Coverage
For this methodology, the market covers synthesis gas (syngas) produced in Asia-Pacific from key feedstocks and process routes, measured as syngas output capacity in million metric normal cubic meters per hour. It reflects syngas used as an intermediate for fuels, power, and chemical production.
Scope exclusions: Downstream finished product revenues and end-product pricing (such as methanol or ammonia selling prices) are not counted, since the market is sized in syngas volume terms.
Segmentation Overview
- Feedstock
- Coal
- Natural Gas
- Petroleum
- Pet Coke
- Biomass
- Technology
- Steam Reforming
- Partial Oxidation
- Auto-thermal Reforming
- Combined or Two-step Reforming
- Biomass Gasification
- Gasifier Type
- Fixed Bed
- Entrained Flow
- Fluidized Bed
- Application
- Power Generation
- Chemicals
- Methanol
- Ammonia
- Oxo Chemicals
- n-Butanol
- Hydrogen
- Dimethyl Ether
- Liquid Fuels
- Gaseous Fuels
- Geography
- China
- India
- Japan
- South Korea
- Australia & New Zealand
- Rest of Asia-Pacific
Data Sources, Market Sizing, and Validation
Desk Research
Desk research was used to build the factual base for plants, feedstocks, and operating patterns across Asia-Pacific, then assumptions were tested using field inputs. We relied on public datasets such as national energy ministries and statistical offices, IEA style energy balances, UN Comtrade trade tables, and customs or port statistics where available for coal, natural gas, and related inputs.
To connect capacity with use cases, we referenced industry association publications (gasification, hydrogen, and chemicals), peer reviewed papers on gasification and reforming, environmental permitting notices, and company annual reports and investor presentations. In parallel, paid subscriptions that track company financials, patents, and shipment level trade flows were used selectively to cross-check project pipelines and timing. These examples are not exhaustive, and we reviewed additional sources during the study for data collection, validation, and clarification.
Primary Interviews and Surveys
Primary discussions were held with plant operators, EPC and engineering stakeholders, feedstock and equipment participants, and downstream buyers in chemicals and power, so that the capacity picture and utilization assumptions could be checked. Because this is a regional market, inputs were balanced across major Asia-Pacific demand centers and supply hubs, then used to adjust conversion factors, utilization ranges, and project start-up timing when desk research left uncertainty.
Distribution of primary research fieldwork respondents
| Company type | Respondent position |
|---|---|
| Top tier: 26% | CXOs: 18% |
| Mid tier: 55% | Functional/Unit leaders: 28% |
| Smaller Players: 19% | Managers: 54% |
Market-Sizing & Forecasting
Sizing is built mainly using a top-down reconstruction of the regional syngas capacity pool, where announced and operating gasification and reforming capacity is converted into syngas output (mm nm3/h) using technology and feedstock specific conversion factors. Once the country totals are formed, the split is shaped using practical indicators such as new coal gasification and reforming additions, fertilizer and methanol capacity changes, power and industrial gas demand signals, and policy linked project momentum (for example, hydrogen and coal-to-chemicals programs).
To keep the totals realistic, we corroborated results with selective bottom-up checks, including sampled plant level roll-ups in key countries, typical utilization ranges by process route, and implied output per major downstream unit where a stable linkage exists. When project level data was incomplete, gaps were handled by applying conservative commissioning probabilities and ramp-up curves that were reviewed through expert calls.
Forecasting was run using scenario analysis supported by a light multivariate view, with the main drivers being planned capacity commissioning, feedstock availability, utilization normalization, and downstream pull from chemicals and fuels. Assumptions were kept simple enough to be repeatable, and the final year-by-year path was adjusted only after primary feedback confirmed that the growth shape aligns with what is being built and operated on the ground.
Data Validation & Update Cycle
Outputs are checked through triangulation across independent signals, and variance flags are raised when implied syngas intensity per downstream unit or country growth rates look out of line with known build cycles. A second analyst review is applied for key assumptions like utilization, conversion factors, and start-up dates, and the model is reworked when these checks fail.
The report is refreshed annually, and interim updates are made when large plants are delayed, added, or re-scoped, or when policy changes materially alter project economics. Before delivery, a fresh validation pass is completed so clients receive the latest updated view based on the same repeatable steps.
Mordor Intelligence's Asia Pacific Synthesis Gas Syngas Market Market Estimate Compared With Other Published Estimates
It is normal to see different market sizes for Asia-Pacific syngas because sources often mix value and volume, apply different boundaries between syngas and downstream derivatives, and assume different utilization and ramp-up behavior for new projects.
The table shows a wide spread mainly because some publishers convert syngas into USD using assumed prices, while others keep the market in physical output units, and the choice changes what gets counted and how fast it grows. It also depends on whether forecasts treat announced projects as effectively realized, or whether commissioning risk and phased ramp-up are applied consistently across countries.
Benchmark comparison
| Source | Market Size | Gaps in Research Methodology |
|---|---|---|
| Mordor Intelligence | USD 0.14 B (2025) | |
| Regional Consultancy A | USD 27.03 B (2024) | Reported in USD value terms, which typically embeds assumed syngas pricing and may also reflect partial downstream value capture, so it is not directly comparable to a capacity-output view. |
| Industry Publisher B | USD 28.70 B (2026) | Uses a different base year and a value-based framing that can treat announced capacity as effective supply faster, which can lift the number versus a model that applies ramp-up and utilization realism. |
The table mainly differs by unit of measurement. In Mordor Intelligence's model, the market is treated as syngas output capacity (mm nm3/h) tied to technology and utilization checks instead of being translated into revenue using assumed pricing. With clear boundaries and repeatable drivers like commissioning timing, utilization, and feedstock and downstream linkages, the final estimate stays traceable and easier to reconcile over time.


Key Questions Answered in the Report
How big is the Asia-Pacific Syngas Market?
The Asia-Pacific Syngas Market size is expected to reach 161.51 million metric normal cubic meters per hour (mm nm³/h) in 2026 and grow at a CAGR of 13.26% to reach 301.15 million metric normal cubic meters per hour (mm nm³/h) by 2031.
What is the current Asia-Pacific Syngas Market size?
In 2026, the Asia-Pacific Syngas Market size is expected to reach 161.51 million metric normal cubic meters per hour (mm nm³/h).
Who are the key players in Asia-Pacific Syngas Market?
Air Products and Chemicals, Inc., Linde plc, Air Liquide, Sasol and Haldor Topsoe A/S are the major companies operating in the Asia-Pacific Syngas Market.
What years does this Asia-Pacific Syngas Market cover, and what was the market size in 2025?
In 2025, the Asia-Pacific Syngas Market size was estimated at 161.51 million metric normal cubic meters per hour (mm nm³/h). The report covers the Asia-Pacific Syngas Market historical market size for years: 2019, 2020, 2021, 2022, 2023 and 2024. The report also forecasts the Asia-Pacific Syngas Market size for years: 2026, 2027, 2028, 2029, 2030 and 2031.
Page last updated on:


 Your data is secure and never sold or shared.


