3D Printing Materials Market Size and Share
Market Overview
| Study Period | 2021 - 2031 |
|---|---|
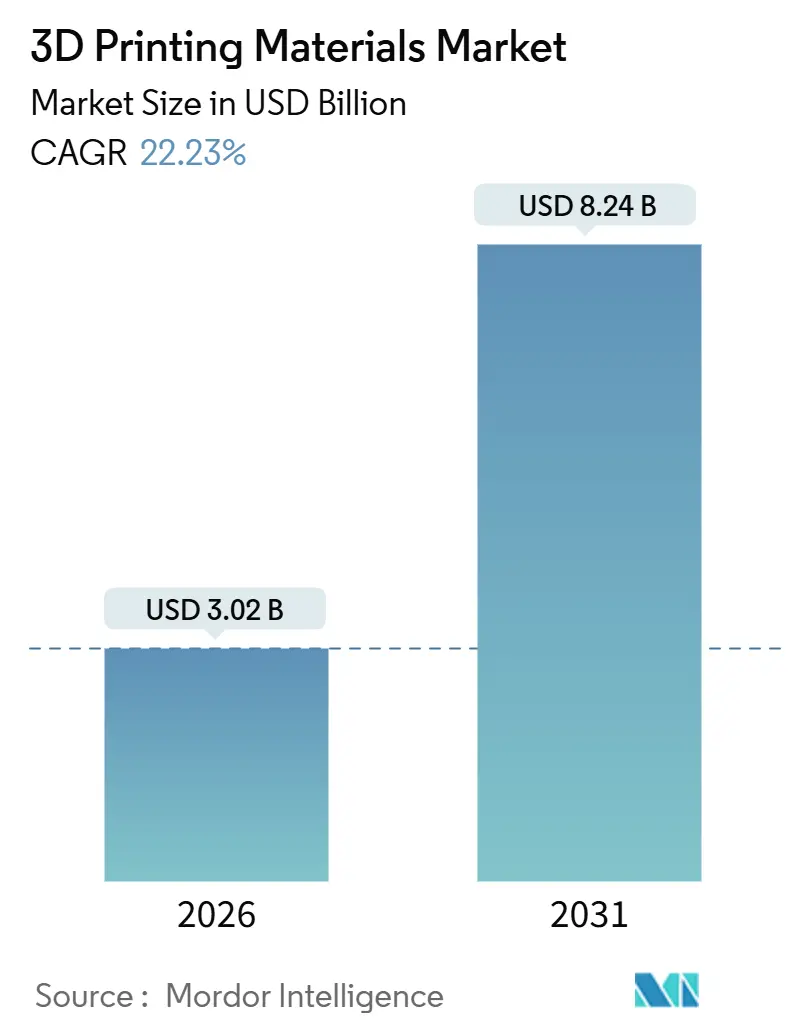
| Market Size (2026) | USD 3.02 Billion |
| Market Size (2031) | USD 8.24 Billion |
| Growth Rate (2026 - 2031) | 22.23% CAGR |
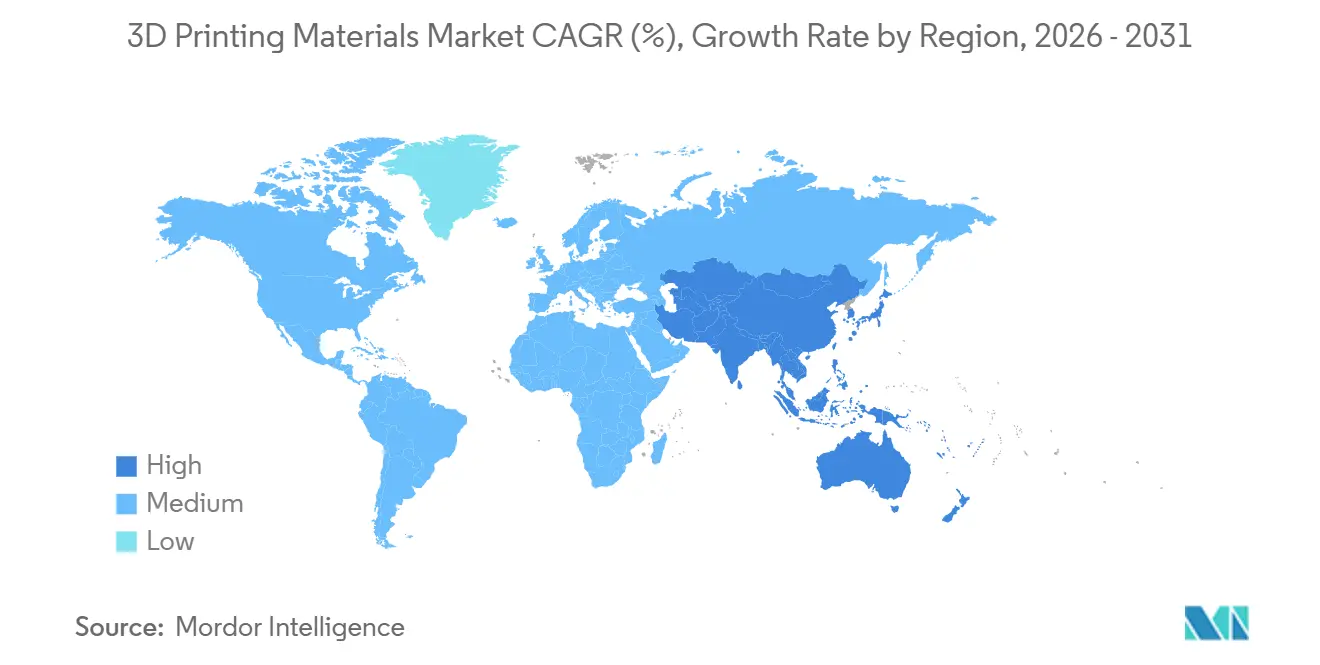
| Fastest Growing Market | Asia Pacific |
| Largest Market | North America |
| Market Concentration | Medium |
Major Players *Disclaimer: Major Players sorted in no particular order Image © Mordor Intelligence. Reuse requires attribution under CC BY 4.0. | |
3D Printing Materials Market Analysis by Mordor Intelligence
The 3D Printing Materials Market size is estimated at USD 3.02 billion in 2026, and is expected to reach USD 8.24 billion by 2031, at a CAGR of 22.23% during the forecast period (2026-2031). Growing regulatory clarity, falling per-part economics, and topology-optimized designs are pushing titanium, aluminum, and high-performance polymers into factory settings at scale. Defense ministries now require on-demand spare-part inventories, automotive OEMs integrate lightweight printed brackets into mass production, and medical device firms leverage FDA 510(k) approvals for patient-specific implants. Competition centers on vertical integration as chemical majors and printer OEMs race to lock customers into qualified, closed-loop ecosystems, while stringent certification and emission rules elevate the importance of batch traceability and powder recycling.
Key Report Takeaways
- By material type, plastics led with 47.78% of the 3D printing materials market share in 2025; metals are forecast to grow at a 23.34% CAGR through 2031.
- By form, filament accounted for 69.90% of the 3D printing materials market size in 2025 and is expanding at a 23.67% CAGR to 2031.
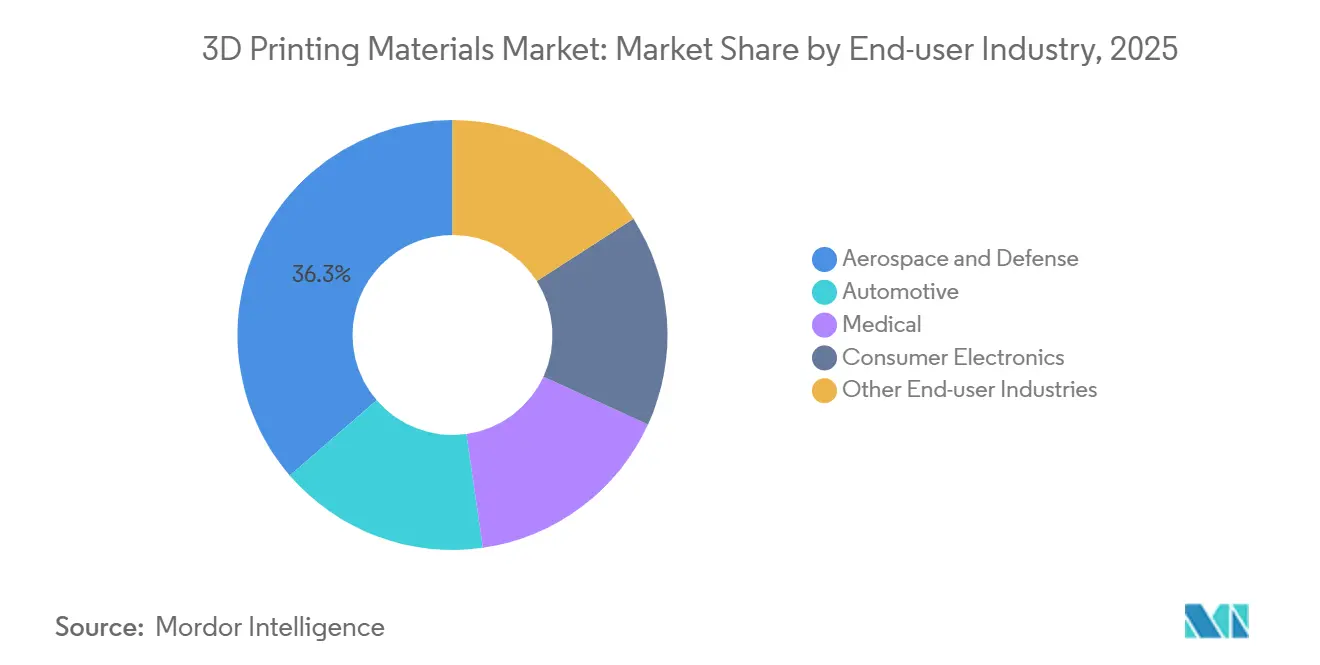
- By end-user industry, aerospace and defense held 36.33% of the 3D printing materials market size in 2025, while automotive registers the fastest 24.93% CAGR through 2031.
- By geography, North America captured 39.52% of the 3D printing materials market share in 2025; Asia-Pacific is advancing at a 26.78% CAGR to 2031.
Note: Market size and forecast figures in this report are generated using Mordor Intelligence’s proprietary estimation framework, updated with the latest available data and insights as of January 2026.
Global 3D Printing Materials Market Trends and Insights
Driver Impact Analysis*
| Drivers | (~) % Impact on CAGR Forecast | Geographic Relevance | Impact Timeline |
|---|---|---|---|
| Surge in metal powder usage for serial aerospace and medical production | +4.5% | North America and Europe core, Asia-Pacific medical expansion | Medium term (2-4 years) |
| Rapid advances in high-performance polymers | +3.8% | Global, with concentration in automotive hubs (Germany, Japan, the US) | Short term (≤ 2 years) |
| Automotive lightweighting initiatives | +3.2% | Europe and China lead, North America following | Medium term (2-4 years) |
| Mass-customization momentum in healthcare and consumer goods | +2.9% | North America and Europe healthcare, Asia-Pacific consumer goods | Long term (≥ 4 years) |
| Regulatory push for on-demand spare-part inventories (defense, rail) | +2.1% | North America defense, Europe rail, spillover to Middle East | Long term (≥ 4 years) |
| Source: Mordor Intelligence | |||
Surge in Metal Powder Usage for Serial Aerospace and Medical Production
Aerospace giants are now certifying flight-critical components, such as turbine blades and brackets, transitioning titanium and aluminum powders from design labs to production lines[1]GE Additive, “Titanium Powder for Aerospace Production,” ge.com. In the medical sector, producers are ramping up their use of cobalt-chrome powders for hip and knee implants. Suppliers are prioritizing batch consistency and oxygen thresholds over price, thereby strengthening their quality-assurance edge. Printed titanium brackets, being lighter than their machined counterparts, offer lifetime fuel savings that counterbalance a material-cost premium. Meanwhile, ASTM F42's standards on particle size and purity are setting high entry barriers, confining newcomers to niche applications.
Rapid Advances in High-Performance Polymers
Polyetheretherketone (PEEK) and polyetherketoneketone (PEKK) are replacing metals in applications where sterilizability and flame resistance take precedence over weight considerations. Arkema’s Kepstan PEKK can endure continuous exposure to high temperatures, making it ideal for surgical trays that can withstand repeated autoclave cycles. Victrex boosted its PEEK shipments, targeting aerospace cabins and spinal implants that comply with FAA flammability standards, all without the need for additional coatings. Material suppliers are now certifying resins directly with end-users, sidestepping printer OEMs. This approach has notably reduced the qualification process timeline. Even with a high price tag, PEEK's adoption is on the rise, driven by its long-term performance benefits that overshadow the initial cost. Meanwhile, mid-tier polymers are carving out a niche, bridging the divide between commodity nylons and premium aerospace grades, thus broadening the market's addressable demand.
Automotive Lightweighting Initiatives
European and Chinese OEMs are now producing optimized brackets and heat exchangers, reducing weight per electric vehicle and boosting the range. Using topology-optimization software, they can eliminate material compared to traditional cast parts, a feat not economically achievable through machining. Chinese EV giants have established in-house powder-bed fusion fleets, allowing them to sidestep tier-1 suppliers and reclaim their margins. However, there's a hurdle: certification lags. Tests for ISO 26262 fatigue and vibration can delay time-to-market[2]International Organization for Standardization, “Additive Manufacturing Standards Update,” iso.org. Yet, once these hurdles are cleared, the printed parts are integrated as permanent items in the bill of materials. The cost per part aligns with die-cast components, highlighting the allure of additive manufacturing for low-volume, high-variety assemblies.
Mass-Customization Momentum in Healthcare and Consumer Goods
Align Technology manufactured clear-aligner sets in 2025, demonstrating that personalized designs can thrive in mass production. Leaders in the hearing-aid industry, Sonova and Demant, have automated the printing of their shells, achieving a remarkable fit rate and doing away with manual sculpting. Athletic footwear brands are now printing performance midsoles customized to individual gaits, underscoring their ability to command premium prices. Custom implants are seeing a price premium due to enhanced patient outcomes, and there's an added cost for powder traceability and biocompatibility testing. For broader adoption, resin prices need to dip and printing speeds should surpass current benchmarks, both of which are anticipated to be met within the forecast period.
Restraint Impact Analysis*
| Restraints | (~) % Impact on CAGR Forecast | Geographic Relevance | Impact Timeline |
|---|---|---|---|
| High equipment and material cost | -2.8% | Global, acute in emerging markets (India, Brazil, Mexico) | Short term (≤ 2 years) |
| Stringent certification for aerospace and medical grades | -2.3% | North America and Europe regulatory zones | Medium term (2-4 years) |
| Nanoparticle emission and waste-powder disposal concerns | -1.7% | Europe and North America, emerging in Asia-Pacific | Long term (≥ 4 years) |
| Source: Mordor Intelligence | |||
High Equipment and Material Cost
Industrial metal printers are expensive, and PEEK filament is significantly more costly than commodity ABS. Despite the favorable economics for producing limited units annually, mid-tier manufacturers in emerging markets are hesitant to adopt these technologies. HP's Multi Jet Fusion has seen its uptake predominantly among contract manufacturers rather than end-users. Furthermore, subscription models that combine powders with engineering support require multi-year commitments. This poses a challenge for smaller firms, leading to a divided market: while cash-rich OEMs expand, prototypers find themselves at a standstill.
Stringent Certification for Aerospace and Medical Grades
Qualifying a new material takes suppliers significant time, as they conduct tensile, fatigue, and biocompatibility tests under ASTM F42 and ISO 13485. Aerospace OEMs impose extra audits, demanding powder lot traceability and AS9100 compliance, which inflates administrative costs. These challenges favor established players, sidelining startups—even those with advanced formulations. Consequently, the sector is gravitating towards pre-certified portfolios to spread out qualification expenses.
*Our forecasts treat driver/restraint impacts as directional, not additive. The impact forecasts reflect baseline growth, mix effects, and variable interactions.
Segment Analysis
By Material Type: Metals Outpace Plastics in Serial Production
Metals expanded faster than any other category, and they are set to close the gap with plastics, which held a 47.78% share in 2025. Titanium alloys dominate aerospace brackets, turbine blades, and fuel nozzles, while aluminum alloys such as AlSi10Mg underpin automotive lightweighting programs. Cobalt-chrome powders are now routine for hip and knee replacements as surgeons report reduced revision surgeries. The 3D printing materials market size for metals is forecast to grow at a 23.34% CAGR through 2031 as certifications accumulate. Plastics remain core in desktop prototyping thanks to sub-USD 30 ABS and PLA. Nevertheless, high-performance polymers like PEEK, PEKK, and nylon 12 are displacing metals in cabin interiors and surgical instruments where sterilizability and flame retardance are critical.
The long-run portfolio mix will favor suppliers that straddle commodity filaments and aerospace-grade powders. Larger vendors hold ASTM and ISO credentials across multiple geographic zones, lowering customer onboarding costs. Ceramics, still a niche, gain relevance in dental crowns and high-temperature tooling. Waxes and binder agents comprise a small volume yet remain critical for investment casting, showcasing the breadth of demand within the 3D printing materials market.


By Form: Filament Dominance Masks Powder and Resin Innovation
Filament is entrenched with a 69.90% share because desktop FDM printers number in the millions. Yet its 23.67% growth tracks overall industry maturation, indicating saturation in developed economies. In contrast, powder and photopolymer resins concentrate revenue and margins. EOS and SLM Solutions dominate the powder segment, catering to titanium and Inconel parts that demand high density. Their prowess has led them to clinch multiyear contracts in the aerospace sector. Meanwhile, HP's nylon-based powder platform is making waves, nearing injection-molding economics for smaller orders. This has piqued the interest of both the automotive and consumer-electronics industries. In another realm, resins are shining brightly in the dental and jewelry sectors, where achieving fine resolution is paramount.
Powder and resin innovations draw the lion’s share of venture funding and intellectual property filings, emphasizing a pivot toward high-value formats. Nonetheless, filament retains a massive installed base that generates steady recurring revenue for consumables vendors. The dual pathway highlights an industry where accessibility and performance coexist, both essential to sustain the expansion of the 3D printing materials market.
By End-User Industry: Automotive Closes Gap with Aerospace
Aerospace and defense commanded 36.33% of demand in 2025, leveraging long certification cycles to lock in powder suppliers. Boeing's 787, by integrating numerous printed titanium parts, achieves a weight reduction per aircraft, leading to significant fuel savings throughout its service life. Defense agencies emphasize logistics agility through on-site printing of spare parts, driving material traceability requirements. The 3D printing materials market size for aerospace is expected to hold double-digit growth as new aircraft platforms adopt additive components.
Automotive, growing at 24.93% CAGR, is the fastest mover as electric-vehicle programs wrestle with battery-weight penalties. Volkswagen’s ID.4 and numerous Chinese OEMs deploy powder-bed and binder-jetting systems to print brackets, manifolds, and heat exchangers, bypassing traditional tier-1 suppliers. Medical remains a robust third pillar, propelled by implants, surgical guides, and dental aligners that command premium pricing. Consumer electronics present emerging volume potential as print speeds and resin prices fall, demonstrating that the 3D printing materials market can scale beyond specialized industrial domains.
Geography Analysis
North America maintained a 39.52% share in 2025, leveraging deep aerospace and medical ecosystems and federally funded programs such as America Makes that subsidize material qualification and workforce curricula. U.S. aerospace primes, Canadian engine builders, and Mexican automotive maquiladoras collectively sustain steady demand. Growth remains positive yet slower than Asia-Pacific, hinting that first-mover advantage is plateauing.
Asia-Pacific commands the fastest trajectory with a 26.78% CAGR through 2031. China’s Ministry of Industry and Information Technology invested in new titanium and aluminum powder capacity, tightening domestic supply chains and reducing reliance on Western imports. India incentivizes patient-specific orthopedic implants, placing cobalt-chrome powder within reach of regional manufacturers. Japan and South Korea incorporate high-performance polymers into electronics and shipbuilding, while Singapore positions itself as a certification and research and development hub tailor-made for tropical climates. As a result, Asia-Pacific is transitioning from a demand center to a supply powerhouse, reshaping trade flows in the 3D printing materials market.
Europe's growth is anchored by German automotive leaders and by France-based Airbus adopting printed titanium brackets in fuselages. The EU Circular Economy Action Plan accelerates recycled-powder standards and biodegradable polymers, reinforcing sustainability credentials. South America and the Middle East remain emerging, yet Brazil’s Embraer and Saudi defense contractors pilot additive approaches, signaling long-term upside. Continuous investment in standards, recycling, and regional capacity will determine whether incumbents hold share or cede ground to new entrants.

Competitive Landscape
The 3D printing materials market shows moderate fragmentation. Chemical majors expand vertically into powder atomization and resin formulation, often acquiring niche specialists to shorten development cycles. Printer OEMs secure material pipelines through acquisitions and exclusive qualification agreements, aiming to lock in consumable revenue streams. Specialized powder firms compete on micron-scale consistency, oxygen control, and documentation that withstands aerospace audits. Technology leadership pivots to in-situ monitoring and software integration. Certification remains a moat: only suppliers with ISO 13485, AS9100, and ASTM F42 credentials supply flight or implant segments, concentrating high-margin demand among roughly a dozen global players. White-space persists in biodegradable polymers for consumer packaging and ultra-high-temperature ceramics for energy, but both await clearer qualification pathways. The evolving landscape suggests that scale, intellectual property, and regulatory fluency will define winners in the 3D printing materials market.
3D Printing Materials Industry Leaders
Stratasys
3D Systems, Inc.
BASF
EOS GmbH
Arkema
- *Disclaimer: Major Players sorted in no particular order

Recent Industry Developments
- April 2025: HP Development Company, L.P. announced commercial availability of HP 3D HR PA 12 FR, a halogen-free, flame-retardant polymer powder for 3D printing developed with Evonik for Multi Jet Fusion systems.
- February 2024: Evonik Industries AG launched a new photopolymer resin, INFINAM FR 4100L, that is flame retardant and mechanically durable when cured, designed for use with DLP 3D printers.


Research Methodology Framework and Report Scope
Market Definitions and Key Coverage
Our study defines the 3D printing materials market as the annual value of virgin polymers, metals, ceramics, and emerging composite or bio-based feedstocks that are purpose-manufactured for additive manufacturing equipment across all technologies (FDM/FFF, SLS, DMLS, SLA, binder jetting, and others). Materials consumed in post-processing or sold as refurbished lots are outside the scope.
Scope Exclusion: Second-hand powders, recycled spools, and in-house experimental batches are not counted.
Segmentation Overview
- By Material Type
- Plastics
- Acrylonitrile Butadiene Styrene (ABS)
- Polylactic Acid (PLA)
- Nylon
- Polyamide
- Polycarbonate
- Other Plastics (Composites, Biodegradable Polymers, etc.)
- Metals
- Ceramics
- Other Materials (Gases, Waxes)
- Plastics
- By Form
- Powder
- Filament
- Liquid / Resin
- By End-user Industry
- Aerospace and Defense
- Automotive
- Medical
- Consumer Electronics
- Other End-user Industries (Energy and Power, Industrial Machinery, etc.)
- By Geography
- Asia-Pacific
- China
- Japan
- South Korea
- India
- Singapore
- Rest of Asia-Pacific
- North America
- United States
- Canada
- Mexico
- Europe
- Germany
- United Kingdom
- France
- Italy
- Russia
- Rest of Europe
- South America
- Brazil
- Argentina
- Rest of South America
- Middle-East and Africa
- Saudi Arabia
- South Africa
- Rest of Middle-East and Africa
- Asia-Pacific
Detailed Research Methodology and Data Validation
Primary Research
Mordor analysts interviewed filament compounders, metal powder atomizers, aerospace materials engineers, and AM service bureaus across North America, Europe, and Asia-Pacific. Discussions clarified average selling prices, qualification lead times, and scrap-to-print ratios, then validated volume shares that secondary data hinted at but did not quantify.
Desk Research
We first mapped the demand pool through publicly available trade datasets such as UN Comtrade HS 391690 and 810890 for plastic powders and specialty metal alloys, national statistics from the US Census Bureau, Eurostat Comext, and China Customs, followed by regulatory references like ASTM F2792 and ISO/ASTM 52900 that clarify material categories. Industry white papers from the Additive Manufacturing Users Group, newsletters of the Society of Manufacturing Engineers, patent abstracts accessed via Questel, and company disclosures gathered on D&B Hoovers supplied production capacity, pricing swings, and technology adoption timelines. Additional context came from peer-reviewed journals in Additive Manufacturing and periodic releases of the International Organization for Standardization. The sources named are illustrative; analysts accessed many other documents to round out intelligence.
Market-Sizing & Forecasting
A top-down reconstruction began with import-export tonnage and domestic output of certified powders and filaments, converted to value through region-specific ASP curves. Results were pressure-tested with selective bottom-up checks that rolled up material revenues of fifteen leading suppliers and benchmarked them against installed printer counts in medical, automotive, and consumer segments. Key variables like printer shipment growth, aerospace metal uptake rates, polymer price indices, regulatory approvals, and powder reuse factors feed a multivariate regression that projects demand to 2030, with scenario analysis adjusting for feedstock price shocks. Where supplier disclosures lacked granularity, gap assumptions were moderated using median ratios from confirmed peers.
Data Validation & Update Cycle
We triangulate every iteration against shipment manifests, quarterly earnings, and price trackers. An anomaly log prompts re-contact with experts, and a senior analyst reviews the file before sign-off. Reports refresh yearly, while material events (for example, a nickel super-alloy shortage) trigger interim updates.
Why Mordor's 3D Printing Materials Baseline Is Dependable
Published figures often diverge because firms pick different feedstock lists, bundle services, or freeze exchange rates at varied points in time. Our disciplined scoping, live price tracking, and annual refresh cadence narrow those gaps.
Key gap drivers include whether spent powders are included, if hardware service revenue is mixed with material sales, and the aggressiveness of printer penetration assumptions; some publishers also extrapolate from isolated supplier data without cross-checking import flows.
Benchmark comparison
| Market Size | Anonymized source | Primary gap driver |
|---|---|---|
| USD 2.99 B (2025) | Mordor Intelligence | - |
| USD 3.58 B (2025) | Regional Consultancy A | Bundles prototype services with material revenue, limited trade-flow audit |
| USD 3.88 B (2025) | Global Consultancy B | Counts recycled feedstock and uses static 2024 ASPs |
In sum, our model balances real shipment evidence with supplier insights, giving decision-makers a transparent, reproducible baseline that stays current as the additive ecosystem evolves.


Key Questions Answered in the Report
How fast is the demand for 3D printing metals growing?
Metal powders in the 3D printing materials market are projected to expand at a 23.34% CAGR through 2031, driven by aerospace and medical adoption.
Why does filament still dominate additive manufacturing materials?
Filament retains a 69.90% share because of its affordability and the vast global installed base of desktop fused-deposition printers.
Which region offers the strongest growth outlook?
Asia-Pacific shows the highest momentum with a 26.78% CAGR, supported by Chinese investment in titanium and aluminum powder capacity and Indian medical-device incentives.
What is the main barrier for small manufacturers to adopt industrial 3D printing?
Cash-strapped firms are delaying adoption due to high capital outlays for metal printers and premium polymer prices.
How do certification requirements affect new material launches?
Aerospace and medical approvals under ASTM F42 and ISO 13485 can lock capital for 18-36 months, favoring suppliers with established regulatory relationships.
What is the value of the 3D printing materials market?
What is the value of the 3D printing materials market?
Page last updated on:


