
Asia-Pacific Quinoa Seeds Market Analysis by Mordor Intelligence
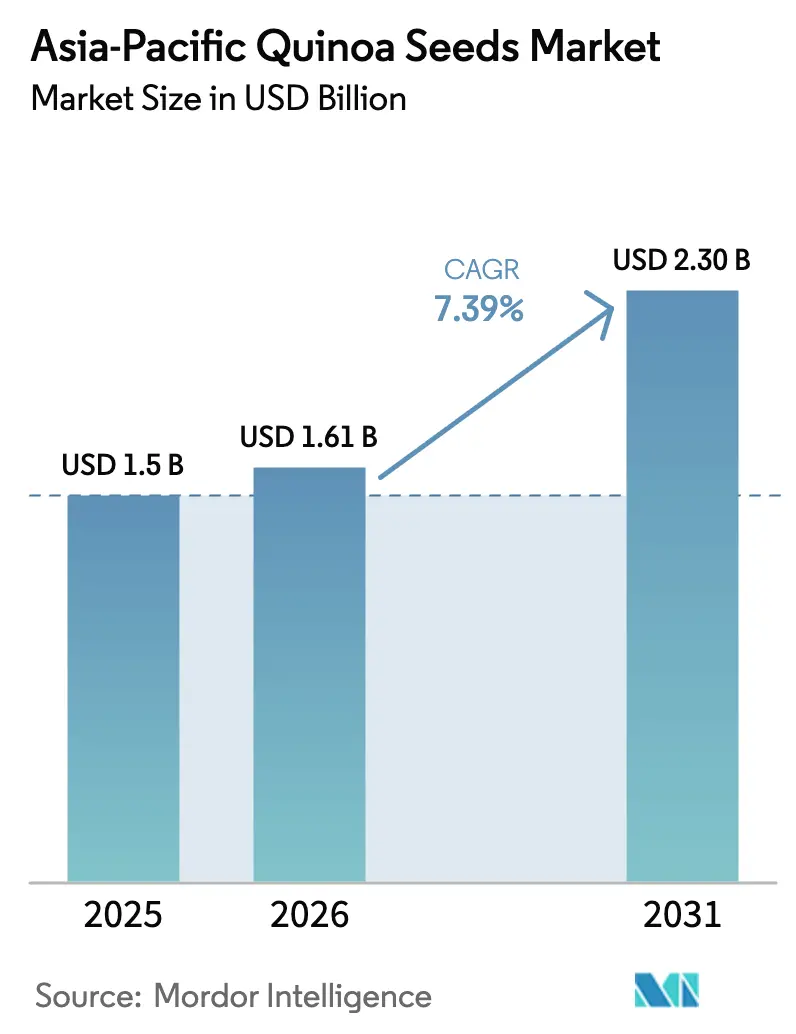
The Asia-Pacific quinoa seed market size was valued at USD 1.5 billion in 2025 and is estimated to grow from USD 1.61 billion in 2026 to USD 2.3 billion by 2031, at a CAGR of 7.39% during the forecast period (2026-2031). This market growth underscores a notable shift post-pandemic, with consumers gravitating towards gluten-free, plant-based proteins, spurred by urban buying trends and heightened institutional demand. China leads with over 100 registered enterprises, while India demonstrates the fastest growth, driven by policy-supported seed distribution and expanding e-commerce. Innovations in low-altitude, drought-resistant cultivars are not only mitigating agronomic risks but also expanding acreage in regions like Australia, northern China, and semi-arid India. Meanwhile, Japan and China are tightening residue limits through regulatory changes, increasing compliance costs but simultaneously benefiting certified organic supply chains. The competitive landscape in the downstream branded foods market is intensifying, driven by acquisitions and product innovations targeting price premiums. Meanwhile, public institutions maintain dominance in upstream breeding activities.
Key Report Takeaways
By geography, China led with 41% of the Asia-Pacific quinoa seed market share in 2025, while India is forecast to expand at a 12% CAGR to 2031.
Note: Market size and forecast figures in this report are generated using Mordor Intelligence’s proprietary estimation framework, updated with the latest available data and insights as of January 2026.
Market Trends and Insights
Drivers Impact Analysis of Asia-Pacific Quinoa Seeds Market*
| Driver | (~) % Impact on CAGR Forecast | Geographic Relevance | Impact Timeline |
|---|---|---|---|
| Rising health consciousness and gluten-free diet adoption | +1.8% | China, Japan, and India (tier-1 & tier-2 cities) | Medium term (2-4 years) |
| Demand for plant-based proteins and superfoods | +1.5% | China, India, and Japan | Medium term (2-4 years) |
| Expansion of organic farming incentives | +1.2% | China (Gansu, Qinghai), India (Rajasthan, Karnataka), and Australia | Long term (≥4 years) |
| Rapid growth of e-commerce and modern retail | +1.0% | China, India, and Japan | Short term (≤2 years) |
| School nutrition programs integrating quinoa in China and India | +0.9% | China (national), India (pilot states) | Long term (≥4 years) |
| Breakthrough low-land, drought-tolerant quinoa cultivars | +1.0% | China (Shanxi, Gansu), India (Rajasthan), and Australia | Long term (≥4 years) |
| Source: Mordor Intelligence | |||
Rising Health Consciousness And Gluten-Free Diet Adoption
Post-pandemic label scrutiny spurred demand for complete-protein grains, prompting a 22.2% jump in Japan’s 2024 quinoa imports and expanded shelf space in Chinese coastal supermarkets [1]. Urban Indian households, influenced by wellness influencers, replaced wheat in breakfast mixes with quinoa, reinforcing higher per-capita consumption. Provincial Chinese retailers further boosted credibility by promoting products certified under the nation’s organic logo, which mandates zero gluten contamination. Heightened consumer focus on micronutrients such as iron and magnesium keeps quinoa positioned as a premium “super grain.” Retailers across tier-1 and tier-2 cities continue to leverage gluten-free messaging to defend higher price points and margin structures [3].
Demand For Plant-Based Proteins And Superfoods
Quinoa’s 14-18% protein content and neutral flavor profile give formulators a competitive edge when designing dairy-alternative beverages. Nourish You’s millet-quinoa drink, launched in 2023 after two years of R&D with Indian institutes, illustrates technical success in creating shelf-stable, lactose-free options. Australian brand Keen Wah secured nationwide supermarket placement for quinoa granola by highlighting complete-protein credentials and low added sugars. Chinese snack makers now market puffed quinoa crisps rich in lysine, targeting parents concerned about children’s amino-acid intake. This convergence of functionality and marketing drives steady ingredient pull through the supply chain.
Expansion Of Organic Farming Incentives
China’s GB2763 residue list, extended to roughly 15,000 pesticides by 2025, raises compliance costs for conventional growers and tilts smallholders toward organic cultivation. Provincial subsidies in Gansu and Qinghai cover certification fees and soil tests, letting farmers access premium urban markets. India’s Agricultural and Processed Food Products Export Development Authority (APEDA) recorded that 52.8% of “other cereals” exports, including quinoa, headed to the United States in FY 2024, signaling lucrative returns for the United States Department of Agriculture (USDA)-aligned organic lots [3]. Australia’s public-domain Kruso White variety generated rain-fed gross margins twice those of wheat at Geraldton, strengthening the business case for organic rotations [2]. Collectively, these incentives lower entry barriers and guarantee price premiums that cushion farmers against volatility.
Rapid Growth Of E-Commerce And Modern Retail
Digital channels shrink geographic gaps, letting niche brands aggregate demand in cities lacking premium grocery stores. Bengaluru-based Healthy Buddha retails black quinoa at USD 4.05 per 500 g, a price consumers accept online due to perceived quality and convenience [3]. China’s Tmall health-food category ranks listings by origin and certification, increasing transparency and accelerating conversion among wellness shoppers. Japan’s food e-commerce penetration, while modest, is rising as seniors seek home-delivered specialty items, creating incremental volume for quinoa importers. Modern retailers complement online sales by offering private-label quinoa Stock Keeping Unit (SKU)s, often backed by supplier grants that lock in exclusive supply and assure scale.
Restraints Impact Analysis of Asia-Pacific Quinoa Seeds Market*
| Restraint | (~) % Impact on CAGR Forecast | Geographic Relevance | Impact Timeline |
|---|---|---|---|
| High production costs and yield variability outside Andes | -1.5% | Australia, China (low-altitude regions), and India | Medium term (2-4 years) |
| Supply-chain-driven price volatility | -1.2% | Asia-Pacific import-dependent markets | Short term (≤2 years) |
| Low consumer awareness beyond tier-1 metro areas | -0.8% | India (tier-3 cities, rural), inland China | Medium term (2-4 years) |
| Stringent residue and organic-audit regimes in China and Japan | -0.6% | China, Japan | Long term (≥4 years) |
| Source: Mordor Intelligence | |||
High Production Costs And Yield Variability Outside Andes
Average yields in Australia hover at 1.5 metric tons/hectare, far below the 3 metric tons/hectare achieved with optimized Chilean germplasm, while Chinese trials show a spread from 0.5 metric tons/hectare to 5.1 metric tons/hectare, underscoring genotype-by-environment complexities [2]. Dedicated processing lines for scarification and drying require high upfront capital, yet current regional volumes rarely fill capacity. Farmers, therefore, face compressed margins and hesitate to expand plantings. Without scale, processors cannot amortize equipment, perpetuating a cycle of under-investment. The result is a structural drag on supply growth across key Asia-Pacific agro-ecologies.
Supply-Chain-Driven Price Volatility
Peru and Bolivia still supply 72% of global exports, linking Asian prices to South American harvests and freight swings. Tridge data show 2024 spot quotes ranged from USD 2.45 to USD 6.58/kg before stabilizing near USD 6.00/kg in early 2025, a swing that complicates retailer promotions and processor costing. Japan’s 26% unit-price rise in 2024 reduced affordability despite modest volume growth. Volatility discourages long-term farmer contracts, forcing processors to rely on spot markets that may clear at unfavorable prices. This feedback loop constrains category expansion in cost-sensitive segments.
*Our forecasts treat driver/restraint impacts as directional, not additive. The impact forecasts reflect baseline growth, mix effects, and variable interactions.
Geography Analysis
China Quinoa Seeds Market
China accounted for 41% of the Asia-Pacific quinoa seed market size in 2025. China’s leadership in the Asia-Pacific quinoa seed market rests on widespread provincial cultivation, 100-plus processors, and a sophisticated e-commerce ecosystem that rapidly diffuses new health-food trends. Even so, stricter residue thresholds and labeling reforms incentivize local sourcing, compressing import needs and enhancing upstream margins for compliant domestic suppliers. Provincial subsidies for organic certification encourage a pivot toward premium positioning, buffering producers from commodity price swings.
India Quinoa Seeds Market
India is the fastest-growing component of the Asia-Pacific quinoa seed market, advancing at a 12% CAGR through 2031. India’s growth trajectory depends on closing the agronomic yield gap, investing in scarification and washing infrastructure, and extending consumer education beyond top-tier metros. Seed-delivery schemes and mid-day meal pilots create grassroots awareness, while the Agricultural and Processed Food Products Export Development Authority (APEDA) streamlines export logistics to monetize diaspora demand. Trade data show a clear inflection in 2023 imports, underscoring latent consumption potential that domestic farms have yet to satisfy.
Japan Quinoa Seeds Market
Japan exemplifies an import-dependent, regulation-intensive destination. Ageing consumers value high protein and gluten-free labels, but packaging localization and residue testing escalate landed costs. Organic Japanese Agricultural Standards-European Union (JAS-EU) equivalency reduces paperwork for Europe exporters, threatening South American incumbents lacking similar recognition. Retailers leverage quinoa in convenience formats such as salads and instant cups, aligning with on-the-go consumption patterns.
Regulatory Landscape
Quinoa seeds and grain operate in a fragmented regulatory environment across Asia-Pacific, with rules varying by end use (seed-for-sowing versus seed-for-consumption) and by destination. In Australia, the Biosecurity Act 2015 framework governs imports, where importers must check BICON conditions and meet phytosanitary and contaminant-tolerance requirements for seeds, making documentation and lot-level cleanliness central to market access. In China, the Seed Law of the People's Republic of China governs domestic seed management, while residue compliance has tightened further, including the GB 2763 residue list being expanded to around 15,000 pesticides by 2025, which increases the testing and traceability burden for conventional supply chains.
Southeast Asian markets add additional trade and labeling requirements. Vietnam requires plant quarantine inspection and food-safety dossiers for cereal imports, alongside mandatory Vietnamese sub-labeling under Decree 43/2017/ND-CP and Decree 111/2021/ND-CP, which can affect packaging localization and import lead times for branded quinoa. Myanmar lists quinoa under HS 1008500000 and requires an import license from the Ministry of Commerce, as well as an Import Certificate for plants and plant products from the Department of Agriculture, reinforcing the need for country-by-country compliance planning among regional distributors.
Value Chain Analysis
The Asia-Pacific quinoa seeds value chain runs from upstream breeding and seed multiplication, often supported by public research institutions, to farm production, aggregation, and post-harvest processing (washing, scarification, drying). It then moves to importers, modern retail, e-commerce platforms, and food manufacturers. China anchors regional demand with 100-plus registered processors and strong online retail discovery, while India functions as both a production base and a fast-growing consumption and processing market, widening ingredient pull through plant-based beverages, granola, and snack formats. Midstream remains a structural bottleneck, since specialized processing lines and consistent quality control are capital intensive relative to throughput in several emerging producing geographies, keeping switching costs low but limiting scale efficiencies.
Public programs and development partnerships increasingly influence how new supply is organized, particularly in emerging high-altitude and climate-stressed areas. Bhutan supports quinoa through the FAO One Country One Priority Product (OCOP) initiative, with local chain participants including the National Centre for Organic Agriculture (NCOA), Food Corporation of Bhutan Limited (FCBL), and Regional Agricultural Marketing and Cooperatives Office (RAMCO), supported by training, seed distribution, and buy-back style risk-mitigation mechanisms. The FAO Regional Technical Cooperation Project launched in January 2025 across Bhutan, Mongolia, and Iran adds structured technical assistance for seed systems, extension, and market linkages, helping formalize procurement and quality practices needed for consistent downstream supply.
Competitive Landscape
The Asia-Pacific quinoa seed market features diversified upstream cultivation while signaling downstream consolidation. Public research institutions play a significant role in seed breeding and varietal release, maintaining an upstream environment where intellectual property largely remains in the public domain. AgriFutures Australia’s 2024–2029 plan exemplifies this approach by providing Kruso White and two additional drought-tolerant lines to growers without licensing fees, thereby reducing entry barriers for Australian farmers. Similarly, in China, state universities have screened over 300 accessions in Shanxi to identify low-altitude genotypes, while more than 100 registered processors compete for urban shelf space. Midstream fragmentation continues as most mills process washing, scarification, and drying in small batches, resulting in low switching costs and fostering regional competition.
Downstream, consolidation is accelerating as multinational food companies pursue higher margins in health-focused channels. Saco Foods' acquisition of Ancient Harvest in August 2024 provided the company with a leading quinoa brand and established distribution networks in North America, which it can utilize to expand into Asian premium retail markets. In India, Nourish You collaborated with local research institutes over two years to develop a millet-quinoa beverage line, positioning the company to scale exports as domestic processing capabilities align with growing demand. In Australia, Keen Wah leveraged a government innovation grant to introduce its Fig and Maple Quinoa Granola into national supermarket chains, highlighting the impact of public funding in expanding product availability.
Technology and regulatory compliance are shaping long-term competitive advantages in the market. Genome-wide association studies published in 2024 identified loci accounting for up to 19.2% of flowering-time variance, providing breeders with marker-assisted tools to reduce development cycles. Drone-based phenotyping trials conducted in Peru achieved yield-predictive indices exceeding 0.80, highlighting opportunities for precision agriculture services that large agribusinesses can commercialize. Olam Agri’s collaboration with 2,100 Peruvian smallholders integrates traceability software with extension support, enabling buyers to access verifiable sustainability data while securing supply chains. Additionally, regulatory measures such as Japan’s Positive List and China’s Decree 248 have increased testing and registration costs, favoring larger players with the capacity to absorb these expenses. This has resulted in moderate market concentration, with branded leaders accounting for approximately half of retail value, while raw-grain sourcing remains highly fragmented.
Market Opportunities and Future Outlook
A core opportunity in Asia-Pacific quinoa seeds is converting agronomic R&D into scalable, locally adapted supply, which can reduce exposure to import-driven price swings and improve consistency for processors and retailers. India and adjacent South Asian agro-ecologies show evidence supporting this shift: ICAR introduced quinoa trials in Arunachal Pradesh in February 2025 through the All India Co-Ordinated Research Network on Potential Crops (AICRN-PC), and peer-reviewed field work published in March 2025 laid out management combinations for semi-arid India (sowing window, irrigation, and nitrogen practices), giving growers and input suppliers a clearer path to standardize yields. In Australia, AgriFutures Australia’s Australian Quinoa Industry RD&E Plan 2024-2029 provides a roadmap centered on fit-for-purpose varieties and industry coordination, which creates space for seed multipliers, contract growers, and processors to build dependable domestic programs aligned to modern retail specifications.
Value-chain development programs also support routes to demand beyond premium metropolitan retail, especially where quinoa is positioned for food and nutrition security alongside climate resilience. Bhutan’s OCOP focus, together with the FAO technical cooperation program that began in January 2025, targets sustainable production and value chain development, which can translate into clearer aggregation, quality, and offtake mechanisms for smallholders. For commercial players, near-term opportunity clusters around (i) compliant, certified lots that can navigate tighter residue and audit regimes in markets such as China and Japan, and (ii) investments in midstream capacity (scarification, washing, drying, and lot segregation) that enable larger, specification-driven contracts for branded foods and institutional channels, including school nutrition pilots referenced in China and India.
Recent Industry Developments in Asia-Pacific Quinoa Seeds Market
- June 2026: A study in Plant Science Today reported agroclimatic suitability mapping and seasonal phenotypic evaluation of quinoa in subtropical India, highlighting high-performing accessions such as Co-407, D-12047, and BO-51. The results reinforce a breeding and seed-selection pathway for scaling cultivation beyond traditional niches, supporting more dependable raw-material planning for processors.
- March 2025: A field study published in Frontiers in Plant Science detailed crop management practices for quinoa in shallow basaltic semi-arid regions, linking sowing, irrigation, and nitrogen decisions to improved yield and water productivity outcomes. The work strengthens the technical basis for extension packages and input programs that reduce yield variability in new Indian production belts.
- May 2024: Bhutan officially launched the One Country One Priority Product (OCOP) initiative at the Bhutan Agrifood Trade and Investment Forum, selecting quinoa as a priority crop. The program-level focus supports coordinated seed distribution, cultivation support, and market linkage activities that help move quinoa from trial-stage adoption toward a more organized domestic value chain.
Asia-Pacific Quinoa Seeds Market Report Scope and Research Methodology
Market Definition and Coverage
For this study, the market is defined as the value generated from quinoa seeds sold for planting and for food use across Asia-Pacific, counted at the first point of commercial sale and reported in USD.
Scope exclusions: We exclude packaged quinoa-based foods (such as ready-to-eat meals) and value added processing margins that sit beyond the seed or grain sale.
Segments Covered in This Report
- By Geography
- Asia-Pacific
- China
- Production Analysis (Area Harvested, Yield, and Production Volume)
- Consumption Analysis (Consumption Value and Volume)
- Import Market Analysis (Import Value, Volume, and Key Supplying Markets)
- Export Market Analysis (Export Value, Volume, and Key Destination Markets)
- Wholesale Price Trend Analysis and Forecast
- Regulatory Framework
- List of Key Players
- Logistics and Infrastructure
- Seasonality Analysis
- Japan
- Production Analysis (Area Harvested, Yield, and Production Volume)
- Consumption Analysis (Consumption Value and Volume)
- Import Market Analysis (Import Value, Volume, and Key Supplying Markets)
- Export Market Analysis (Export Value, Volume, and Key Destination Markets)
- Wholesale Price Trend Analysis and Forecast
- Regulatory Framework
- List of Key Players
- Logistics and Infrastructure
- Seasonality Analysis
- Australia
- Production Analysis (Area Harvested, Yield, and Production Volume)
- Consumption Analysis (Consumption Value and Volume)
- Import Market Analysis (Import Value, Volume, and Key Supplying Markets)
- Export Market Analysis (Export Value, Volume, and Key Destination Markets)
- Wholesale Price Trend Analysis and Forecast
- Regulatory Framework
- List of Key Players
- Logistics and Infrastructure
- Seasonality Analysis
- India
- Production Analysis (Area Harvested, Yield, and Production Volume)
- Consumption Analysis (Consumption Value and Volume)
- Import Market Analysis (Import Value, Volume, and Key Supplying Markets)
- Export Market Analysis (Export Value, Volume, and Key Destination Markets)
- Wholesale Price Trend Analysis and Forecast
- Regulatory Framework
- List of Key Players
- Logistics and Infrastructure
- Seasonality Analysis
- China
- Asia-Pacific
Data Sources, Market Sizing, and Validation
Desk Research
Desk research was used to set the factual base for the model, especially on production, trade, and price signals that can be checked year to year. We relied on public agriculture and trade statistics such as FAOSTAT, UN Comtrade, national agriculture ministries and statistical offices in Asia-Pacific, and customs or port updates where available. For price context, we also reviewed wholesale or reference price notes from official agriculture market bulletins and reputed press coverage of supply disruptions.
To connect the numbers to real market behavior, we screened company filings, investor presentations, and association websites to understand how quinoa is positioned in the region, along with common pack sizes and channel practices. A paid subscription that tracks company financials and corporate actions was used selectively to validate scale for key participants. Where feasible, an import and export shipment-level database was used to reconcile trade movements with reported country totals. The sources listed above are illustrative, and many other public and paid references were also consulted for data collection, validation, and clarification.
Primary Interviews and Surveys
Interviews and surveys with Asia-Pacific seed producers, importers, distributors, food manufacturers, agronomists, and managers help clarify seed-for-sowing demand, channel margins, and price movement where public records are limited. Their input is used to test secondary data and compare regional model assumptions before sign-off.
Distribution of primary research fieldwork respondents
| Company type | Respondent position |
|---|---|
| Top tier: 28% | CXOs: 20% |
| Mid tier: 47% | Functional/Unit leaders: 33% |
| Smaller Players: 25% | Managers: 47% |
Market-Sizing & Forecasting
The core sizing is built using a top-down reconstruction that starts from country-level production, import, and export flows, which are then translated into an apparent consumption pool for quinoa seeds in the region. Once that pool is formed, pricing layers are applied using a blend of observed wholesale price trends and interview-validated markups so value can be estimated consistently in USD.
To keep the model grounded, we used a small set of practical inputs that can be refreshed every year, such as area harvested and yield movements, import dependence by country, wholesale price direction, exchange rate timing for trade-linked pricing, and shifts in demand tied to gluten-free and plant-based diet adoption. The totals were then corroborated through selective bottom-up checks, mainly by sampling supplier volumes and using typical ASP times volume math in key markets, followed by adjustments when those checks exposed gaps. Where company-level volumes were not available, the missing portion was handled through trade channel proxies and calibrated using the mix of imported versus domestically sourced quinoa described by respondents.
For forecasting, scenario analysis was used so the outlook could reflect realistic swings in harvest outcomes, trade availability, and price softness or firmness, instead of forcing one straight-line path. The scenario weights were aligned to consensus views from interviews, and the final trajectory was reviewed against recent price behavior and trade momentum before lock-in.
Data Validation & Update Cycle
Validation was done through triangulation across production and trade totals, price signals, and interview feedback, and then by running variance checks at country level so any outlier shifts were flagged early. When a country result moved beyond what harvest, trade, or price data could explain, assumptions were reworked and the relevant respondents were contacted again for a quick re-check.
Before sign-off, the model goes through a multi-step analyst review that checks arithmetic, unit consistency, currency conversions, and whether assumptions match the written scope. Reports are refreshed annually, and interim updates are made when there are material events such as major policy changes, sharp price moves, or trade disruptions. Right before delivery, a fresh review pass is completed so clients receive the latest updated view available at that time.
Mordor Intelligence's Asia Pacific Quinoa Seeds Market Size Versus Other Published Estimates
Published market numbers for quinoa seeds in Asia-Pacific can look far apart because the scope and counting point are not always the same, and because some studies lean heavily on limited trade signals without checking domestic flows. Differences also show up when one publisher reports a smaller country set, or when processed quinoa food value is blended into what is described as a seeds market.
The main gap drivers in this market are whether the estimate is built from a production plus net trade consumption pool, how wholesale prices are converted into market value, and how currency timing is handled when imports are large. Some estimates also use longer forecast horizons and apply a single CAGR, which can miss the effect of harvest variability and short-term price corrections. By keeping the count tied to seeds and grain sales and then rechecking assumptions with importers and large buyers, the spread is narrowed in a way aligned with Mordor Intelligence.
Benchmark comparison
| Source | Market Size | Gaps in Research Methodology |
|---|---|---|
| Mordor Intelligence | USD 1.50 B (2025) | |
| Industry Data Portal A | USD 0.27 B (2025) | Uses a narrower value capture that appears closer to traded quinoa only and applies a simplified price ladder, which can undercount domestic volumes and channel value in larger APAC markets. |
| Global Consultancy B | USD 0.87 B (2024) | Publishes a global total and does not provide an APAC-specific build, so the regional number is typically inferred using broad regional splits and a single CAGR, which can miss APAC import dependence and year-to-year price swings. |
The comparison shows that the widest differences come from what is counted as seed value versus adjacent product value, and whether domestic supply and trade flows are reconciled in the same model. Our approach stays repeatable because each key input can be traced to a country signal, a price check, and a primary validation step, and then carried forward with clear scenario logic.
Key Questions Answered in the Report
What is the current value of the Asia-Pacific quinoa seed market?
The market stands at USD 1.61 billion in 2026 and is forecast to reach USD 2.30 billion by 2031.
Which country holds the largest share of Asia-Pacific quinoa demand?
China leads with 41% share, supported by extensive provincial cultivation and over 100 processors.
Why is India considered the fastest-growing geography for quinoa?
Government seed programs, expanding e-commerce, and clean-label product launches underpin a 12% CAGR through 2031.
What agronomic breakthrough is accelerating quinoa adoption in Australia?
The release of the Kruso White variety, delivering profitable yields under rain-fed conditions, has doubled gross margins compared with wheat and canola rotations.