
Market Overview
| Study Period | 2021 - 2031 |
|---|---|
| Forecast Data Period | 2026 - 2031 |
| Base Year Market Size (2025) | USD 43.06 Billion |
| Market Size (2026) | USD 44.84 Billion |
| Market Size (2031) | USD 55.21 Billion |
| Growth Rate (2026 - 2031) | 4.25 % |
| Market Concentration | Medium |
Major Players *Disclaimer: Major Players sorted in no particular order Image © Mordor Intelligence. Reuse requires attribution under CC BY 4.0. | |
Asia-Pacific Food Additives Market Analysis by Mordor Intelligence
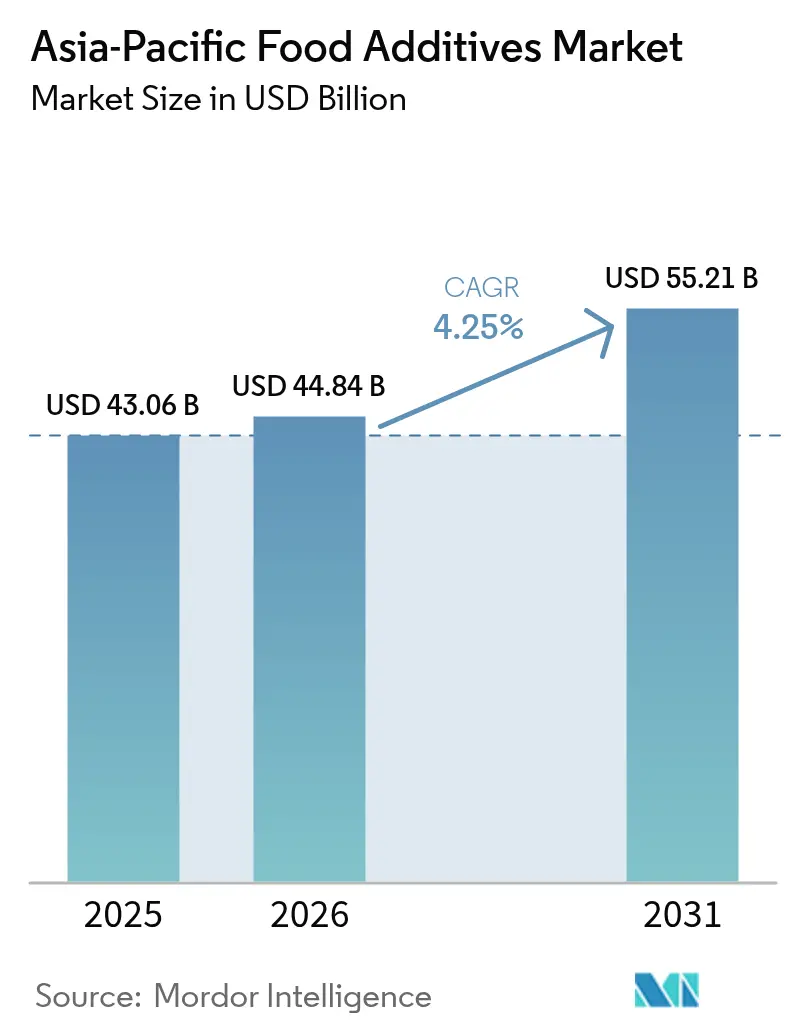
The Asia-Pacific food additive market size is expected to grow from USD 43.06 billion in 2025 to USD 44.84 billion in 2026 and is forecast to reach USD 55.21 billion by 2031 at 4.25% CAGR over 2026-2031. Continued urbanization, expanding packaged-food penetration, and tightening regulatory rules that now reward plant-based options rather than synthetic shortcuts are reshaping the competitive field. Clean-label preferences are no longer limited to premium tiers, and regional manufacturers are re-engineering entire product lines to meet export standards set by the United States and the European Union. National rule changes, such as China’s GB 2760-2024 and India’s anthocyanin expansion, accelerate demand for naturally sourced colors, preservatives, and texturizers while placing cost pressure on synthetic incumbents. Multinationals have responded with localized research and development hubs that shorten formulation cycles from months to weeks, illustrating how speed now outranks scale in winning contracts. At the same time, price volatility for stevia leaves and cochineal beetles underscores how weather swings in two continents can ripple through Asia-Pacific production schedules, forcing buyers to hedge inventories and diversify supply routes.
Key Report Takeaways
- By product type, bulk sweeteners captured 55.21% of the Asia-Pacific food additive market share in 2025, while food colorants are forecast to expand at 5.74% CAGR through 2031, the highest among product categories
- By form, dry formats commanded 64.38% of the Asia-Pacific food additive market size in 2025, yet liquid formats represent the fastest trajectory with 6.05% CAGR for 2026-2031
- By source, synthetic ingredients held 66.59% revenue share in 2025, but natural-origin additives are projected to advance at 5.83% CAGR between 2026 and 2031.
- By application, Bakery and confectionery led demand with 31.28% in 2025, whereas dairy and desserts are on track for the quickest rise at 5.58% CAGR to 2031.
- By geography, China generated 41.96% of the 2025 value, yet India is set to post the strongest country growth at 6.08% CAGR.
Note: Market size and forecast figures in this report are generated using Mordor Intelligence’s proprietary estimation framework, updated with the latest available data and insights as of 2026.
Market Trends and Insights
Drivers Impact Analysis of Asia-Pacific Food Additives Market*
| Driver | (~) % Impact on CAGR Forecast | Geographic Relevance | Impact Timeline |
|---|---|---|---|
| Growth of Convenience and Processed Foods | +0.8% | China, India, Indonesia, Thailand; urban centers driving packaged food penetration | Medium term (2-4 years) |
| Rising Preference for Natural and Organic Additives | +0.6% | Japan, Australia, Singapore, South Korea; premium segments in tier-1 Chinese and Indian cities | Long term (≥ 4 years) |
| Proliferation of Clean-Label and Plant-Based Additive Options | +0.7% | Global APAC; export-oriented manufacturers in Thailand, Vietnam, China adapting to EU/US clean-label requirements | Medium term (2-4 years) |
| Changing Consumer Taste Profiles and Demand for Diverse Flavors | +0.4% | Urban China, India, Southeast Asia; fusion cuisine and international flavor adoption | Short term (≤ 2 years) |
| Emerging Applications in Bakery, Confectionery, and Dairy | +0.5% | India, China, Indonesia; bakery fortification and plant-based dairy expansion | Medium term (2-4 years) |
| Cultural Influences Shaping Additive Choices | +0.3% | Regional; halal certification in Indonesia/Malaysia, traditional ingredient preferences in Japan/Korea | Long term (≥ 4 years) |
| Source: Mordor Intelligence | |||
Growth of Convenience and Processed Foods
As urbanization accelerates in tier-2 and tier-3 cities across Asia, meal preparation times are shrinking. This trend is driving increased demand for shelf-stable products that depend on preservatives, emulsifiers, and texture modifiers. In 2025, India's packaged food sector recorded an 11.2% growth, with ready-to-eat meals and bakery products contributing 38% of the additional volume, according to the Ministry of Food Processing Industries. This growth is not merely a reflection of Western convenience trends but highlights infrastructure limitations. Outside major metro areas, cold-chain distribution remains economically unviable, prompting manufacturers to adopt chemical and natural preservation techniques that extend shelf life to 180-270 days. In Indonesia, the 2025 revision of SNI 01-0222 standards permitted the use of potassium sorbate in traditional snacks, which were previously limited to salt-based preservation methods. This regulatory change unlocked a USD 120 million market opportunity for preservative suppliers in the country. The shift acknowledges the reality that many informal food vendors lack refrigeration, making microbial safety a critical public health priority that often outweighs the emphasis on clean-label products.
Rising Preference for Natural and Organic Additives
Consumer preference for "natural" claims is driving a division in the additive market between commodity synthetic ingredients and high-margin botanical extracts. A 2025 survey conducted by Japan's Ministry of Agriculture, Forestry and Fisheries showed that 67% of respondents avoided synthetic colorants, up from 52% in 2022[1]. However, only 31% could accurately identify natural alternatives on ingredient labels. This lack of awareness creates opportunities for suppliers to focus on consumer education, while also exposing brands to greenwashing risks, particularly when "natural flavors" are produced through microbial fermentation rather than direct plant extraction. In 2024, DSM-Firmenich launched a fermentation-derived vanillin at a 40% cost parity with synthetic vanillin, marking a significant milestone where biotechnology delivers clean-label solutions at competitive prices. Additionally, in 2025, Australia's FSANZ approved eight new natural colorants, including purple sweet potato anthocyanin and safflower yellow, expanding options for manufacturers transitioning away from Tartrazine and Sunset Yellow.
Proliferation of Clean-Label and Plant-Based Additive Options
Export-oriented food manufacturers in Thailand and Vietnam face a dual mandate: satisfy domestic price sensitivity while meeting EU and U.S. clean-label requirements that prohibit or restrict synthetic additives. Thailand's CP Kelco subsidiary expanded pectin production capacity by 18,000 metric tons in March 2025, targeting European jam and dairy manufacturers who replaced modified starch with citrus-derived hydrocolloids to achieve "no artificial ingredients" claims. The strategic calculus hinges on whether premium pricing in export markets offsets the 22-35% cost penalty of natural additives versus synthetic equivalents. Plant-based meat and dairy alternatives amplify this trend, as pea protein and oat bases require specialized emulsifiers and flavor masking agents that traditional dairy formulations do not. Ingredion's 2025 introduction of HOMECRAFT Create 8351, a tapioca-based texturizer for plant-based yogurt, addresses the persistent challenge of syneresis and grainy mouthfeel that plagued first-generation products.
Emerging Applications in Bakery, Confectionery, and Dairy
Fortification mandates and functional food trends are transforming bakery and dairy from commodity categories into delivery vehicles for vitamins, minerals, probiotics, and bioactive compounds that require stabilization and masking technologies. India's Food Safety and Standards Authority mandated iron and folic acid fortification in packaged bread and biscuits sold through government distribution channels in April 2025, creating immediate demand for microencapsulated minerals that prevent rancidity and color changes. Novozymes' 2024 launch of Lipopan® F BG enzyme for bakery applications enables manufacturers to reduce fat content by 15-20% while maintaining crumb softness, addressing cardiovascular health concerns without sacrificing sensory appeal. The enzyme catalyzes lipid restructuring during baking, a mechanism that synthetic emulsifiers cannot replicate. Probiotic dairy products in China grew 14.3% in 2025, yet maintaining viable bacterial counts through 90-day ambient shelf life requires microencapsulation technologies that cost USD 8-12 per kilogram, limiting adoption to premium tiers, according to the China Dairy Industry Association[2].
Restraints Impact Analysis of Asia-Pacific Food Additives Market*
| Restraints | (~)% Impact on CAGR Forecasts | Geographic Relevance | Impact Timeline |
|---|---|---|---|
| Stringent and Complex Regulatory Compliance | -0.5% | China, Japan, South Korea, Singapore; fragmented approval timelines across ASEAN | Long term (≥ 4 years) |
| Limited Availability of Clean-Label Raw Materials | -0.4% | India, Southeast Asia; supply chain concentration in South America and Europe for natural extracts | Medium term (2-4 years) |
| Lack of Consumer Education About Additive Benefits | -0.2% | Tier-2/3 cities in India, Indonesia, China; rural areas with limited digital access | Medium term (2-4 years) |
| Complexity in Integrating New Additives Into Existing Products | -0.2% | Small and medium manufacturers across APAC; technical resource constraints | Short term (≤ 2 years) |
| Source: Mordor Intelligence | |||
Stringent and Complex Regulatory Compliance
Regulatory fragmentation across the Asia-Pacific region creates non-tariff barriers that favor established players with dedicated compliance teams, putting agile innovators at a disadvantage. China's GB 2760-2024 standard, which will take effect in February 2026, requires toxicological dossiers for any additive exceeding 90% purity. This threshold, set by the National Health Commission of China, excludes many botanical extracts containing co-extracted phytochemicals. Consequently, suppliers must either invest in expensive purification processes to meet Chinese standards or maintain lower-purity formulations for other markets, disrupting production runs and reducing scale economies[3]. In Japan, the Food Safety Commission enforces a 24-month evaluation period for novel additives, during which applicants are prohibited from marketing the ingredient, even in limited pilot quantities. This policy creates a first-mover disadvantage, discouraging R&D investments. South Korea's Ministry of Food and Drug Safety implemented a post-market surveillance requirement in January 2025, mandating quarterly adverse-event reporting for any additive used in products with annual sales exceeding KRW 50 billion (USD 37 million). This regulation adds compliance costs, disproportionately impacting high-volume commodity ingredients.
Limited Availability of Clean-Label Raw Materials
Natural additive supply chains exhibit concentration risk, with 68% of global stevia leaf production originating from China and Paraguay, and 54% of natural red colorants derived from Peruvian cochineal beetles, according to 2025 trade data. Weather volatility in these regions translates to price swings that erode margin predictability for food manufacturers operating on thin net margins. India's dependence on imported natural colorants intensified in 2025 when domestic turmeric and beetroot harvests fell 18% due to erratic monsoons, forcing manufacturers to source from European suppliers at 35-40% price premiums. Organic certification adds another layer of constraint, as only 12% of stevia farms in China held organic credentials in 2025, limiting supply for premium applications. Fermentation-derived natural additives, while promising, face scaling challenges; IFF's 2025 attempt to commercialize fermentation-based saffron flavor encountered yield variability that kept production costs 3-4 times higher than synthetic alternatives.
*Our forecasts treat driver/restraint impacts as directional, not additive. The impact forecasts reflect baseline growth, mix effects, and variable interactions.
Asia-Pacific Food Additives Market Segment Analysis
By Product Type:
Sweetener Dominance Meets Colorant InnovationIn 2025, bulk sweeteners led the market with 55.21% revenue share, driven by ASEAN sugar-reduction mandates and reformulations by global beverage brands. Thailand's 2024 sugar tax expansion boosted high-intensity sweeteners like sucralose and acesulfame-K. Food colorants are projected to grow at a 5.74% CAGR through 2031 as manufacturers shift to natural dyes, driven by clean-label trends and the U.S. FDA's 2026 guidance discouraging "artificial color" terminology. Sugar substitutes like stevia and monk fruit are gaining traction in premium segments but face adoption barriers due to bitter aftertaste and metallic notes.
Emulsifiers are critical in plant-based dairy and meat alternatives, with sunflower and rapeseed lecithin replacing soy due to allergen concerns. Anti-caking agents like silicon dioxide and calcium silicate show stable growth in powdered soups and seasonings. Enzymes, such as amylases and proteases, are gaining popularity for reducing chemical additives in dough conditioning and protein hydrolysis. Hydrocolloids like xanthan gum and guar gum enhance texture in low-fat formulations, though carrageenan faces regulatory scrutiny. Acidulants like citric and lactic acid aid in pH control and preservation, with Corbion expanding lactic acid production in Thailand by 25,000 metric tons annually in 2025.


By Form:
Liquid Formats Gain Traction in Beverage ApplicationsIn 2025, dry additives accounted for 64.38% of the market share, driven by their cost advantages in transportation, storage, and precise dosing, especially for bakery and confectionery applications requiring strict moisture control. In Asia-Pacific, powdered emulsifiers, colorants, and preservatives are integral to dry mixes for instant noodles, cake mixes, and seasoning blends, which dominate the region's packaged food consumption. However, liquid additives are projected to grow at a 6.05% CAGR through 2031, surpassing dry formats by 180 basis points. Beverage manufacturers are fueling this growth by opting for pre-dissolved solutions that simplify mixing and improve batch consistency.
The adoption of liquid formats varies by region. Japan and South Korea, with advanced beverage industries and high labor costs, adopted liquid additives earlier to automate dosing and reduce manual handling. In contrast, India and Indonesia, where labor is inexpensive and dry-mix products dominate, are slower to adopt liquid formats. Liquid preservatives, including potassium sorbate and sodium benzoate solutions, are gaining traction in sauces and dressings, ensuring uniform distribution critical for microbial safety. This segmentation highlights an industry-wide challenge: balancing cost efficiency with operational convenience. Liquid formats, despite their advantages, carry a 15-25% price premium, limiting their use to high-margin categories.
By Source:
Natural Additives Accelerate Despite Cost PenaltiesIn 2025, synthetic additives accounted for 66.59% of market revenue, driven by cost efficiency, regulatory familiarity, and consistent performance—advantages natural alternatives have yet to match. Petroleum-based colorants, chemically synthesized preservatives, and enzymatically modified starches deliver reliable functionality at prices 30-50% lower than botanical options. However, natural-origin additives are projected to grow at a 5.83% CAGR through 2031, supported by clean-label demands in export markets and premiumization in tier-1 cities. Advances in fermentation and extraction technologies are narrowing the cost gap. For instance, DSM-Firmenich's 2024 launch of fermentation-derived beta-carotene, priced at 60% of its synthetic counterpart, highlights how bioprocessing can achieve clean-label status affordably.
Regulatory changes are accelerating this shift. China's GB 2760-2024 standard, effective February 2026, tightened limits on 47 synthetic preservatives while fast-tracking plant-based alternatives. Similarly, India's FSSAI approved 12 new natural colorants in 2025, including purple carrot and red cabbage extracts, offering manufacturers more options to replace synthetic dyes. Natural preservatives like rosemary extract and nisin are gaining traction in premium bakery and meat products, though their limited antimicrobial range requires complex combination strategies. Stevia and monk fruit sweeteners face taste challenges, but Cargill's 2025 stevia-erythritol blend, designed to mask bitterness, marks progress toward sucrose-like taste. The market is transitioning as natural additives move beyond niche premium segments toward mainstream use, though synthetic ingredients are expected to retain a majority share through 2031 due to their cost and performance advantages.

By Application:
Dairy Alternatives Propel Fastest GrowthIn 2025, bakery and confectionery applications accounted for 31.28% of the demand, highlighting the category's reliance on additives and Asia-Pacific's role as a global hub for biscuit and bread production. Emulsifiers, enzymes, and preservatives are essential for extending shelf life, improving dough handling, and achieving desired crumb structure, particularly in products distributed in tropical climates. India's mandatory fortification of packaged bread with iron and folic acid, effective April 2025, has increased demand for microencapsulated minerals that prevent lipid oxidation and color degradation, as per FSSAI guidelines. Dairy and desserts are projected to grow at a 5.58% CAGR through 2031, driven by plant-based dairy alternatives requiring specialized emulsifiers, hydrocolloids, and flavor-masking agents. Products like oat milk, pea protein yogurt, and cashew-based ice cream demand ingredients that replicate dairy's mouthfeel, stability, and taste without animal-derived components.
Beverages, including carbonated soft drinks, juices, and functional drinks, depend on sweeteners, acidulants, and colorants for sensory appeal and shelf stability. Sugar-reduction mandates across ASEAN are driving the adoption of high-intensity sweeteners, though consumer preferences vary. Japan favors aspartame and sucralose, while India prefers natural stevia despite its bitter aftertaste. Meat and meat products use preservatives, colorants, and flavor enhancers to maintain color stability and extend refrigerated shelf life. Regulatory scrutiny of nitrites is increasing interest in natural alternatives like celery powder and cherry extract. Soups, sauces, and dressings, as high-margin applications, benefit from emulsifiers, thickeners, and preservatives, enabling an ambient shelf life of 18-24 months, critical for export-oriented manufacturers. In 2024, Kerry Group opened a Taste & Nutrition center in China to help sauce manufacturers reduce sodium while maintaining umami intensity using yeast extracts and nucleotide blends. Other sectors, including confectionery coatings, pet food, and nutritional supplements, show niche but growing demand for specialized additives.
Geography Analysis
China and India Food Additives Market
China delivered 41.96% of 2025 revenue, underpinned by yeast, amino-acid, and organic-acid clusters that operate at the global lowest cost thanks to corn and wheat proximity. GB 2760-2024 tilts approvals toward homegrown suppliers, nudging multinationals to form joint ventures rather than ship in finished additives. India, forecast at 6.08% CAGR, blends soaring packaged-food demand with chronic import dependence for enzymes and natural colors, exposing local brands to currency and freight swings. The Asia-Pacific food additive market therefore, mirrors two diverging hubs: China’s vertically integrated behemoths and India’s fast-growth yet import-leaning ecosystem.
APAC Food Additives Market
Japan prizes minimal-ingredient lists and pays 25-40% premiums for natural inputs, positioning the country as a beachhead for botanical launches that later spread regionally. Australia’s FSANZ alignment with EU rules makes it a regulatory barometer; passing there offers marketers a smoother path to Western shelves. Thailand and Indonesia serve dual roles as consumption giants and export factories, with CP Kelco’s pectin expansion and potassium sorbate adoption exemplifying government-industry alignment on additive strategy. South Korea leverages K-Food popularity to export clean-label snacks to the United States; its domestic brands follow the same recipes for consistency.
Singapore’s investment climate encourages pilot plants like ADM’s liquid color blend center, which condenses formulation and commercial scale-up within a single campus. Vietnam, Malaysia, and the Philippines round out the Rest of Asia-Pacific, each with fragmented rules but growing halal and natural-ingredient niches. Collectively these patterns ensure the Asia-Pacific food additive market stays heterogeneous, with no single regulation or trend dictating the entire region.
Regulatory Landscape
Regulation of food additives in Asia-Pacific is shaped by national positive lists and pre-market approvals that increasingly refer to Codex principles, but implementation remains fragmented across countries. In China, GB 2760-2024 takes effect in February 2026 and tightens requirements for higher-purity additives, increasing the documentation and testing burden for suppliers of botanical extracts and complex blends. India is also digitizing approvals, with FSSAI mandating its electronic Product and Claim Approval Application System (ePAAS) as a single-window interface effective June 1, 2026, changing how additive and ingredient dossiers are filed and tracked.
Regional coordination efforts are becoming more visible alongside national regimes. APEC convened food safety regulators in Shanghai in May 2026 to reduce trade frictions through standard harmonization and digital tools such as electronic certificate verification. APFRAS member countries have also been expanding shared regulatory information resources, including the CES Food Safety Regulatory Information Database agreed in May 2025. Mature regulators such as FSANZ (Australia and New Zealand) continue to operate through formal application pathways under the Food Standards Code, while agencies including the Singapore Food Agency and Japan's MHLW/FSCJ use science-based evaluations that shape how multinational suppliers plan Asia-Pacific submissions and labeling claims.
Value Chain Analysis
The Asia-Pacific food additives value chain begins with feedstocks and specialty inputs such as sugars and starches for fermentation, edible oils, citrus and fruit streams for hydrocolloids, and botanical or microbial substrates for natural colors and flavors. This is followed by primary processing through chemical synthesis, fermentation, extraction, and refining. The chain then moves into blending and application development, where suppliers adapt performance to local formats, including dry mixes for bakery and instant foods and liquid systems for beverage dosing.
Execution risk concentrates in compliance, localization, and logistics. National registration and dossier preparation can lengthen launch cycles, which pushes companies to place application labs and manufacturing closer to demand centers, including GNT Group setting up an office and application laboratory in Shanghai (June 2026) for plant-based coloring solutions and Givaudan opening a 24,000-square-metre flavor production facility in Cikarang, Indonesia (July 2026) to serve Southeast Asia. Supply resilience also depends on managing variable availability of natural raw materials and navigating import clearance and port throughput in major hubs, which encourages buyers to adopt dual sourcing and more regionalized inventories for critical additives.
Competitive Landscape
The Asia Pacific food additive market remains moderately fragmented. Global giants anchor R&D and flavor mapping, while regional specialists dominate high-volume fermentation lines at 20 to 30 percent lower cost. Kerry’s USD 75 million Zhangjiagang center trims prototype lead times to four weeks, signaling that the speed of co-creation now surpasses centralized scale. CP Kelco’s Thai pectin expansion and Corbion’s lactic acid boost in Rayong show capital flowing to Southeast Asia for proximity to fruit by-products and cane sugar supplies.
European firms control high-value niches like organic colorants and sunflower lecithin by locking in certified raw material pipelines that Asia currently lacks. DSM Firmenich’s biotech vanillin debut at 40 percent cost parity signals that fermentation could democratize formerly exotic flavors. Homegrown Chinese players still lag in natural color portfolios, but accelerated domestic approvals could close that gap by the late decade.
Start-ups using precision fermentation and AI-driven flavor prediction linger in pilot scale yet attract venture funds betting on double-digit margins once capital costs amortize. Regulatory MUSCLE increasingly shapes the playing field; firms with in-house compliance teams gain a defensible moat as rule sets grow denser. Overall, capabilities in localization, biotech scaling, and paperwork navigation will dictate Asia Pacific food additive market share shifts through 2031.
Asia-Pacific Food Additives Industry Leaders
-
Cargill, Incorporated
-
Archer Daniels Midland
-
Kerry Group
-
Tate & Lyle
-
DSM-Firmenich
- *Disclaimer: Major Players sorted in no particular order

Asia-Pacific Food Additives Market Companies Covered in this Report
- Cargill, Incorporated
- Archer Daniels Midland
- Kerry Group
- Tate & Lyle
- DSM-Firmenich
- International Flavors and Fragrances Inc.
- Novozymes A/S
- Corbion N.V.
- BASF SA
- Ingredion Inc.
- Givaudan SA
- CHR Hansen Inc.
- Sensient Technologies
- Ajinomoto Co.
- Roquette Frères
- CP Kelco
- Angel Yeast
- Fufeng Group
- Meihua Holdings
- Lonza Group
Market Opportunities and Future Outlook
Opportunities focus on helping manufacturers balance clean-label reformulation with consistent functionality and faster regulatory throughput. Regulatory digitization and harmonization efforts create room for suppliers that can package strong dossiers and standardized documentation into repeatable submission playbooks, supported by milestones such as FSSAI making ePAAS mandatory from June 1, 2026 and APEC emphasizing electronic certificate verification and other digital tools during its May 2026 Shanghai regulator convening. This favors ingredients companies and distributors that combine regulatory services with application support for preservatives, colors, and texture systems used in packaged foods and export-oriented production.
Localized capacity and application development are also becoming a practical route to win share in flavors, coatings, and natural systems, especially across China and Southeast Asia where lead times and import dependencies matter for large-volume customers. Cargill initiated an expansion of its Beijing hub in January 2026, adding new production lines for flavored powders and frozen coatings. Givaudan inaugurated a 24,000-square-metre production facility in Cikarang, Indonesia in July 2026 to produce flavor powders, reinforcing the shift toward regional manufacturing and faster customer co-creation. Parallel moves in precision fermentation and novel functional proteins also expand the adjacent opportunity set, including Novonesis signing an agreement with TurtleTree in July 2026 to manufacture and commercialize precision-fermented lactoferrin.
Recent Industry Developments in Asia-Pacific Food Additives Market
- March 2026: Cargill announced an expansion of its edible oil facility in Port Klang, Malaysia, adding a new specialty fats production line aimed at regional demand from chocolate confectionery, bakery, and dairy. The added capability supports more localized supply of tailored fat systems used for texture and stability, reducing reliance on longer import lanes for high-spec formulations.
- January 2026: Cargill announced a project to expand its production and R&D hub in Beijing, China, including two independent production lines for flavored powdered beverages and flavored frozen coatings. The investment increases local manufacturing and application capacity for fast-iterating product launches in beverages and frozen categories, where speed-to-market and consistent sensory performance drive contract wins.
- November 2024: Tate & Lyle completed the acquisition of CP Kelco for approximately USD 1.8 billion, strengthening its hydrocolloid portfolio and manufacturing footprint across pectin, carrageenan, and related specialty gelling agents relevant to Asia-Pacific. The deal broadened its toolbox for clean-label texture and stabilization solutions used in dairy alternatives, sauces, and confectionery.
Asia-Pacific Food Additives Market Report Scope and Research Methodology
Market Definition and Coverage
This market covers the value of food additives sold and used across Asia-Pacific to improve taste, texture, appearance, stability, and shelf life in foods and beverages. It includes natural and synthetic additives that are purchased as ingredients by food and beverage manufacturers.
Scope exclusions: It excludes finished packaged foods and beverages as products, and it also excludes food processing equipment and contract manufacturing services.
Segments Covered in This Report
- By Product Type
- Preservatives
- Bulk Sweeteners
- Sugar Substitutes
- Emulsifiers
- Anti-Caking Agents
- Enzymes
- Hydrocolloids
- Food Flavors and Enhancers
- Food Colorants
- Acidulants
- Others
- By Form
- Dry
- Liquid
- By Source
- Natural
- Synthetic
- By Application
- Bakery and Confectionery
- Dairy and Desserts
- Beverages
- Meat and Meat Products
- Soups, Sauces, and Dressings
- Other Applications
- By Geography
- China
- India
- Japan
- Australia
- Indonesia
- South Korea
- Thailand
- Singapore
- Rest of Asia-Pacific
Data Sources, Market Sizing, and Validation
Desk Research
Desk research was used to set the market boundary and anchor the model to observable food production and consumption activity across Asia-Pacific. We referenced public sources such as FAOSTAT for agricultural and food supply indicators, UN Comtrade for trade flows of key additive families and related inputs, and national statistics offices for processed food output and consumer price trends.
To connect additive demand with end-use manufacturing, we also reviewed sources such as Codex Alimentarius guidance and food safety regulator publications across key APAC countries, along with peer-reviewed journals that discuss additive functionality and typical use rates in specific food categories. Along with that, we checked company filings, investor presentations, association websites, and reputable business press for capacity additions, product mix signals, and pricing direction. Paid subscriptions for company financials and patent databases were used to validate supply-side changes. The sources listed here are illustrative rather than exhaustive, and additional public references were also used for collection, validation, and clarification.
Primary Interviews and Surveys
Primary research was used to validate what is actually being bought and priced in the region, especially where public data is thin at the product-family level. We engaged with manufacturers, distributors, ingredient formulators, and downstream food producers across major APAC countries so assumptions on mix shift, pass-through, and application usage could be checked and corrected against real procurement behavior.
Distribution of primary research fieldwork respondents
| Company type | Respondent position |
|---|---|
| Top tier: 39% | CXOs: 13% |
| Mid tier: 46% | Functional/Unit leaders: 43% |
| Smaller Players: 15% | Managers: 44% |
Market-Sizing & Forecasting
Sizing started from a top-down build where country-level processed food and beverage output signals were reconstructed and then translated into additive demand using practical penetration and usage-rate assumptions. Results were then corroborated with selective bottom-up approximations, such as sampled ASP times volume for key additive families, distributor channel checks, and supplier revenue splits, so totals could be adjusted when they drifted from what end markets can realistically absorb.
Key model inputs included processed food output growth by country, import and export movements for major additive categories, shifts in natural versus synthetic mix, average price progression by additive family, and application mix changes across bakery, beverages, dairy, and meat products. For the forecast, scenario analysis was used and then reviewed with expert feedback on regulatory tightening, clean-label adoption, and capacity additions, which helps keep the growth path realistic when prices and volumes move differently. Where bottom-up evidence was incomplete for smaller countries or niche additives, gaps were handled with validated proxy ratios from similar markets and then re-tested against interview-based usage checks.
Data Validation & Update Cycle
Outputs were triangulated against independent signals such as trade-linked value movement, ingredient price trends, and reported performance direction from representative suppliers and channels. When a country or additive family showed an unusual jump, it was flagged for variance review, and assumptions were re-checked with follow-up calls before internal sign-off.
Reports are refreshed annually, with interim updates triggered by material events such as major regulation changes, large capacity moves, or sharp raw material swings. Before delivery, an analyst completes a fresh pass so clients receive the latest updated view aligned to the newest public releases and field feedback.
Mordor Intelligence's Asia Pacific Food Additives Market Size Compared With Other Published Estimates
Published market sizes for APAC food additives can differ because groups often draw the inclusion lines differently, and they also choose different base years, currency timing, and price normalization methods. Gaps also show up when one estimate is built from food manufacturing demand signals, while another leans more on trade values or supplier-side reporting.
By tracking additive-family inclusion across preservatives, sweeteners, emulsifiers, enzymes, hydrocolloids, flavors and enhancers, colorants, and acidulants, and then refreshing country weights with application demand checks, Mordor Intelligence avoids mixing in adjacent nutrition ingredients and limits double counting across overlapping ingredient labels.
Benchmark comparison
| Source | Market Size | Gaps in Research Methodology |
|---|---|---|
| Mordor Intelligence | USD 43.06 B (2025) | |
| Industry Publisher A | USD 10.03 B (2024) | The reported value appears to apply a narrower included scope and a different category map, which can exclude several additive families or limit coverage to fewer countries, thereby lowering the total. |
| Data Book B | USD 39.41 B (2024) | This estimate uses a different base year and a segment list that can include functional ingredient groups like probiotics and dietary fibers, and it can also use a different price base, which shifts the final revenue number. |
The table shows that scope mapping and base-year pricing choices are the main drivers of the spread, followed by how broadly the region is covered at the country level. Keeping inputs explicit and re-checking them against observable demand signals makes the result easier to replicate and more stable for planning discussions.
Key Questions Answered in the Report
What is the projected value of the Asia-Pacific food additive market in 2031?
It is forecast to reach USD 55.21 billion by 2031.
Which product category is growing the fastest?
Natural food colorants are projected to expand at 5.74% CAGR from 2026-2031.
Why are liquid additives gaining popularity in Asia?
Ready-to-drink beverage makers choose pre-dissolved systems because they cut mixing time and improve batch uniformity.
Which country will post the strongest growth?
India shows the highest forecast CAGR at 6.08% through 2031 thanks to packaged-food uptake and fortification mandates.