Asia-Pacific Polyamide Market Size and Share
Market Overview
| Study Period | 2020 - 2031 |
|---|---|
| Forecast Data Period | 2026 - 2031 |
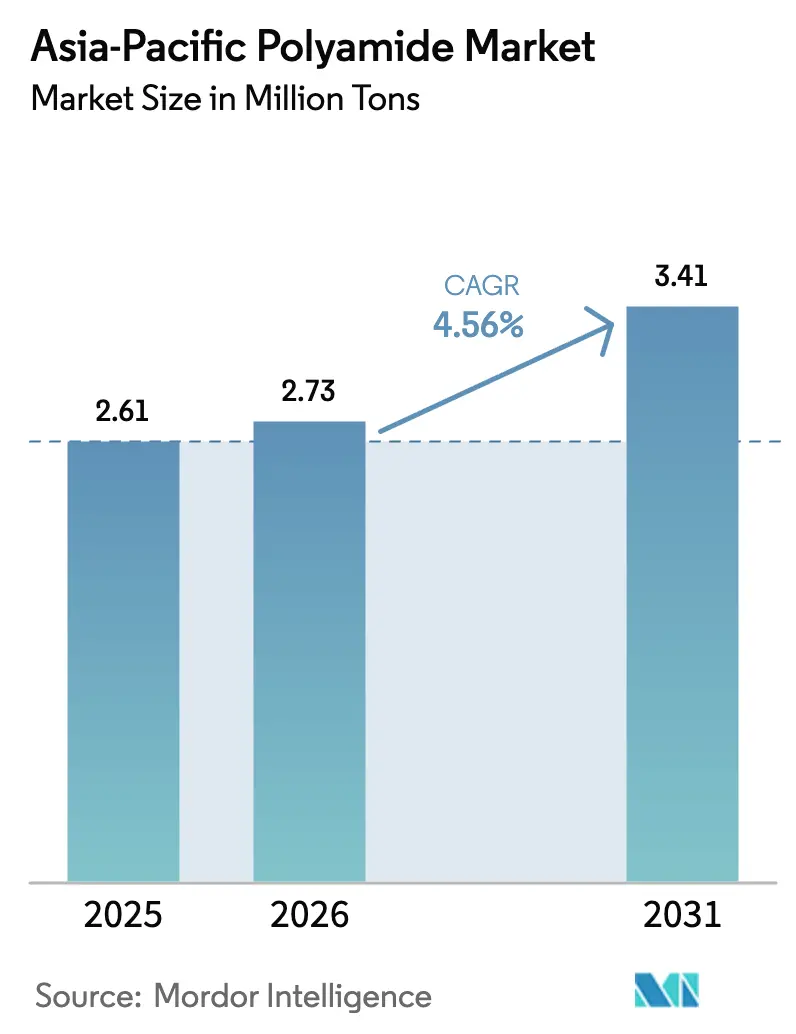
| Base Year Market Size (2025) | 2.61 Million tons |
| Market Volume (2026) | 2.73 Million tons |
| Market Volume (2031) | 3.41 Million tons |
| Growth Rate (2026 - 2031) | 4.56% CAGR |
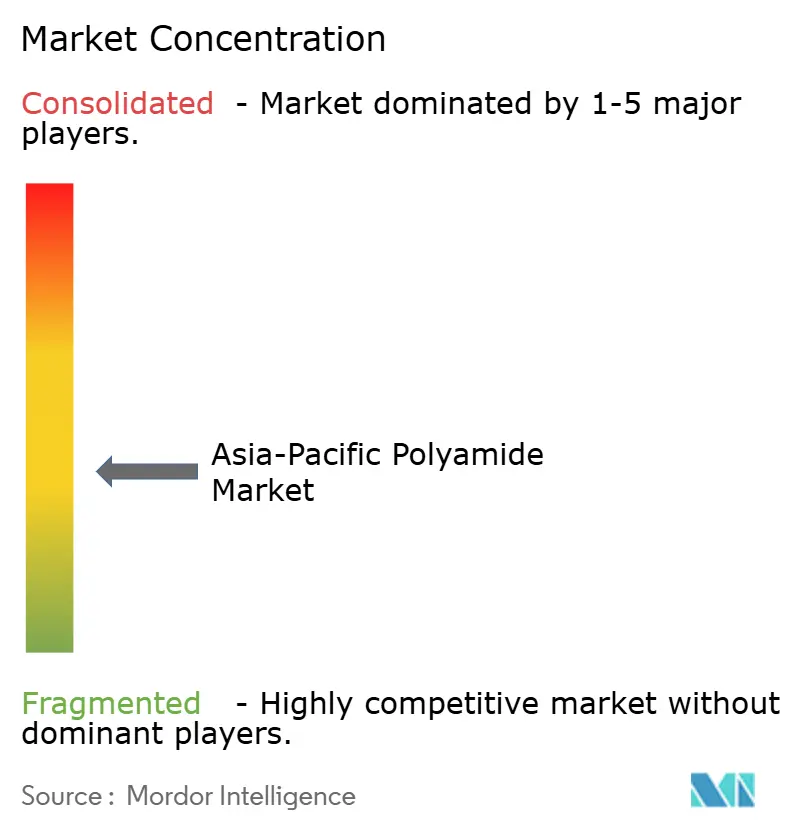
| Market Concentration | Medium |
Major Players *Disclaimer: Major Players sorted in no particular order Image © Mordor Intelligence. Reuse requires attribution under CC BY 4.0. | |
Asia-Pacific Polyamide Market Analysis by Mordor Intelligence
The Asia-Pacific Polyamide Market size was valued at 2.61 Million tons in 2025 and estimated to grow from 2.73 Million tons in 2026 to reach 3.41 Million tons by 2031, at a CAGR of 4.56% during the forecast period (2026-2031). This expansion is underpinned by sustained automotive lightweighting mandates, accelerating electric-vehicle component demand, and the region’s entrenched role as a global manufacturing hub. China’s vertically integrated supply chain continues to anchor production economics, while India’s policy-led petrochemical build-out positions it for rapid capacity additions. Specialty polyamides such as polyphthalamide and aramid fibers are capturing premium applications in EV powertrains and aerospace, lifting average selling prices even as commodity PA-6 volumes persist. Feedstock volatility remains a margin-sensitive factor, but ongoing investments in chemical recycling and bio-based routes are expected to mitigate long-term cost swings and regulatory exposure across the Asia-Pacific polyamide market
Key Report Takeaways
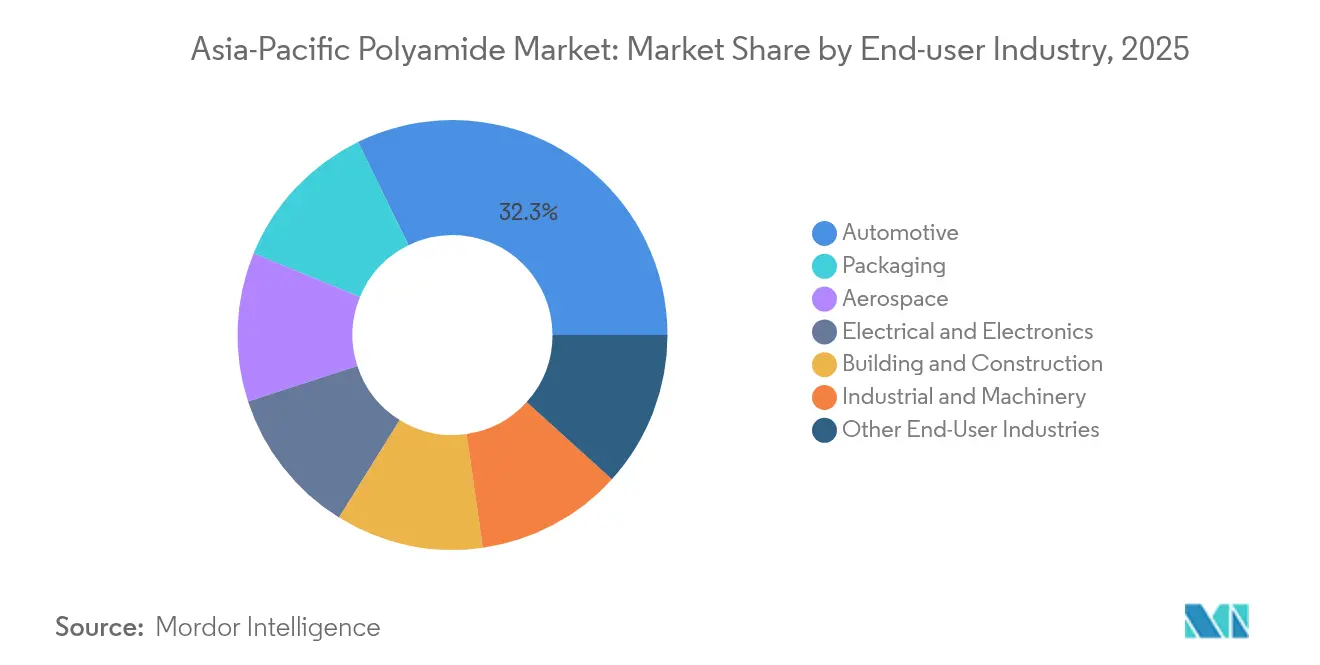
- By end-user industry, automotive accounted for 32.25% of the Asia-Pacific polyamide market size in 2025; the packaging segment is projected to expand at a 6.48% CAGR to 2031.
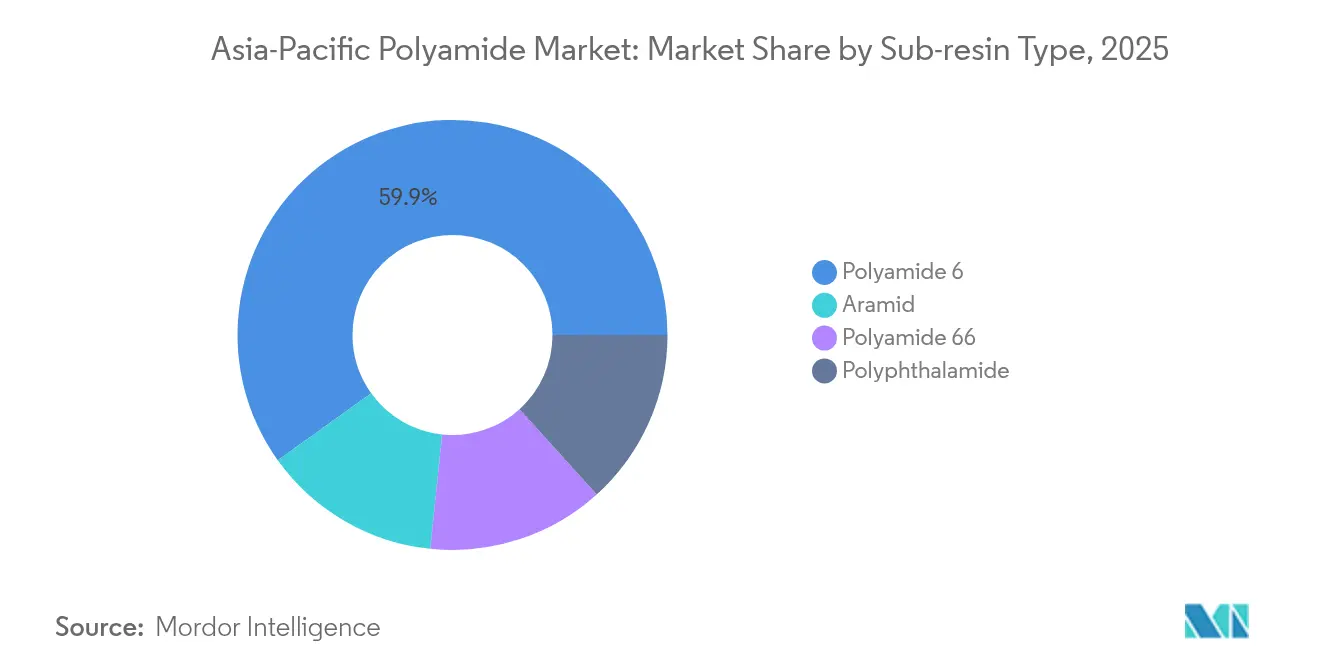
- By sub-resin type, PA-6 commanded 59.90% of Asia-Pacific polyamide market share in 2025, while aramid fibers are forecast to post the highest 5.32% CAGR through 2031.
- By geography, China held a 60.40% share of the Asia-Pacific polyamide market in 2025, whereas India is predicted to register the fastest 5.37% CAGR through 2031.
Note: Market size and forecast figures in this report are generated using Mordor Intelligence’s proprietary estimation framework, updated with the latest available data and insights as of 2026.
Asia-Pacific Polyamide Market Trends and Insights
Drivers Impact Analysis*
| Drivers | (~) % Impact on CAGR Forecast | Geographic Relevance | Impact Timeline |
|---|---|---|---|
| Lightweight-vehicle demand in automotive | +1.2% | China, India, Japan, ASEAN spillover | Medium term (2-4 years) |
| EV high-voltage wiring and e-mobility parts | +0.9% | China, South Korea, Japan | Short term (≤ 2 years) |
| Electronics manufacturing boom | +0.8% | China, South Korea, Taiwan | Short term (≤ 2 years) |
| Sportswear and industrial yarn uptake | +0.5% | China, India, Vietnam | Medium term (2-4 years) |
| Government incentives for local PA capacity | +0.7% | India, Malaysia, Thailand | Long term (≥ 4 years) |
| Source: Mordor Intelligence | |||


Lightweight-Vehicle Demand Drives Automotive Transformation
Rising fuel-efficiency and emissions targets across Asia are compelling automakers to remove 20-30% of vehicle mass, spurring higher loadings of glass-fiber reinforced PA-66 in structural parts. China’s mandate for 40% EV sales by 2030 is accelerating polyamide demand in battery casings, where weight reduction directly extends range[1]Wall Street Journal, “China EV Mandate Drives Lightweight Materials Demand,” WSJ.COM. Japanese OEMs increasingly specify heat-resistant grades for under-hood manifolds, replacing metal while withstand thermal cycling. Tier-1 suppliers are broadening material qualification lists to include post-consumer recycled PA-6, incentivized by OEM sustainability scorecards. Continuous-fiber composite inserts molded with PA-6 are also emerging in seat frame applications, expanding the Asia-Pacific polyamide market beyond powertrain parts. Tooling innovations that combine metal stamping with in-situ polymer over-molding further reinforce penetration into structural categories.
EV High-Voltage Wiring Accelerates Specialty Polyamide Adoption
The shift to 800 V battery architectures demands connector housings and cable sheathing that endure elevated temperatures and aggressive electrolytes. South Korean cell and module producers now specify polyphthalamide blends offering CTI values above 600 V, a performance threshold that conventional PA-6 cannot reach. Price premiums of 40-60% are being absorbed by OEMs because downtime penalties outweigh material costs. China’s wire-harness suppliers have responded by adding twin-screw compounding lines for halogen-free flame-retardant PPA, shortening regional lead times from 16 to 10 weeks. Material makers report double-digit gains in PPA throughput, pushing the Asia-Pacific polyamide market toward higher-margin mixes. Certification cycles with European automakers are also shortening as joint testing protocols align under the UN R155 cybersecurity and R156 software update regulations, favoring suppliers with robust digital material passports.
Electronics Manufacturing Boom Sustains High-Performance Demand
High-flow PA-6T and PA-9T maintain mechanical integrity at these scales, enabling advanced semiconductor packaging. Taiwanese OSAT (outsourced semiconductor assembly and test) firms now routinely qualify low-outgassing PA formulations to protect photolithography yields. In South Korea, memory fabs specify polyamide trays resistant to 200 °C reflow cycles, boosting demand for semi-aromatic grades. Supply contracts increasingly include cradle-to-gate carbon footprints, elevating recycled PA-6 adoption despite limited collection infrastructure. These trends reinforce the electronics segment as a strategic pillar of the Asia-Pacific polyamide market.
Sportswear and Industrial Yarn Uptake in Technical Textiles
Technical textile output across Vietnam, Bangladesh, and India is advancing at double-digit rates, pulling high-tenacity PA-66 fiber into airbags, industrial belts, and filtration media. Leading spinners are retrofitting melt-spinning lines for bio-based PA-66 chips to meet brand owner targets for 25% renewable content by 2028. In sportswear, seamless knitting technology enables moisture-management fabrics using micro-denier PA filaments blended with elastane, enhancing drape without sacrificing abrasion resistance. Renewable-energy rebate schemes in Vietnam cut OPEX for yarn mills, improving cost competitiveness against polyester. Industrial filtration demand tied to battery material processing is also upscaling tow sizes, cementing yarns as a high-growth vector within the Asia-Pacific polyamide market.
Restraints Impact Analysis*
| Restraints | (~) % Impact on CAGR Forecast | Geographic Relevance | Impact Timeline |
|---|---|---|---|
| Feedstock price volatility | -0.6% | China, India, global | Short term (≤ 2 years) |
| Sustainability pressure on PA-6 and PA-66 emissions | -0.4% | Export-oriented Asian producers | Medium term (2-4 years) |
| Specialty diamine shortages limiting PPA supply | -0.3% | Japan, South Korea, Taiwan | Short term (≤ 2 years) |
| Source: Mordor Intelligence | |||
Sustainability Pressure on PA-6 and PA-66 Lifecycle Emissions
The European Union’s planned carbon border adjustment mechanism (CBAM) subjects imported polymers to embedded-carbon tariffs beginning in 2026, raising compliance costs for Asian exporters. Brand owners now request cradle-to-gate footprints below 3 kg CO₂e per kg of PA-6, compelling investment in renewable-energy steam crackers and chemical recycling pilots. Japanese OEMs impose scope-3 reduction targets that favor recycled content, while Chinese producers accelerate biomass-balanced feedstocks compatible with mass-balance accounting. Certification costs and traceability requirements increase, yet early movers capture premium contracts, positioning sustainability as both a restraint and a catalyst for the Asia-Pacific polyamide market.
Specialty Diamine Shortages Constrain PPA Supply
6T diamine and other specialty monomers required for PPA remain in limited supply as purification standards intersect with semiconductor cleanliness specifications. Lead times extended to 16–20 weeks in 2024, delaying connector programs and slowing volume ramp-ups. Japanese chemical firms are debottlenecking smaller units, but long construction cycles mean tightness persists into 2026. Electronics OEMs qualify dual sourcing but face stringent re-qualification hurdles, forcing conservative material allocations. Until new units come online, the Asia-Pacific polyamide market will experience intermittent specialty grade shortages that cap near-term growth.
*Our forecasts treat driver/restraint impacts as directional, not additive. The impact forecasts reflect baseline growth, mix effects, and variable interactions.
Segment Analysis
By End-User Industry: Automotive Dominance, Packaging Upshift
Automotive applications captured 32.25% of the Asia-Pacific polyamide market size in 2025, leveraging favorable strength-to-weight properties for under-hood, fuel system, and structural uses. Lightweight targets of 5 kg per vehicle over the next model cycle sustain baseline demand. Packaging, although smaller at present, advances at a 6.48% CAGR by virtue of barrier films complying with stringent food-contact norms across Southeast Asia.
Building and construction uses face slower infrastructure cycles, yet gain traction in high-pressure pipe fittings. Aerospace, still below 5%, commands the highest margins as OEMs adopt flame-retardant, low-fume grades. The packaging surge reflects shifting consumer behavior toward single-serve and convenience formats in tropical climates where polyamide’s moisture barrier outperforms competing resins. This end-use diversification underpins the long-term resilience of the Asia-Pacific polyamide market.


By Sub-Resin Type: Strong PA-6 Base, Accelerating Specialty Blend Momentum
Polyamide 6 retained 59.90% of Asia-Pacific polyamide market share in 2025 due to entrenched supply chains and competitive cost structures in films, fibers, and engineering components. Aramid fibers, registering a 5.32% CAGR, are penetrating aerospace ducts and EV battery insulation where tensile strength and thermal stability outweigh cost premiums. Polyamide 66 is supported by glass-reinforced compounds for intake manifolds and torque mounts. Polyphthalamide remains the smallest slice but posts double-digit volume gains as miniaturization and high-temperature electronics drive demand.
Demand dynamics illustrate functional segmentation rather than simple substitution: aramid and PPA address stringent performance gaps unreached by commodity PA-6. As OEM qualification cycles lengthen, producers with robust research and development and application engineering gain pricing leverage, anchoring profitability even as commodity margins compress. This tiered evolution underscores how the Asia-Pacific polyamide market balances volume leadership with value migration to high-performance niches.
Geography Analysis
China delivered 60.40% of regional polyamide volume in 2025 on the back of vertically integrated petrochemical complexes and cost-efficient labor pools, yet annual growth is moderating toward mid-single digits as stricter environmental mandates elevate compliance costs. India emerges as the fastest-growing Asia-Pacific polyamide market at a 5.37% CAGR until 2031, driven by a USD 87 billion petrochemical capex pipeline and a flourishing automotive cluster.
Domestic resin output is set to displace imports by 2027 while unlocking re-export opportunities into the Middle East. Government PLI incentives accelerate investment in both virgin and recycled PA-6 lines, improving supply security for local converters. Japan is emphasizing aerospace- and electronics-grade compounds where tight tolerances and regulatory certifications command price inelasticity. Australia’s share is skewed to mining sectors demanding abrasion-resistant liner plates and cable ties. Southeast Asian nations and Taiwan are capitalizing on mid-stream compounding for regional electronics, apparel, and packaging players. Collectively, these shifts point to a gradual redistribution of the Asia-Pacific polyamide market as supply chains diversify and sustainability imperatives intensify.
Competitive Landscape
Competition remains moderately fragmented. BASF, DuPont, Arkema, and Toray uphold leadership via proprietary chemistries, integrated feedstocks, and localized technical centers. Shenma Industrial and Guangdong Xinhui Meida leverage cost advantages to grow in commodity niches, while investing in post-consumer recycling to meet brand owner mandates. DOMO’s 2024 TECHNYL plant in China adds 50,000 tpa of flame-retardant PA-66 for 5G base stations. Joint ventures between Japanese compounders and Indian petrochemical firms proliferate, pairing technology with local market access. Supply agreements increasingly feature take-back clauses, locking in circular feedstocks.
Asia-Pacific Polyamide Industry Leaders
Guangdong Xinhui Meida Nylon Co., Ltd.
Highsun Holding Group
Shenma Industrial Co., Ltd
Toray Industries, Inc.
UBE Corporation
- *Disclaimer: Major Players sorted in no particular order

Recent Industry Developments
- July 2025: Arkema announced an investment in a new Rilsan clear transparent polyamide unit in Singapore, increasing global Rilsan 11 capacity by 50% to meet demand for sustainable high-performance transparent materials in multiple markets.
- April 2024: DOMO opened a TECHNYL polyamide plant in China, expanding capacity to 50,000 tons annually and strengthening its position in the Asia-Pacific polyamide market.


Asia-Pacific Polyamide Market Report Scope
Aerospace, Automotive, Building and Construction, Electrical and Electronics, Industrial and Machinery, Packaging are covered as segments by End User Industry. Aramid, Polyamide (PA) 6, Polyamide (PA) 66, Polyphthalamide are covered as segments by Sub Resin Type. Australia, China, India, Japan, Malaysia, South Korea are covered as segments by Country.| Aerospace |
| Automotive |
| Building and Construction |
| Electrical and Electronics |
| Industrial and Machinery |
| Packaging |
| Other End-User Industries |
| Aramid |
| Polyamide 6 |
| Polyamide 66 |
| Polyphthalamide |
| China |
| India |
| Japan |
| Australia |
| Malaysia |
| Rest of Asia-Pacific |
| By End-user Industry | Aerospace |
| Automotive | |
| Building and Construction | |
| Electrical and Electronics | |
| Industrial and Machinery | |
| Packaging | |
| Other End-User Industries | |
| By Sub-Resin Type | Aramid |
| Polyamide 6 | |
| Polyamide 66 | |
| Polyphthalamide | |
| By Geography | China |
| India | |
| Japan | |
| Australia | |
| Malaysia | |
| Rest of Asia-Pacific |


Market Definition
- End-user Industry - Building & Construction, Packaging, Automotive, Aerospace, Industrial Machinery, Electrical & Electronics, and Others are the end-user industries considered under the polyamide market.
- Resin - Under the scope of the study, virgin polyamide resins like Polyamide 6, Polyamide 66, Polyphthalamide, and Aramid in the primary forms are considered.
| Keyword | Definition |
|---|---|
| Acetal | This is a rigid material that has a slippery surface. It can easily withstand wear and tear in abusive work environments. This polymer is used for building applications such as gears, bearings, valve components, etc. |
| Acrylic | This synthetic resin is a derivative of acrylic acid. It forms a smooth surface and is mainly used for various indoor applications. The material can also be used for outdoor applications with a special formulation. |
| Cast film | A cast film is made by depositing a layer of plastic onto a surface then solidifying and removing the film from that surface. The plastic layer can be in molten form, in a solution, or in dispersion. |
| Colorants & Pigments | Colorants & Pigments are additives used to change the color of the plastic. They can be a powder or a resin/color premix. |
| Composite material | A composite material is a material that is produced from two or more constituent materials. These constituent materials have dissimilar chemical or physical properties and are merged to create a material with properties unlike the individual elements. |
| Degree of Polymerization (DP) | The number of monomeric units in a macromolecule, polymer, or oligomer molecule is referred to as the degree of polymerization or DP. Plastics with useful physical properties often have DPs in the thousands. |
| Dispersion | To create a suspension or solution of material in another substance, fine, agglomerated solid particles of one substance are dispersed in a liquid or another substance to form a dispersion. |
| Fiberglass | Fiberglass-reinforced plastic is a material made up of glass fibers embedded in a resin matrix. These materials have high tensile and impact strength. Handrails and platforms are two examples of lightweight structural applications that use standard fiberglass. |
| Fiber-reinforced polymer (FRP) | Fiber-reinforced polymer is a composite material made of a polymer matrix reinforced with fibers. The fibers are usually glass, carbon, aramid, or basalt. |
| Flake | This is a dry, peeled-off piece, usually with an uneven surface, and is the base of cellulosic plastics. |
| Fluoropolymers | This is a fluorocarbon-based polymer with multiple carbon-fluorine bonds. It is characterized by high resistance to solvents, acids, and bases. These materials are tough yet easy to machine. Some of the popular fluoropolymers are PTFE, ETFE, PVDF, PVF, etc. |
| Kevlar | Kevlar is the commonly referred name for aramid fiber, which was initially a Dupont brand for aramid fiber. Any group of lightweight, heat-resistant, solid, synthetic, aromatic polyamide materials that are fashioned into fibers, filaments, or sheets is called aramid fiber. They are classified into Para-aramid and Meta-aramid. |
| Laminate | A structure or surface composed of sequential layers of material bonded under pressure and heat to build up to the desired shape and width. |
| Nylon | They are synthetic fiber-forming polyamides formed into yarns and monofilaments. These fibers possess excellent tensile strength, durability, and elasticity. They have high melting points and can resist chemicals and various liquids. |
| PET preform | A preform is an intermediate product that is subsequently blown into a polyethylene terephthalate (PET) bottle or a container. |
| Plastic compounding | Compounding consists of preparing plastic formulations by mixing and/or blending polymers and additives in a molten state to achieve the desired characteristics. These blends are automatically dosed with fixed setpoints usually through feeders/hoppers. |
| Plastic pellets | Plastic pellets, also known as pre-production pellets or nurdles, are the building blocks for nearly every product made of plastic. |
| Polymerization | It is a chemical reaction of several monomer molecules to form polymer chains that form stable covalent bonds. |
| Styrene Copolymers | A copolymer is a polymer derived from more than one species of monomer, and a styrene copolymer is a chain of polymers consisting of styrene and acrylate. |
| Thermoplastics | Thermoplastics are defined as polymers that become soft material when it is heated and becomes hard when it is cooled. Thermoplastics have wide-ranging properties and can be remolded and recycled without affecting their physical properties. |
| Virgin Plastic | It is a basic form of plastic that has never been used, processed, or developed. It may be considered more valuable than recycled or already used materials. |


Research Methodology
Mordor Intelligence follows a four-step methodology in all our reports.
- Step-1: Identify Key Variables: The quantifiable key variables (industry and extraneous) pertaining to the specific product segment and country are selected from a group of relevant variables & factors based on desk research & literature review; along with primary expert inputs. These variables are further confirmed through regression modeling (wherever required).
- Step-2: Build a Market Model: In order to build a robust forecasting methodology, the variables and factors identified in Step-1 are tested against available historical market numbers. Through an iterative process, the variables required for market forecast are set and the model is built on the basis of these variables.
- Step-3: Validate and Finalize: In this important step, all market numbers, variables and analyst calls are validated through an extensive network of primary research experts from the market studied. The respondents are selected across levels and functions to generate a holistic picture of the market studied.
- Step-4: Research Outputs: Syndicated Reports, Custom Consulting Assignments, Databases & Subscription Platforms


