Polymethyl Methacrylate (PMMA) Market Size and Share
Market Overview
| Study Period | 2021 - 2031 |
|---|---|
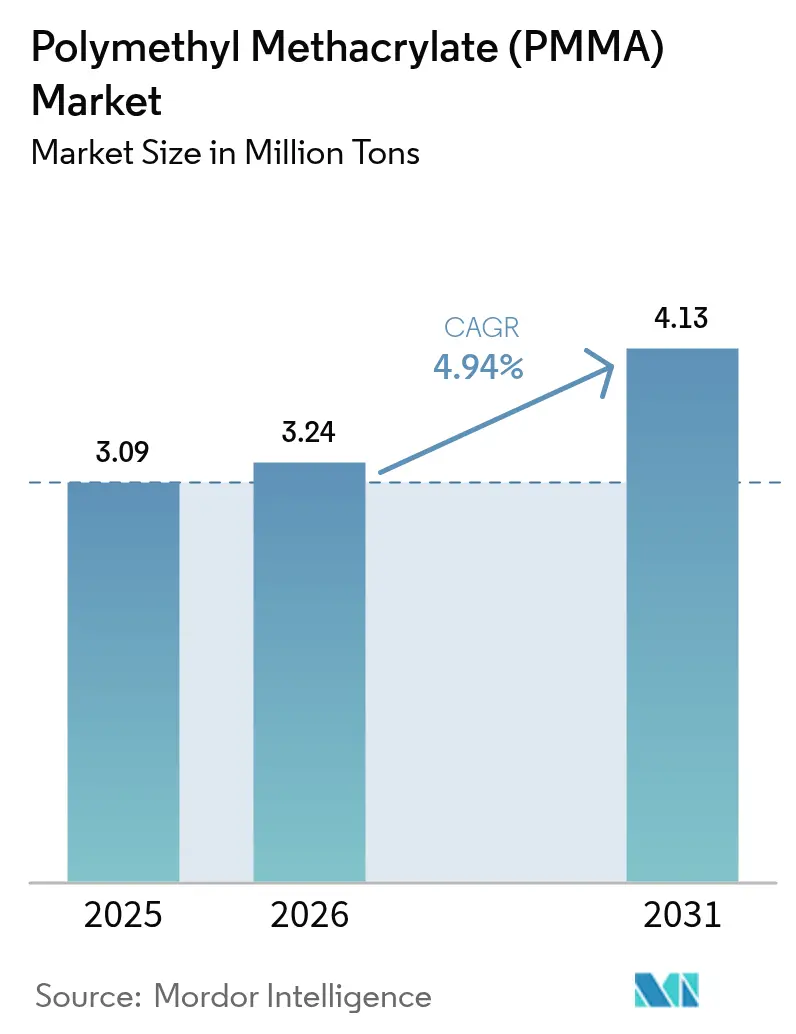
| Market Volume (2026) | 3.24 Million tons |
| Market Volume (2031) | 4.13 Million tons |
| Growth Rate (2026 - 2031) | 4.94% CAGR |
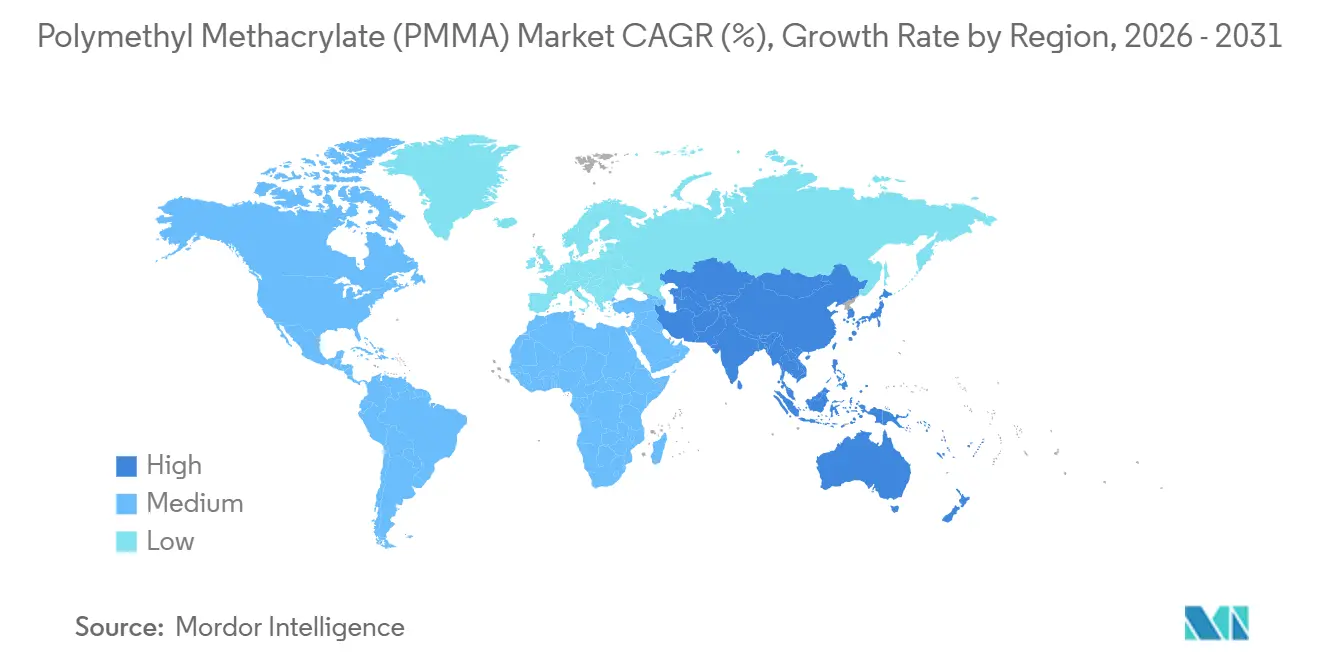
| Fastest Growing Market | Asia Pacific |
| Largest Market | Asia Pacific |
| Market Concentration | Medium |
Major Players *Disclaimer: Major Players sorted in no particular order Image © Mordor Intelligence. Reuse requires attribution under CC BY 4.0. | |
Polymethyl Methacrylate (PMMA) Market Analysis by Mordor Intelligence
The Polymethyl Methacrylate Market size is expected to grow from 3.09 million tons in 2025 to 3.24 million tons in 2026 and is forecast to reach 4.13 million tons by 2031 at a 4.94% CAGR over 2026-2031. Rising demand for circular-economy feedstocks, wider acceptance of precision-molded parts, and regulatory pushes for energy-efficient glazing are widening the application base beyond legacy thermoplastics. Commercial depolymerization units announced in 2025 have lowered the cradle-to-gate carbon footprint of virgin resin by about one-third, improving PMMA’s cost-to-sustainability position against polycarbonate. Façade retrofit programs mandated under the European Union’s Energy Performance of Buildings Directive, together with India’s massive infrastructure pipeline, are lifting architectural consumption, while aerospace certifications for composite windows are opening a high-margin outlet that buffers commodity price cycles. Competitive intensity is moderate because the top five suppliers control roughly 60% of global capacity, but technological differentiation in chemical recycling and optical-grade quality control allows specialized entrants to gain footholds in medical and electronics niches.
Key Report Takeaways
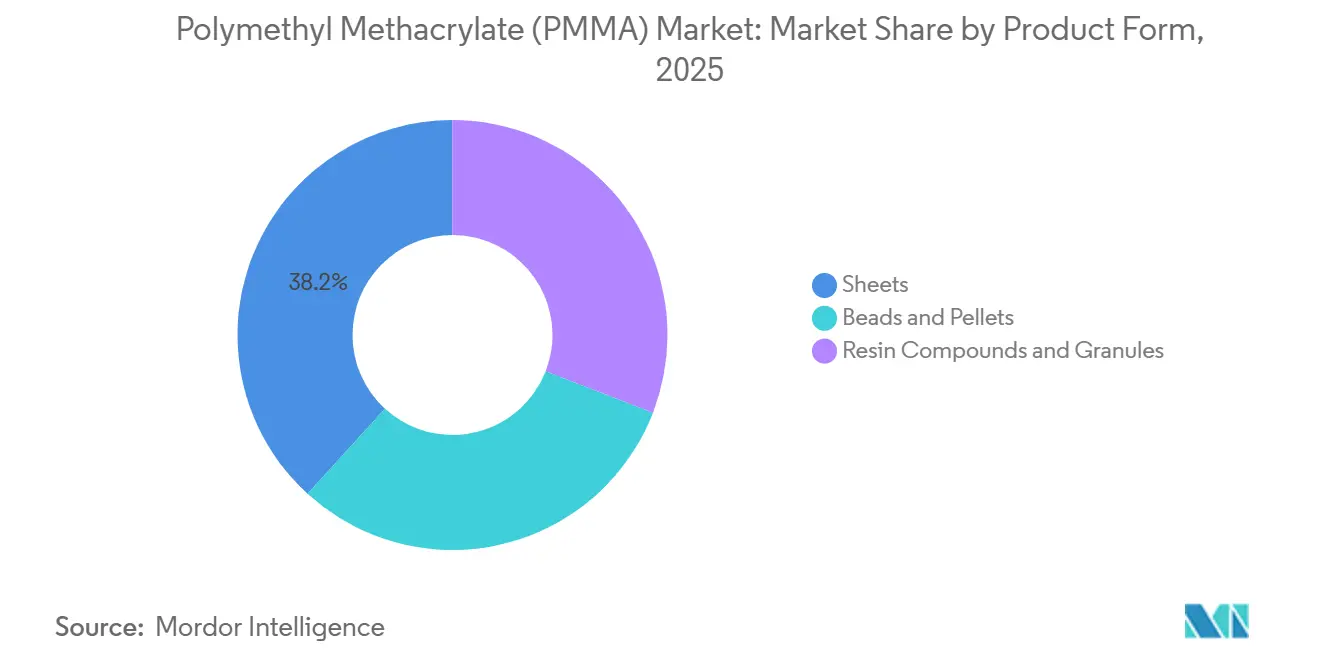
- By product form, sheets led with a 38.23% volume share of the PMMA market in 2025 and are expanding at a 5.42% CAGR through 2031.
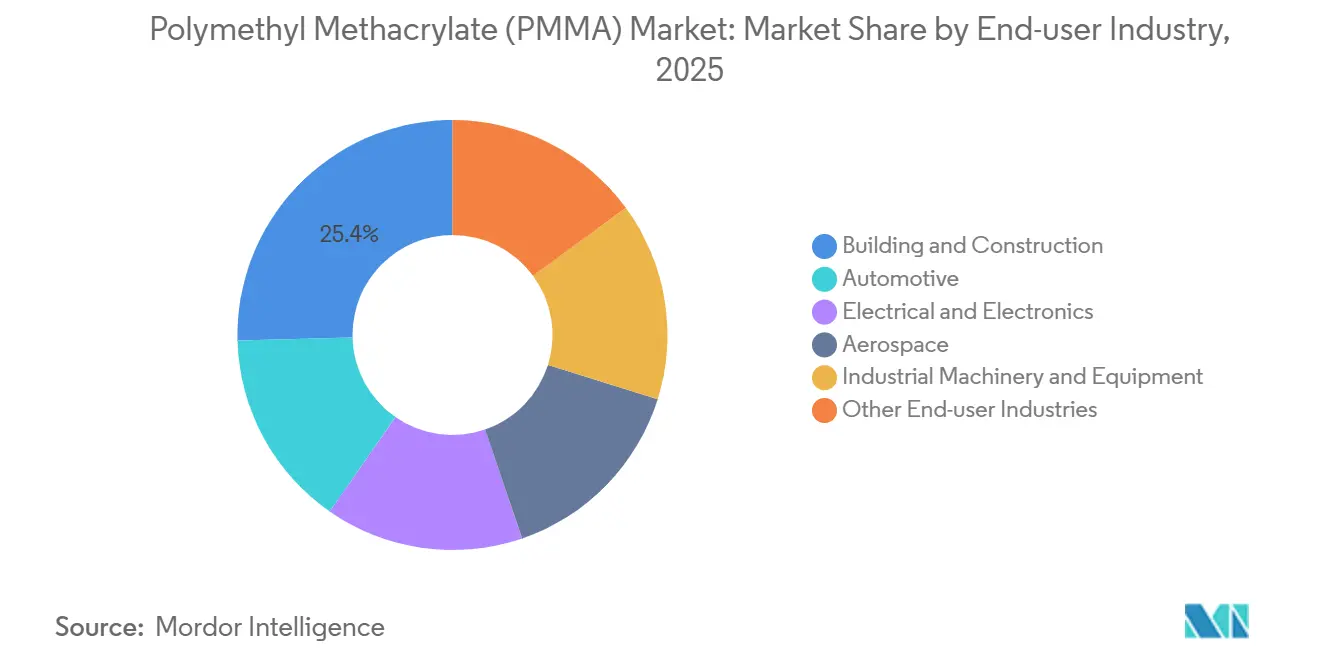
- By end-user industry, aerospace is the fastest-growing segment, advancing at a 5.58% CAGR, while building and construction retained the largest 25.42% share of the PMMA market in 2025.
- Asia-Pacific accounted for 50.33% of the PMMA market share in 2025 and is pacing regional growth at a 5.18% CAGR to 2031.
Note: Market size and forecast figures in this report are generated using Mordor Intelligence’s proprietary estimation framework, updated with the latest available data and insights as of 2026.
Global Polymethyl Methacrylate (PMMA) Market Trends and Insights
Driver Impact Analysis*
| Drivers | (~) % Impact on CAGR Forecast | Geographic Relevance | Impact Timeline |
|---|---|---|---|
| Architectural glazing and façade adoption | +1.2% | Europe, North America, APAC urban cores | Medium term (2–4 years) |
| Expansion of LED signage and display industry | +1.0% | Global, with concentration in APAC and North America | Short term (≤ 2 years) |
| Growth in medical and dental PMMA use | +0.8% | North America, Europe, Japan | Long term (≥ 4 years) |
| Breakthroughs in PMMA chemical-recycling economics | +1.3% | Europe, North America, spillover to APAC | Medium term (2–4 years) |
| AI-enabled optical-grade quality control | +0.5% | Global, early adoption in Germany, Japan, South Korea | Long term (≥ 4 years) |
| Source: Mordor Intelligence | |||
Architectural Glazing And Façade Adoption
Germany and France now require minimum office daylight factors of 2%, a level achieved by PMMA skylights and curtain walls at roughly half the weight of glass assemblies. Röhm and contractor Neero retrofitted a 12-story tower in Frankfurt and cut structural-steel tonnage by 22%, proving that lighter façades slash both material and installation costs. Seismic-zone builders benefit further because lower cladding mass reduces sway calculations. India’s Bharatmala highway network is adding 15,000-20,000 tons of transparent PMMA sound barriers each year, and Southeast Asian transport corridors in Jakarta and Manila now specify PMMA over polycarbonate to avoid tropical UV yellowing. These mandates collectively add momentum to the PMMA market.
Expansion Of LED Signage And Display Industry
Advertising agencies are shifting to high-brightness outdoor LED billboards that depend on PMMA diffuser sheets for uniform light distribution across panels larger than 10 m². Retailers in North America have already retrofitted storefront signs with edge-lit PMMA, cutting energy use by 40% while preserving brand-color fidelity[1]U.S. Department of Energy, “Solid-State Lighting Program Updates,” energy.gov. South Korea’s installation of transparent OLED passenger-information screens has created a premium niche for optically graded PMMA substrates compliant with IEC 62629 flammability limits, supporting price premiums of 25-30% over commodity sheet.
Growth In Medical And Dental PMMA Use
U.S. Food and Drug Administration 510(k) clearances for PMMA bone cements rose 12% year-over-year in 2025, driven by rising hip and knee arthroplasty volumes[2]U.S. Food and Drug Administration, “510(k) Clearances Database,” fda.gov. Dental labs have switched to milled PMMA blocks that slash fabrication time from 48 hours to below 6 hours while holding ±50 µm tolerances, improving patient turnaround. Europe and Japan allow permanent dermal fillers containing cross-linked PMMA microspheres, reinforcing long-term demand, while hydrophobic acrylic intraocular lenses still rely on PMMA precursors for clarity and biocompatibility.
Breakthroughs In PMMA Chemical-Recycling Economics
Trinseo’s 10,000-ton depolymerization unit in Rho, Italy, recovers 92%-pure methyl methacrylate monomer from post-industrial scrap, cutting feedstock costs by about EUR 200 per ton versus petrochemical routes. Röhm and NEXTCHEM plan a 50,000-ton German facility by 2027, already backed by automotive offtake agreements. ETH Zurich scientists recently demonstrated ambient-temperature photocatalytic depolymerization, suggesting future operating-cost cuts that will accelerate circular sourcing. Green-building specifiers in Scandinavia now require 15% recycled content in PMMA façade panels, reinforcing market pull.
Restraint Impact Analysis*
| Restraints | (~) % Impact on CAGR Forecast | Geographic Relevance | Impact Timeline |
|---|---|---|---|
| Substitution threat from polycarbonate and glass | -0.9% | Global, acute in automotive and electronics | Short term (≤ 2 years) |
| Stringent single-use-plastic regulation | -0.6% | Europe, North America, spillover to APAC | Medium term (2–4 years) |
| China-centric overcapacity and price dumping risk | -0.7% | APAC, Middle East, selective North American imports | Short term (≤ 2 years) |
| Source: Mordor Intelligence | |||
Substitution Threat From Polycarbonate And Glass
Polycarbonate’s 600-850 J/m Izod impact strength dwarfs PMMA’s 20-25 J/m benchmark, making it the default for side windows and drop-tested electronics housings. Tesla’s 2025 Model Y update adopted polycarbonate rear-quarter windows that shaved 1.2 kg per vehicle, a blueprint other EV makers quickly copied. Chemically strengthened glasses such as Corning Gorilla Glass are capturing instrument-cluster covers, pairing scratch resistance with luxury aesthetics. With Asian polycarbonate spot resin prices averaging USD 2,100 per ton in early 2026, only 15% above PMMA, cost parity is eroding a traditional PMMA advantage.
Stringent Single-Use-Plastic Regulation
The European Union’s Single-Use Plastics Directive has already removed about 80,000 tons of annual PMMA demand for disposable cutlery and stirrers. Extended Producer Responsibility fees of EUR 0.50-0.80 per kg on non-recycled PMMA in France and Germany have rendered single-trip packaging uneconomic. California’s SB 54 sets a 65% recycled-content rule for rigid packaging by 2032, a target outside current PMMA recycling capacity, hastening substitution toward paper and molded fiber.
*Our forecasts treat driver/restraint impacts as directional, not additive. The impact forecasts reflect baseline growth, mix effects, and variable interactions.
Segment Analysis
By Product Form: Sheets Sustain Architectural Momentum
Sheets captured a 38.23% volume share of the PMMA market in 2025, and the PMMA market size for sheets is projected to grow at a 5.42% CAGR to 2031. Continuous-cast lines benefit from façade retrofits, LED billboards, and transparent sound-barrier walls on highways in India and Southeast Asia. Röhm added 35,000 tons of sheet capacity across Worms and Shanghai in 2025 to meet that rising offtake.
Demand for beads and pellets concentrates on injection-molded headlamp lenses, medical-device housings, and electronics parts that require narrow melt-flow ranges. Specialty resin compounds occupy smaller but high-margin verticals such as denture bases and intraocular lens beads. Trinseo commercialized a bio-attributed compound with 30% renewable methanol in 2025 and began sampling to European medical OEMs seeking Scope 3 reductions without revalidation. Although smaller in tonnage, these premium forms shore up overall PMMA market profitability.


By End-User Industry: Construction Dominates, Aerospace Accelerates
Building and construction held a 25.42% share of the PMMA market in 2025 on the back of skylights, canopies, and barrier walls mandated by India’s USD 1.4 trillion National Infrastructure Pipeline. Europe’s façade-upgrade push under the Energy Performance of Buildings Directive is reinforcing that baseline volume.
Aerospace is the fastest-growing end-use, showing a 5.58% CAGR through 2031. Federal Aviation Administration Advisory Circular 25.775-1 caps optical distortion at 2 arc-minutes and specifies bird-impact criteria, limiting qualified PMMA grades to a few suppliers. PPG Aerospace secured a transparency contract for Airbus A320neo in 2025, reflecting OEM confidence in PMMA’s clarity-to-weight ratio. Electrical and electronics segments absorb PMMA for LED light guides and touch-screen overlays, where its 1.49 refractive index validates uniform illumination, reinforcing volume diversity in the overall PMMA market.
Geography Analysis
Asia-Pacific controlled 50.33% of the PMMA market share in 2025, and regional demand is growing at a 5.18% CAGR through 2031 as India and China execute infrastructure and manufacturing expansion. India’s Bharatmala highway sound-barrier rollouts and metro-station canopies alone consume 30,000-35,000 tons annually. Chinese overcapacity depresses regional prices but also underwrites low-cost sheet supply for domestic construction and electronics makers. Japan and South Korea divert capacity to medical, aerospace, and optical grades that command higher margins and insulate against commodity cycles.
North America accounted for nearly one-fifth of global volume in 2025. Röhm’s 250,000-ton Bay City MMA project, announced in 2025, aims to secure domestic resin for automotive lightweighting under Inflation Reduction Act content rules. U.S. Department of Energy building retrofits are accelerating the adoption of edge-lit PMMA panels that drop lighting power density by 40%. Canada’s housing boom, driven by immigration, is lifting skylight and façade demand.
Europe held a significant volume in 2025. Trinseo’s Rho depolymerization plant feeds recycled monomer into Italian and German converters at a EUR 200-per-ton discount, catalyzing circular procurement policies. Regulatory loss from single-use packaging is being offset by architectural and automotive demand. South America and the Middle East and Africa are witnessing rising demand for PMMA, with Brazil’s construction and Saudi Arabia’s Vision 2030 projects as bright spots, though logistics costs cap import penetration.

Competitive Landscape
The PMMA market is moderately consolidated. Patent activity surged in 2024-2025 around low-temperature catalysts and inline defect-detection AI, signaling a technology race for optical-grade yield improvement. Smaller specialists such as Suzhou Double Elephant focus on ultra-pure beads for ISO 13485-certified intraocular lenses, an arena where sub-10-ppm residual monomer is non-negotiable. Automotive OEMs in Europe are already demanding headlamp lenses with 30% recycled content that still meet SAE J2650 photometric standards, a specification that fewer than five suppliers can match. Aerospace transparencies remain a high-barrier island because FAA certification cycles exceed 24 months, granting incumbents like PPG Aerospace pricing latitude. Overall, product differentiation through AI-assisted quality control and renewable feedstocks is steadily eroding pure scale as the sole competitive lever in the PMMA market.
Polymethyl Methacrylate (PMMA) Industry Leaders
Röhm GmbH
Mitsubishi Chemical Group Corporation
CHIMEI
Trinseo
Sumitomo Chemical Co., Ltd.
- *Disclaimer: Major Players sorted in no particular order

Recent Industry Developments
- January 2026: Mitsubishi Chemical upgraded its Yokkaichi optical-grade extrusion line with machine-vision quality control that cut rejection rates to 1.1%.
- February 2025: Röhm committed USD 500 million to build a 250,000-ton MMA plant in Bay City, Texas, for a late-2027 start-up.
- January 2025: Trinseo launched Europe’s first 10,000-ton closed-loop PMMA depolymerization facility in Rho, Italy, yielding 92%-purity monomer.


Global Polymethyl Methacrylate (PMMA) Market Report Scope
Polymethyl methacrylate (PMMA) is a clear, rigid thermoplastic commonly referred to as acrylic, acrylic glass, or plexiglass. Due to its excellent light transmittance, PMMA finds extensive application in the lighting industry, particularly in the production of lenses, diffusers, and light guides.
The polymethyl methacrylate (PMMA) market is segmented by product form, end-user industry and geography. By product form, the market is segmented into sheets, beads and pellets, and resin compounds and granules. By end-user industry, the market is segmented into automotive, building and construction, electrical and electronics, aerospace, industrial machinery and equipment, and other end-user industries. The report also covers the market size and forecasts for the PMMA market in 20 countries across major regions. For each segment, the market sizing and forecasts have been done based on volume (tons).
| Sheets |
| Beads and Pellets |
| Resin Compounds and Granules |
| Automotive |
| Building and Construction |
| Electrical and Electronics |
| Aerospace |
| Industrial Machinery and Equipment |
| Other End-user Industries |
| Asia-Pacific | China |
| Japan | |
| India | |
| South Korea | |
| Australia | |
| Malaysia | |
| Rest of Asia-Pacific | |
| North America | United States |
| Canada | |
| Mexico | |
| Europe | Germany |
| France | |
| Italy | |
| United Kingdom | |
| Russia | |
| Rest of Europe | |
| South America | Brazil |
| Argentina | |
| Rest of South America | |
| Middle East and Africa | Saudi Arabia |
| South Africa | |
| United Arab Emirates | |
| Nigeria | |
| Rest of Middle East and Africa |
| By Product Form | Sheets | |
| Beads and Pellets | ||
| Resin Compounds and Granules | ||
| By End-user Industry | Automotive | |
| Building and Construction | ||
| Electrical and Electronics | ||
| Aerospace | ||
| Industrial Machinery and Equipment | ||
| Other End-user Industries | ||
| By Geography | Asia-Pacific | China |
| Japan | ||
| India | ||
| South Korea | ||
| Australia | ||
| Malaysia | ||
| Rest of Asia-Pacific | ||
| North America | United States | |
| Canada | ||
| Mexico | ||
| Europe | Germany | |
| France | ||
| Italy | ||
| United Kingdom | ||
| Russia | ||
| Rest of Europe | ||
| South America | Brazil | |
| Argentina | ||
| Rest of South America | ||
| Middle East and Africa | Saudi Arabia | |
| South Africa | ||
| United Arab Emirates | ||
| Nigeria | ||
| Rest of Middle East and Africa | ||


Market Definition
- End-user Industry - Building & Construction, Automotive, Aerospace, Industrial Machinery, Electrical & Electronics, and Others are the end-user industries considered under the polymethyl methacrylate market.
- Resin - Under the scope of the study, virgin polymethyl methacrylate resin in the primary forms such as powder, granules, etc. are considered.
| Keyword | Definition |
|---|---|
| Acetal | This is a rigid material that has a slippery surface. It can easily withstand wear and tear in abusive work environments. This polymer is used for building applications such as gears, bearings, valve components, etc. |
| Acrylic | This synthetic resin is a derivative of acrylic acid. It forms a smooth surface and is mainly used for various indoor applications. The material can also be used for outdoor applications with a special formulation. |
| Cast film | A cast film is made by depositing a layer of plastic onto a surface then solidifying and removing the film from that surface. The plastic layer can be in molten form, in a solution, or in dispersion. |
| Colorants & Pigments | Colorants & Pigments are additives used to change the color of the plastic. They can be a powder or a resin/color premix. |
| Composite material | A composite material is a material that is produced from two or more constituent materials. These constituent materials have dissimilar chemical or physical properties and are merged to create a material with properties unlike the individual elements. |
| Degree of Polymerization (DP) | The number of monomeric units in a macromolecule, polymer, or oligomer molecule is referred to as the degree of polymerization or DP. Plastics with useful physical properties often have DPs in the thousands. |
| Dispersion | To create a suspension or solution of material in another substance, fine, agglomerated solid particles of one substance are dispersed in a liquid or another substance to form a dispersion. |
| Fiberglass | Fiberglass-reinforced plastic is a material made up of glass fibers embedded in a resin matrix. These materials have high tensile and impact strength. Handrails and platforms are two examples of lightweight structural applications that use standard fiberglass. |
| Fiber-reinforced polymer (FRP) | Fiber-reinforced polymer is a composite material made of a polymer matrix reinforced with fibers. The fibers are usually glass, carbon, aramid, or basalt. |
| Flake | This is a dry, peeled-off piece, usually with an uneven surface, and is the base of cellulosic plastics. |
| Fluoropolymers | This is a fluorocarbon-based polymer with multiple carbon-fluorine bonds. It is characterized by high resistance to solvents, acids, and bases. These materials are tough yet easy to machine. Some of the popular fluoropolymers are PTFE, ETFE, PVDF, PVF, etc. |
| Kevlar | Kevlar is the commonly referred name for aramid fiber, which was initially a Dupont brand for aramid fiber. Any group of lightweight, heat-resistant, solid, synthetic, aromatic polyamide materials that are fashioned into fibers, filaments, or sheets is called aramid fiber. They are classified into Para-aramid and Meta-aramid. |
| Laminate | A structure or surface composed of sequential layers of material bonded under pressure and heat to build up to the desired shape and width. |
| Nylon | They are synthetic fiber-forming polyamides formed into yarns and monofilaments. These fibers possess excellent tensile strength, durability, and elasticity. They have high melting points and can resist chemicals and various liquids. |
| PET preform | A preform is an intermediate product that is subsequently blown into a polyethylene terephthalate (PET) bottle or a container. |
| Plastic compounding | Compounding consists of preparing plastic formulations by mixing and/or blending polymers and additives in a molten state to achieve the desired characteristics. These blends are automatically dosed with fixed setpoints usually through feeders/hoppers. |
| Plastic pellets | Plastic pellets, also known as pre-production pellets or nurdles, are the building blocks for nearly every product made of plastic. |
| Polymerization | It is a chemical reaction of several monomer molecules to form polymer chains that form stable covalent bonds. |
| Styrene Copolymers | A copolymer is a polymer derived from more than one species of monomer, and a styrene copolymer is a chain of polymers consisting of styrene and acrylate. |
| Thermoplastics | Thermoplastics are defined as polymers that become soft material when it is heated and becomes hard when it is cooled. Thermoplastics have wide-ranging properties and can be remolded and recycled without affecting their physical properties. |
| Virgin Plastic | It is a basic form of plastic that has never been used, processed, or developed. It may be considered more valuable than recycled or already used materials. |


Research Methodology
Mordor Intelligence follows a four-step methodology in all our reports.
- Step-1: Identify Key Variables: The quantifiable key variables (industry and extraneous) pertaining to the specific product segment and country are selected from a group of relevant variables & factors based on desk research & literature review; along with primary expert inputs. These variables are further confirmed through regression modeling (wherever required).
- Step-2: Build a Market Model: In order to build a robust forecasting methodology, the variables and factors identified in Step-1 are tested against available historical market numbers. Through an iterative process, the variables required for market forecast are set and the model is built on the basis of these variables.
- Step-3: Validate and Finalize: In this important step, all market numbers, variables and analyst calls are validated through an extensive network of primary research experts from the market studied. The respondents are selected across levels and functions to generate a holistic picture of the market studied.
- Step-4: Research Outputs: Syndicated Reports, Custom Consulting Assignments, Databases & Subscription Platforms


