Market Overview
| Study Period | 2020 - 2031 |
|---|---|
| Forecast Data Period | 2026 - 2031 |
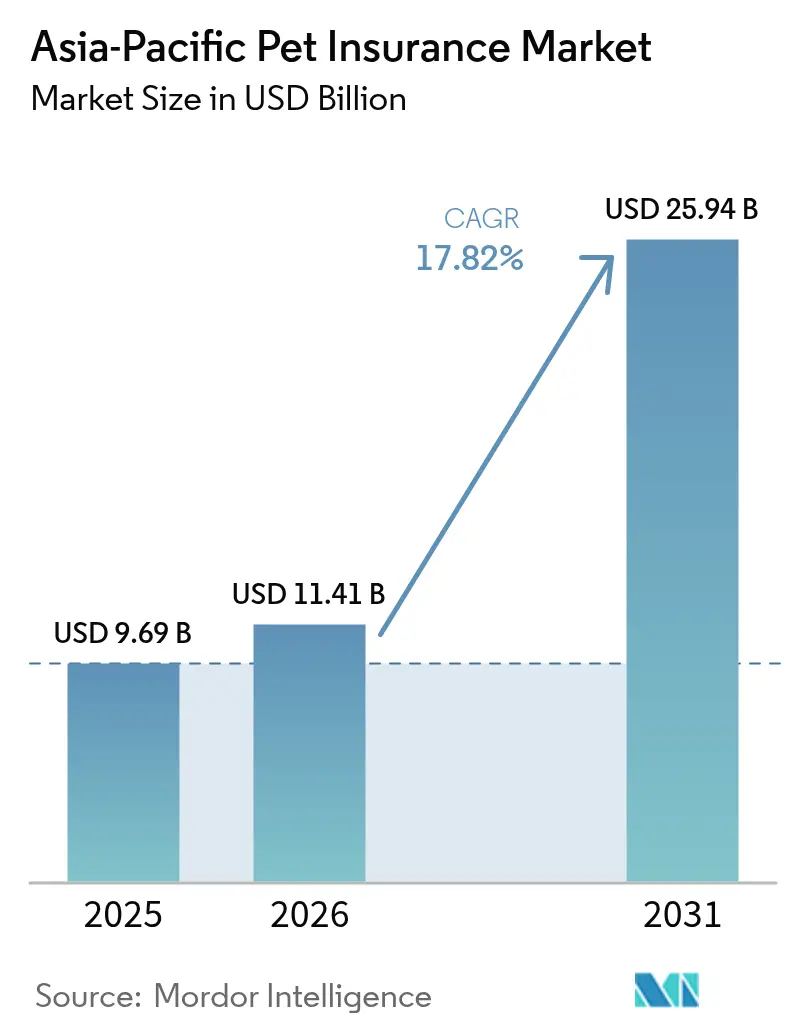
| Base Year Market Size (2025) | USD 9.69 Billion |
| Market Size (2026) | USD 11.41 Billion |
| Market Size (2031) | USD 25.94 Billion |
| Growth Rate (2026 - 2031) | 17.82% CAGR |
| Market Concentration | Medium |
Major Players.webp) *Disclaimer: Major Players sorted in no particular order Image © Mordor Intelligence. Reuse requires attribution under CC BY 4.0. | |
Asia-Pacific Pet Insurance Market Analysis by Mordor Intelligence
The Asia-Pacific pet insurance market size was valued at USD 9.69 billion in 2025 and estimated to grow from USD 11.41 billion in 2026 to reach USD 25.94 billion by 2031, at a CAGR of 17.82% during the forecast period (2026-2031). Rising disposable income, escalating veterinary bills, and a steady shift toward viewing pets as family members are powering the acceleration. Adoption is spreading from mature territories such as Japan and Australia to high-growth countries including China, India, and key Southeast Asian economies. Mobile-first sales journeys bundled micro-policies on regional e-commerce platforms, and employer-subsidised benefit schemes are lowering acquisition costs and broadening reach. Regulatory moves that mandate liability cover in South Korea and Singapore further normalise the value proposition while insurers respond to infrastructure gaps by funding tele-vet services and preferred-provider networks. Competitive intensity is climbing as legacy carriers, digital insurers, and large retailers race to control data, brand equity, and ecosystem touch-points.
Key Report Takeaways
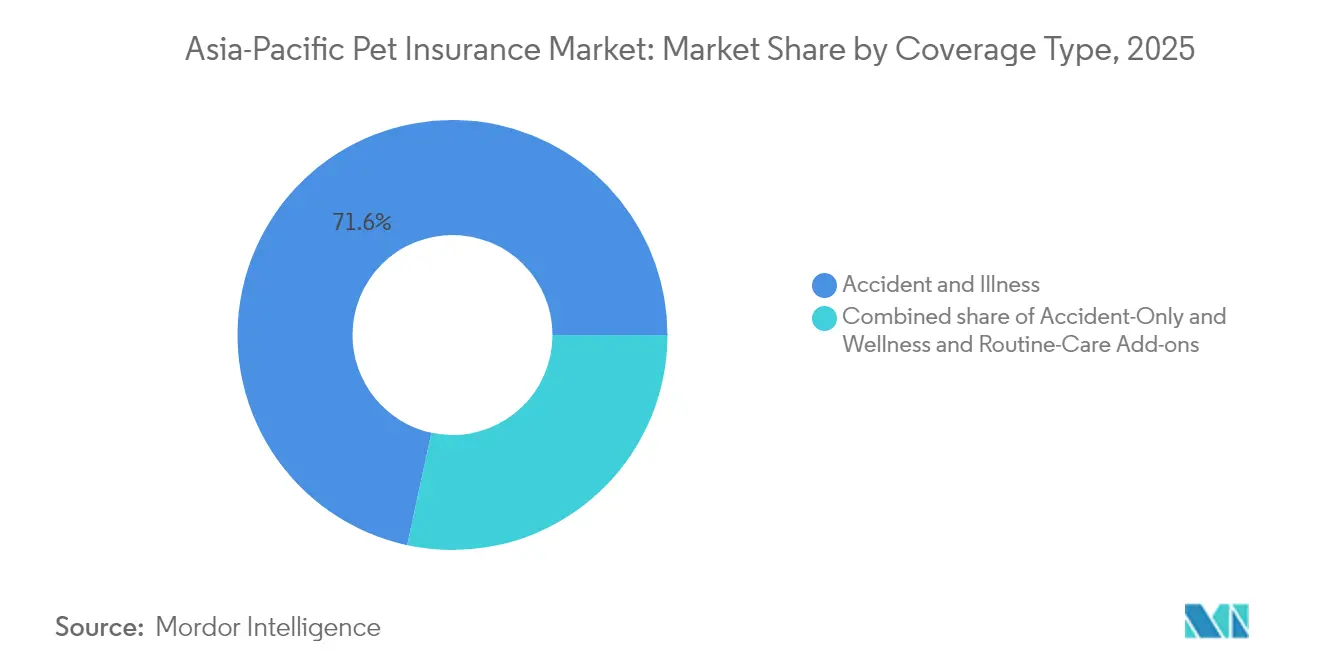
- By coverage type, Accident & Illness led with 71.62% of the APAC pet insurance market share in 2025, while Wellness & Routine-Care Add-ons are projected to grow at an 18.10% CAGR through 2031.
- By animal, dogs accounted for 64.02% share of the APAC pet insurance market size in 2025, whereas cat policies are set to expand at a 13.95% CAGR during 2026-2031.
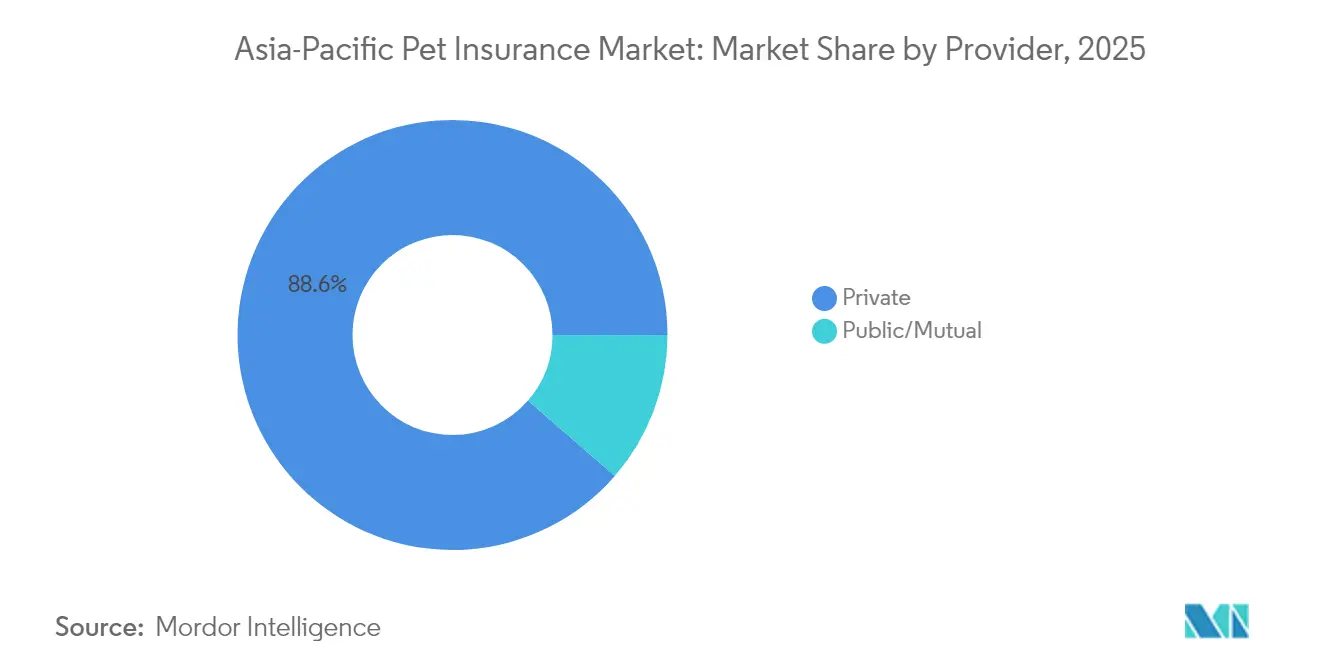
- By provider, private insurers controlled 88.62% revenue share in 2025; the public and mutual segment is advancing at an 10.87% CAGR to 2031.
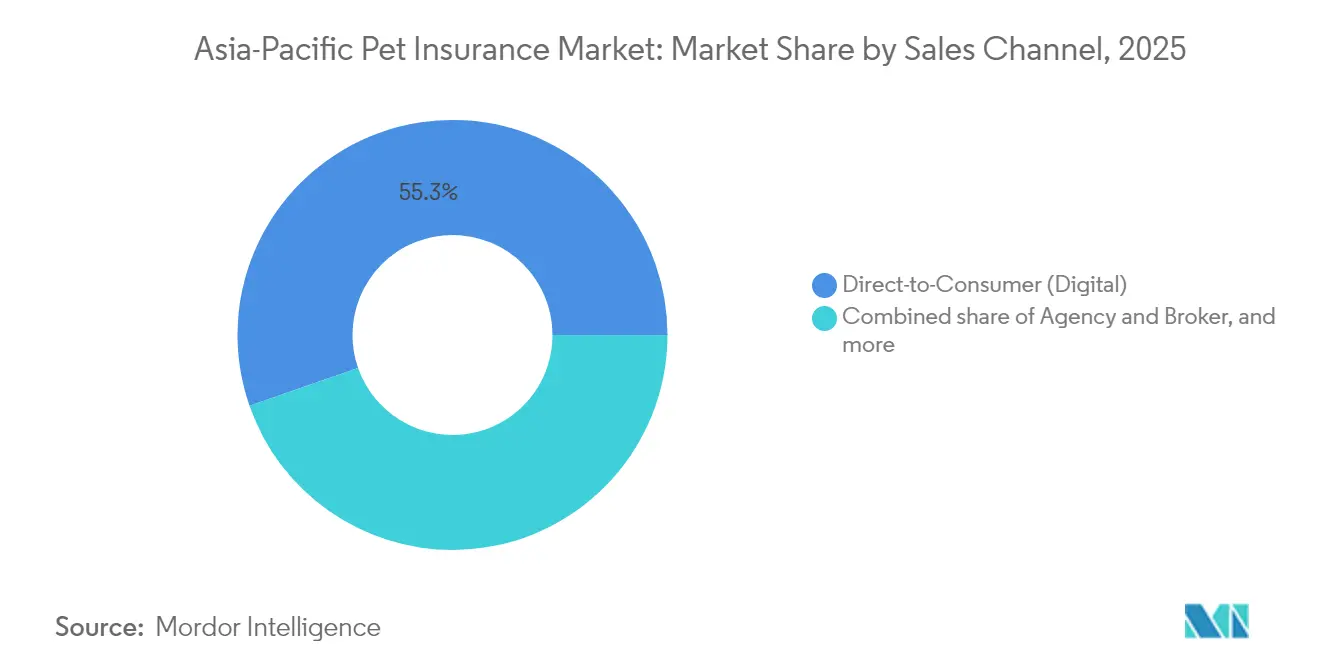
- By sales channel, direct-to-consumer digital platforms captured 55.34% of new policies in 2025; retail and pet-store embedded sales hold the fastest outlook at 19.04% CAGR to 2031.
- By geography, Japan held 31.85% of the APAC pet insurance market share in 2025, while China is poised for the quickest expansion at 18.74% CAGR over the forecast horizon.
Note: Market size and forecast figures in this report are generated using Mordor Intelligence’s proprietary estimation framework, updated with the latest available data and insights as of 2026.
Asia-Pacific Pet Insurance Market Trends and Insights
Drivers Impact Analysis*
| Drivers Impact Analysis | (~) % Impact on CAGR Forecast | Geographic Relevance | Impact Timeline |
|---|---|---|---|
| Pet humanisation in tier-1 Chinese cities | +3.2% | China; spillover to Taiwan and Hong Kong | Medium term (2-4 years) |
| Corporate pet-care benefit programmes | +2.1% | Japan, Australia, Singapore | Short term (≤2 years) |
| Post-COVID companion-animal adoption | +3.8% | India, Southeast Asia | Medium term (2-4 years) |
| Mobile-first insurance platforms | +2.7% | Pan-APAC; strongest in Indonesia, Philippines, Thailand | Short term (≤2 years) |
| ASEAN e-commerce bundling of micro-insurance | +1.9% | Singapore, Malaysia, Thailand, Indonesia, Philippines, Vietnam | Medium term (2-4 years) |
| Regulatory mandates for third-party liability cover | +1.4% | South Korea, Singapore | Short term (≤2 years) |
| Source: Mordor Intelligence | |||
Surging “Pet Humanisation” Spending in Tier-1 Chinese Cities
Average annual veterinary spending in Beijing, Shanghai, and Guangzhou climbed 37.0% in 2024 as millennial and Gen-Z owners redirected 15-20% of discretionary income toward premium pet care[1]Zhuoqiong Wang, “Pet Market Recovery Signals Economic Rebound,” China Daily, chinadailyhk.com. Insurance uptake in these hubs doubled from 8% to 14% year-over-year, and 76% of new policies were purchased via smartphone apps in Q1 2025[2]JD Group, “Annual Consumer Trends Report 2024,” jd.com. These urban consumers demand human-style benefits such as preventative check-ups and mental-health cover, prompting insurers to launch full-stack mobile journeys that close the sale in under three minutes. Enhanced data capture from app usage is now feeding AI underwriting engines, reducing rating errors and improving claims triage. The rising willingness to insure higher-value exotic breeds is also widening the premium pool despite the actuarial challenges linked to limited breed-specific claims history.
Expansion of Corporate Pet-care Benefit Programmes in Japan & Australia
Forty-two percent of Fortune 500 employers across Japan and Australia subsidised pet insurance in 2024, creating a stable, low-lapse distribution vein. Policies sold through human-resources packages showed 28% lower churn than direct-to-consumer contracts, and Anicom Holdings saw corporate-channel premiums jump 34%, representing 22% of its book[3]Anicom Holdings, “FY 2024 Integrated Report,” anicom.co.jp. Australian market leader Medibank Private signed 17 enterprise deals that collectively insure 85,000 pets, bundling wellness allowances and tele-vet consults to raise utilisation and retention[4]Medibank Private, “Pet Insurance Investor Presentation 2024,” medibank.com.au. Employers frame the benefit as a mental-health perk that lowers stress for staff worried about veterinary bills. Insurers, for their part, gain concentrated groups of low-average-age animals whose claim ratios trend below open-market averages, boosting portfolio profitability.
Post-COVID Companion-Animal Adoption across India & Southeast Asia
Pet ownership in urban India and Southeast Asia grew 47.0% between 2020 and 2024 as remote-work lifestyles normalised animal companionship. Veterinary treatment prices rose 22.0% in 2024, creating financial exposure for first-time pet parents who lack established clinic relationships. Digital insurers capitalised on this awareness gap: 68.0% of new Southeast Asian owners researched cover online before visiting a veterinarian. Policy bundles that include vaccination vouchers and 24/7 tele-medicine are resonating, with conversion rates 2.2 times higher than for accident-only products. Insurers are also piloting micro-subscription models that escalate coverage automatically over the pet life-cycle, an approach well-suited to emerging middle-class incomes.
Availability of Mobile-First On-boarding & Claim Apps
Mobile platforms processed 56.0% of APAC pet insurance market sales in 2024. AI-supported claim verification cut average reimbursement times from 14 days in 2022 to under 48 hours in 2024 at leading carriers such as Anicom and Medibank, lifting Net Promoter Scores by double digits. Tele-vet video calls embedded inside claim flows boosted repeat-purchase odds by 27.0%. Consumer expectations now mirror fintech norms: instant policy issuance, real-time tracking, and cashless vet payments via QR code. Newer entrants differentiate on user experience rather than price, pushing incumbents toward aggressive tech investment cycles.
Restraints Impact Analysis*
| Restraint | (~) % Impact on CAGR Forecast | Geographic Relevance | Impact Timeline |
|---|---|---|---|
| Veterinary infrastructure gaps | –2.8% | India, Southeast Asia, China tier-2/3 | Long term (≥4 years) |
| Limited actuarial data for exotic breeds | –1.6% | Pan-APAC; most acute in emerging markets | Medium term (2-4 years) |
| Cultural reluctance toward pet insurance in rural provinces | –0.9% | Rural areas across APAC markets | Long term (≥5 years) |
| High fraudulent claim incidence in certain Chinese provinces | –0.7% | Guangdong, Jiangsu, Zhejiang | Short term (≤2 years) |
| Source: Mordor Intelligence | |||
Cultural Reluctance toward Pet Insurance in Rural Provinces
Pet owners living in rural districts across India, China, and Indonesia frequently rely on home remedies or informal community veterinarians, leaving little perceived need for formal insurance. A 2024 survey by China’s Ministry of Agriculture and Rural Affairs showed that only 1.5% of pet owners in county-level areas carried any form of cover, compared with 12.6% in adjacent prefecture-level cities. Similar patterns are visible in India, where the Department of Animal Husbandry found that 68% of rural households view veterinary costs as too low or too infrequent to justify premiums. Cultural traditions also favor natural remedies and barter-based care, reducing trust in written policies and digital claim processes. Limited smartphone penetration compounds the gap because most insurers distribute policies through mobile apps. As a result, rural uptake lags urban centers by more than a decade, forcing insurers to tailor grassroots awareness campaigns and micro-premium products that match seasonal income cycles.
High Fraudulent Claim Incidence in Certain Chinese Provinces
Guangdong, Jiangsu, and Zhejiang recorded a 4.6% fraudulent-claim ratio in 2024, more than double the national average, according to the China Banking and Insurance Regulatory Commission. Common schemes include collusion between clinics and policyholders to inflate invoices or submit duplicate bills for routine procedures. These practices raise loss ratios and force insurers to load extra premiums on policies issued in high-risk postal codes, reducing affordability for honest owners. Carriers have responded by piloting blockchain-based invoice verification that cut falsified submissions by 92% in early trials. Yet fraud rings quickly adapt, shifting to smaller claims that evade algorithmic red flags and still erode underwriting margins. Persistent fraud discourages new entrants and slows product rollout in affected regions, limiting overall market expansion until tighter inter-agency data sharing and stiffer penalties take hold.
*Our forecasts treat driver/restraint impacts as directional, not additive. The impact forecasts reflect baseline growth, mix effects, and variable interactions.
Segment Analysis
By Coverage Type: Wellness Add-ons Disrupting Traditional Models
Accident & Illness policies captured 71.62% of the APAC pet insurance market share in 2025 as they remain the default response to unpredictable, high-cost events. The segment enjoys deep adoption in Japan and Australia where a single cruciate-ligament surgery can cost more than USD 5,000. Insurers continue to refine sub-limits and deductible ladders to manage claim volatility while maintaining perceived value. Wellness & Routine-Care Add-ons are the growth engine, advancing at 18.10% CAGR and appealing to millennials who view preventative check-ups and dental cleanings as essential. Roughly 64% of new customers opted for at least one wellness rider in 2024. The APAC pet insurance market size for accident-only cover remains relevant in price-sensitive pockets such as India, Indonesia, and Thailand, where it functions as a low-premium entry gate. Innovative stepped-coverage designs now auto-upgrade accident-only policies to broader benefits after claim-free periods, boosting retention without requiring active customer decisions.
Second-generation products include behavioural therapy subsidies, lost-pet recovery services, and mental-health consultations for owners managing chronic pet conditions. These additions fight commoditisation and create upsell paths. Insurers report that bundles featuring at least one non-traditional perk show 1.6-times higher cross-sell rates into lifetime policies. As more data emerges that preventative spend lowers catastrophic outlay, underwriting margins are predicted to widen by mid-decade.


By Animal: Dogs Dominate While Cat Coverage Accelerates
Dogs accounted for 64.02% of the APAC pet insurance market size in 2025, fuelled by higher average vet bills and regulatory scrutiny around canine ownership. Breed-specific plans in Japan cover hereditary issues in Shiba Inus and Dachshunds, allowing refined pricing that mitigates anti-selection. The cat segment’s 28.77% share is expanding quickly at 13.95% CAGR as space-constrained apartment dwellers across Hong Kong, Singapore, and mainland China favour felines. Premiums for cats run 30-40% below canine equivalents, inviting first-time buyers. Exotic birds, rabbits, and reptiles make up 7.21% of policies but show niche promise: Pet Insurance Australia’s February 2024 exotic-bird product sold out an initial 3,000-policy allocation in two months. The actuarial restraint noted earlier still inflates exotic-breed premiums, yet specialised carriers are investing in micro-cohorts to collect claims evidence and unlock under-served value.
Urban demographic changes underpin segment momentum. In Japan’s ageing society, small-breed dogs and cats match limited living space and owner mobility. Mainland China’s millennial cohort is now adopting cats at a faster absolute rate than dogs according to the 2024 Pet Industry White Paper. Higher feline adoption tilts portfolio risk profiles toward lower-severity claims, improving combined ratios and freeing capital for product experimentation.
By Provider: Private Insurers Innovate While Public Options Expand Access
Private carriers wrote 88.62% of 2025 premiums, leaning on digital underwriting, behavioural data, and embedded sales partnerships. In Japan, the top five companies command 78.0% of the private segment, yet in India none exceed 12.0%—a structural divergence that pressures global players to tailor entry strategies. Ecosystem integration is the new differentiation: 43.0% of private providers now run in-house tele-vet clinics and e-commerce pet shops. Public and mutual programmes remain small at 11.38% share but are important catalysts for financial inclusion. South Korea’s National Pet Insurance Programme, launched April 2024, subsidises basic cover for low-income households and has already enrolled 60,000 animals. Mutual co-operatives in Taiwan and Thailand trim administrative overheads by 22.0%, enabling lower premiums that appeal to cautious first-timers. As public schemes generate credible loss data, they will likely migrate up-market in partnership with commercial reinsurers.
By Sales Channel: Digital Dominance Amid Channel Diversification
Direct-to-consumer online routes delivered 55.34% of all new APAC pet insurance market policies in 2025 thanks to customer acquisition costs that average 42% below agency channels. High smartphone penetration in Indonesia, Philippines, and Vietnam magnifies this edge. Embedded retail and pet-store channels are scaling fastest at 19.04% CAGR. Instant QR-code activation at checkout boosts conversion among impulse adopters and secures an early role in the pet ownership journey. Agency and broker models still service complex lifetime policies, preserving 28.27% share and 14% higher commission yields. Bancassurance and affinity tie-ups with credit-card issuers or airlines control 16.39% of production, posting conversion rates 2.3 times higher than stand-alone digital ads because of trust transfer from established financial brands. Future distribution success hinges on omnichannel orchestration rather than channel supremacy.
By Policy Term: Lifetime Coverage Gains Strategic Priority
Lifetime contracts dominated at 57.45% in 2025, prized for guaranteed continuity of chronic-condition coverage and resulting 87.0% retention. Australian market leader Medibank created a no-exclusion renewal guarantee in March 2024 that immediately resonated with owners of senior pets. Lifetime products improve risk pooling by retaining healthy animals into older, claim-intensive years. Annual or non-lifetime plans hold 42.55% share, operating as gateway offerings for budget-sensitive households. Modular coverage launched by Japan’s ipet Insurance lets buyers dial benefits up or down at renewal without switching insurers, increasing account stickiness. As predictive analytics sharpen lapse-risk scoring, carriers are expected to nudge more customers toward lifetime options via gamified loyalty credits and wellness cashbacks.
Geography Analysis
Japan retained 31.85% of the APAC pet insurance market in 2025 on the back of sophisticated veterinary networks and a penetration rate of 14.3%. Growth is moderating to an 8.33% CAGR through 2031 as early adopters saturate; consequently, incumbents focus on integrating tele-health, genetic testing, and activity tracking into holistic wellness ecosystems. Anicom’s February 2024 health-platform launch boosted cross-sell ratios by 23% within six months.
China accounted for 16.38% of 2025 premiums yet is forecast to expand at 18.74% CAGR, the fastest across the region. Penetration remains low at 3.2%, so upside is considerable. Urban tier-1 and tier-2 cities host most of the veterinary capacity capable of supporting comprehensive cover. Ping An’s March 2024 platform issued 120,000 policies in its first quarter by integrating with the group’s broader financial-services super-app.
Australia represented 17.12% of the APAC pet insurance market size in 2025. The 9.41% CAGR outlook stems from niche innovation such as usage-based pricing and exotic-pet riders. Medibank’s April 2024 activity-monitor product, which varies premiums monthly, is closely watched by Singaporean and Hong Kong insurers that face similar affluent urban demographics.
Collectively, India and Southeast Asia delivered 10.41% and 13.66% shares respectively in 2025. They are projected to post 15.92% and 17.31% CAGRs as digital insurers leapfrog physical distribution constraints. Bajaj Allianz reported 78% mobile-initiated sales in 2024, signalling a digital default path. South Korea’s 4.78% share reflects a liability-led ecosystem that is already converting one-third of mandatory buyers into health-policy holders within six months. The remaining 5.80% of premiums come from Taiwan, Hong Kong, and New Zealand, each exhibiting unique regulatory and demographic drivers yet sharing high willingness to pay for advanced care.
Competitive Landscape
Competition varies sharply across the APAC pet insurance market. Japan operates as an oligopoly where Anicom, ipet, and Rakuten General command 67.2% of premium volume, enabling economies of scale in claims data and tech investment. Mature-market leaders focus on ecosystem-wide stickiness: Anicom’s AI underwriting cut loss-ratio variance by 34.0%, while ipet’s modular plans created a 20% uplift in optional-rider take-up. In contrast, India and Southeast Asia remain fragmented; no single player exceeds 12% share, so customer acquisition leadership is still contestable.
E-commerce conglomerates are a rising force. Rakuten captured 8.2% share in Japan within three years by cross-selling from its loyalty programme. Indonesia’s Tokopedia pilots micro-policies bundled with pet-food subscriptions, slashing acquisition costs by 68% relative to display ads. Traditional multiline carriers such as Sompo Japan and Mitsui Sumitomo are injecting risk-management know-how and reinsurance capacity, especially for high-severity canine claims.
Data mastery is the new strategic moat. Anicom’s 15-year database underpins predictive fraud screening, while Australia’s Medibank patented an AI photo-triage engine in March 2024 that authenticates pet identity and grades wound severity for lightning-fast approvals. Niche specialists chase underserved white spaces: Pet Insurance Australia scaled exotic-bird cover by partnering with avian vets, and India’s Pawtect focuses solely on senior-dog plans. Consolidation is anticipated in mid-tier markets once regulatory clarity improves and actuarial tables mature.
Asia-Pacific Pet Insurance Industry Leaders
Anicom Holdings Inc
ipet Insurance Co., Ltd.
The Hollard Insurance Company Ltd
Rakuten General Insurance
Sompo Japan Insurance Inc.
- *Disclaimer: Major Players sorted in no particular order

Recent Industry Developments
- March 2025: ZhongAn’s pet insurance premiums surpassed CNY 1 billion, validating digital-only distribution and dynamic pricing in mainland China.
- April 2025: MSIG Singapore launched PawEasy, bundling illness, dental, and behavioural benefits within a fully digital servicing suite.
- December 2024: Silversky partnered with MSIG Singapore and Stere Asia to embed digital pet cover at retail checkout across 60,000 outlets.
- November 2024: Korea’s National Pet Insurance Programme raised coverage limits for low-income households, broadening welfare reach.
- September 2024: Anicom Holdings introduced AI-powered claim pre-approvals in Japan, cutting reimbursement times to under 24 hours.
- July 2024: Pet Insurance Australia unveiled exotic-bird cover with avian wellness riders, signalling latent demand in niche segments.


Research Methodology Framework and Report Scope
Market Definitions and Key Coverage
Our study defines the Asia-Pacific pet insurance market as all written-premium policies that cover unexpected veterinary expenses for companion animals, primarily dogs and cats, across accident, illness, and wellness add-ons, regardless of sales channel or policy term. According to Mordor Intelligence estimates, the market generated about USD 9.69 billion in 2025 and is forecast to reach roughly USD 22.27 billion by 2030, expanding at an 18.1 % CAGR.
Scope exclusion: livestock mortality, liability cover for kennels, and micro-embedded benefits in broader pet-care schemes are not counted.
Segmentation Overview
- By Coverage Type
- Accident & Illness
- Accident-Only
- Wellness & Routine-Care Add-ons
- By Animal
- Dog
- Cat
- Other Companion Animals (Birds, Rabbits, etc.)
- By Provider
- Private
- Public / Mutual
- By Sales Channel
- Direct-to-Consumer (Digital)
- Agency & Broker
- Bancassurance & Affinity Partnerships
- Retail & Pet-store Embedded
- By Policy Term
- Lifetime
- Annual / Non-lifetime
- Geography
- China
- Japan
- Australia
- India
- South Korea
- Southeast Asia (Indonesia, Thailand, Malaysia, Vietnam, Philippines, Singapore)
- Rest of APAC (Hong Kong, Taiwan, New Zealand, Pakistan, Sri Lanka, etc.)
Detailed Research Methodology and Data Validation
Primary Research
Mordor analysts interviewed underwriting professionals, regional veterinary-clinic chains, and digital pet-care platforms across China, Japan, India, Australia, and Southeast Asia. These conversations refined assumptions on average selling price, lapse rates, and channel-mix shifts, then served as reality checks for early model drafts.
Desk Research
We anchored baseline demand using open veterinary-care cost indices from ministries of agriculture, household expenditure surveys released by statistics bureaus in Japan, Australia, and China, and policy count disclosures from trade bodies such as the General Insurance Association of Japan. Additional threads came from animal-health peer-reviewed journals that track disease prevalence and treatment price inflation, which help our analysts benchmark realistic claim frequencies.
Company filings, IPO prospectuses of regional insurtechs, and press releases on cross-border bancassurance tie-ups clarified premium pricing ladders and commission spreads. Select paid resources, including D&B Hoovers for insurer financials and Dow Jones Factiva for deal flow, filled historical gaps. The source list is illustrative, not exhaustive; numerous other public datasets were consulted to validate patterns and spot anomalies.
Market-Sizing & Forecasting
A top-down construct, beginning with country veterinary-spend pools and insured-pet penetration, establishes the regional revenue base. Sampled average premiums and policy terms from primary calls provide a bottom-up cross-check. Key variables include pet population growth, urban pet-parent share, average veterinary bill inflation, policy uptake per animal type, and the tilt toward digital direct-to-consumer sales. Multivariate regression, supplemented by scenario analysis for regulatory shifts, projects each driver forward before the totals are reconciled through one pass of sensitivity testing.
Data Validation & Update Cycle
Outputs move through analyst peer review, variance flags against external indices, and leadership sign-off. Our tables refresh annually, and interim updates trigger when policy rate filings, currency swings above five percent, or material corporate actions dictate.
Why Mordor's Asia Pacific Pet Insurance Baseline Commands Reliability
Published values often diverge because firms choose different geographic baskets, premium definitions, and refresh points.
By reporting the full written-premium value chain and updating every twelve months, we present a neutral midpoint that decision-makers can trust.
Key gap drivers include narrower species coverage, exclusion of wellness riders, or aggressive churn assumptions elsewhere.
Some publishers project from global ratios without local veterinary-cost curves, while others lack primary validations that temper headline growth claims.
Benchmark comparison
| Market Size | Anonymized source | Primary gap driver |
|---|---|---|
| USD 9.69 bn (2025) | Mordor Intelligence | - |
| USD 3.69 bn (2024) | Global Consultancy A | Omits wellness add-ons and smaller Southeast Asian markets |
| USD 2.28 bn (2024) | Regional Consultancy B | Uses premium written only by private carriers, excludes public mutuals |
| USD 4.31 bn (2024) | Trade Journal C | Applies uniform 10 % churn without country-specific lapse evidence |
The comparison shows that, by selecting the right scope, blending validated premiums with grounded penetration metrics, and keeping a brisk refresh cadence, Mordor Intelligence delivers a balanced, dependable starting point for strategic planning.


Key Questions Answered in the Report
What is the current size of the APAC pet insurance market?
The APAC pet insurance market size is USD 11.41 billion in 2026 and is projected to climb to USD 25.94 billion by 2031.
Which country leads the APAC pet insurance market in 2025?
Japan leads with 31.85% market share thanks to mature veterinary networks and a 14.3% penetration rate.
How fast is China’s pet insurance segment growing?
China is expanding at a 18.74% CAGR between 2026 and 2031, the fastest in the region.
Why are wellness add-ons gaining popularity?
Millennials prefer preventative care, and insurers find that including wellness benefits lowers long-term claim costs and raises retention.
What distribution channel sells the most pet insurance across APAC?
Direct-to-consumer digital platforms account for 55.34% of new policy sales due to lower acquisition costs and superior user experience.
How do regulatory mandates affect growth?
Required third-party liability cover in South Korea and Singapore introduces owners to the concept of pet insurance, and one-third subsequently buy health policies within six months.
Page last updated on:


