Market Overview
| Study Period | 2021 - 2031 |
|---|---|
| Forecast Data Period | 2026 - 2031 |
| Historical Data Period | 2021 - 2024 |
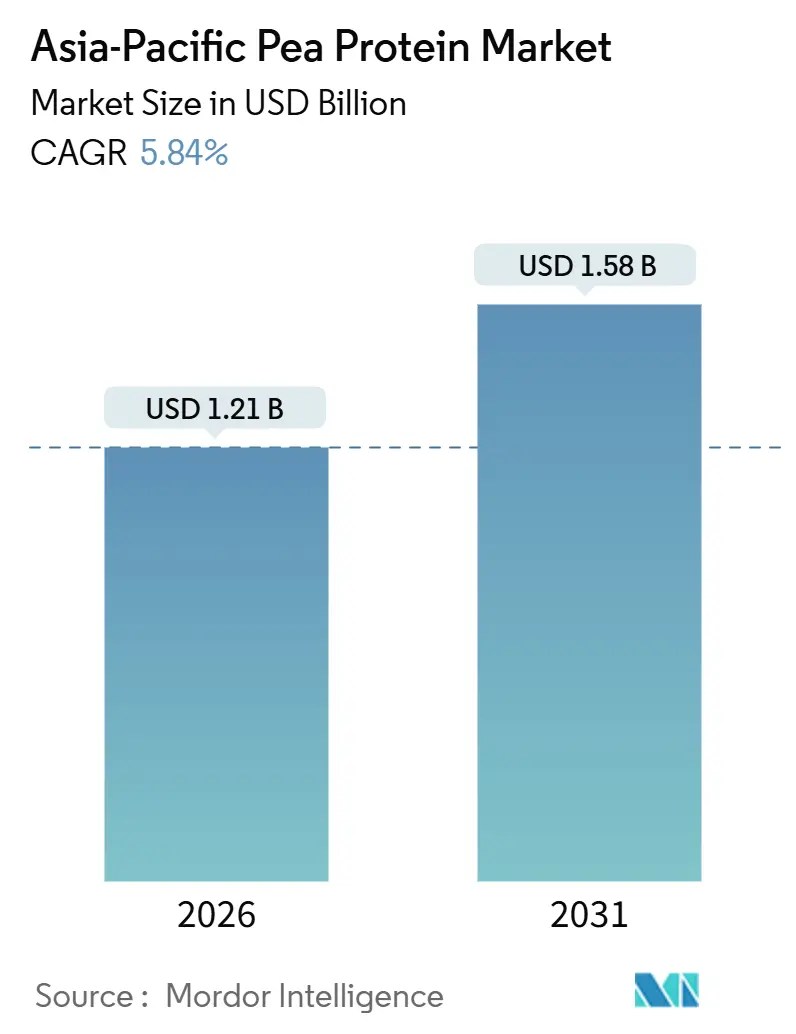
| Market Size (2026) | USD 1.21 Billion |
| Market Size (2031) | USD 1.58 Billion |
| Growth Rate (2026 - 2031) | 5.84% CAGR |
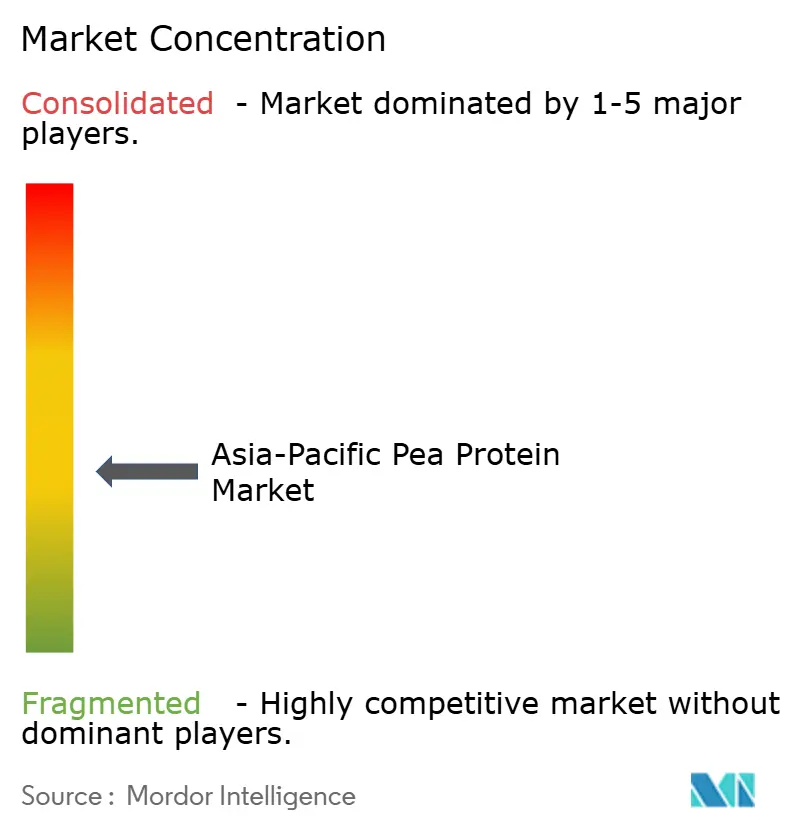
| Market Concentration | Medium |
Major Players*Disclaimer: Major Players sorted in no particular order Image © Mordor Intelligence. Reuse requires attribution under CC BY 4.0. | |
Asia-Pacific Pea Protein Market Analysis by Mordor Intelligence
The Asia Pacific pea protein market size stood at USD 1.21 billion in 2026 and is projected to reach USD 1.58 billion by 2031, registering a 5.48% CAGR over the forecast window. The measured expansion reflects a maturing ingredient category in which regulatory divergence and cost gaps versus soy cap upside even as plant-based diets, sports nutrition, and aquafeed reformulations widen the addressable base. Demand is reinforced by government nutrition policies, venture capital funding for alternative proteins, and pulse-breeding programs that increase protein yields. However, supply chains remain concentrated in temperate zones, exposing processors in tropical Asia to freight and tariff volatility. Chinese anti-dumping duties in the United States and a pending European Union probe have redirected export flows toward intra-regional buyers, accelerating intra-Asian trade lanes. At the same time, vertically integrated players use scale to absorb compliance costs tied to halal certification, allergen labeling, and novel-food dossiers, preserving margin even as raw-pea prices fluctuate.
Key Report Takeaways
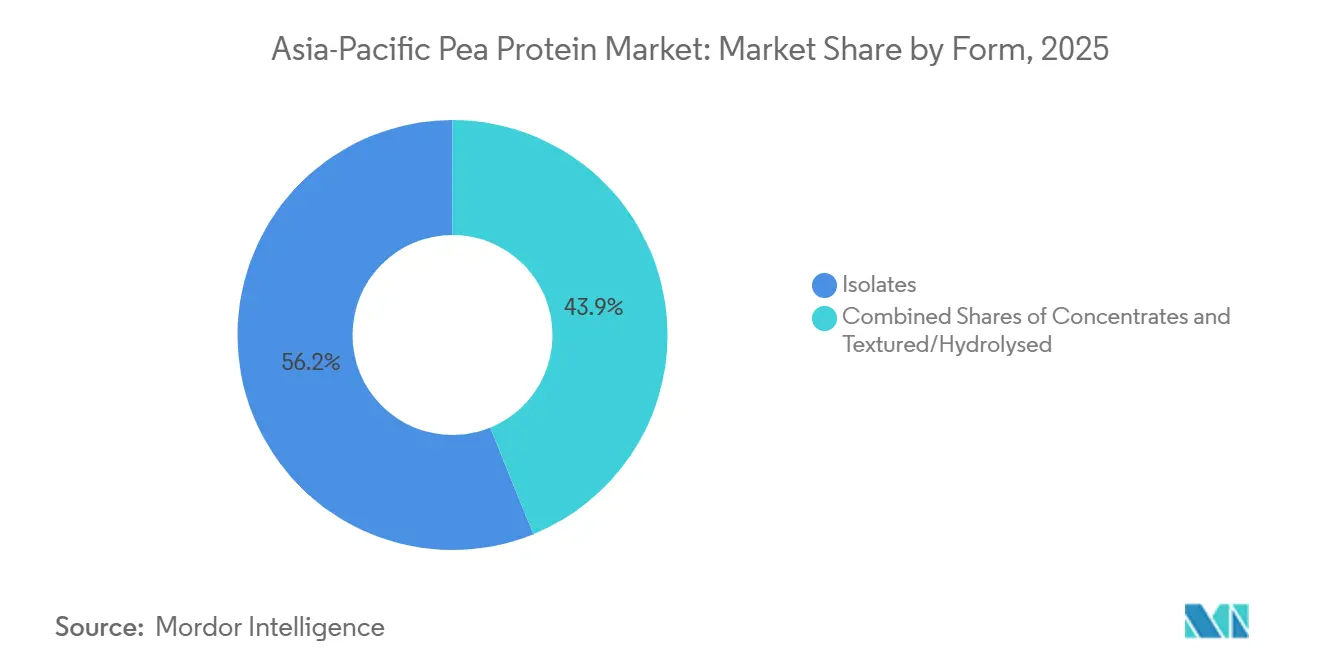
- By form, isolates led with 56.15% of the Asia Pacific pea protein market share in 2025; textured and hydrolysed grades are tracking the fastest expansion at an 8.21% CAGR to 2031.
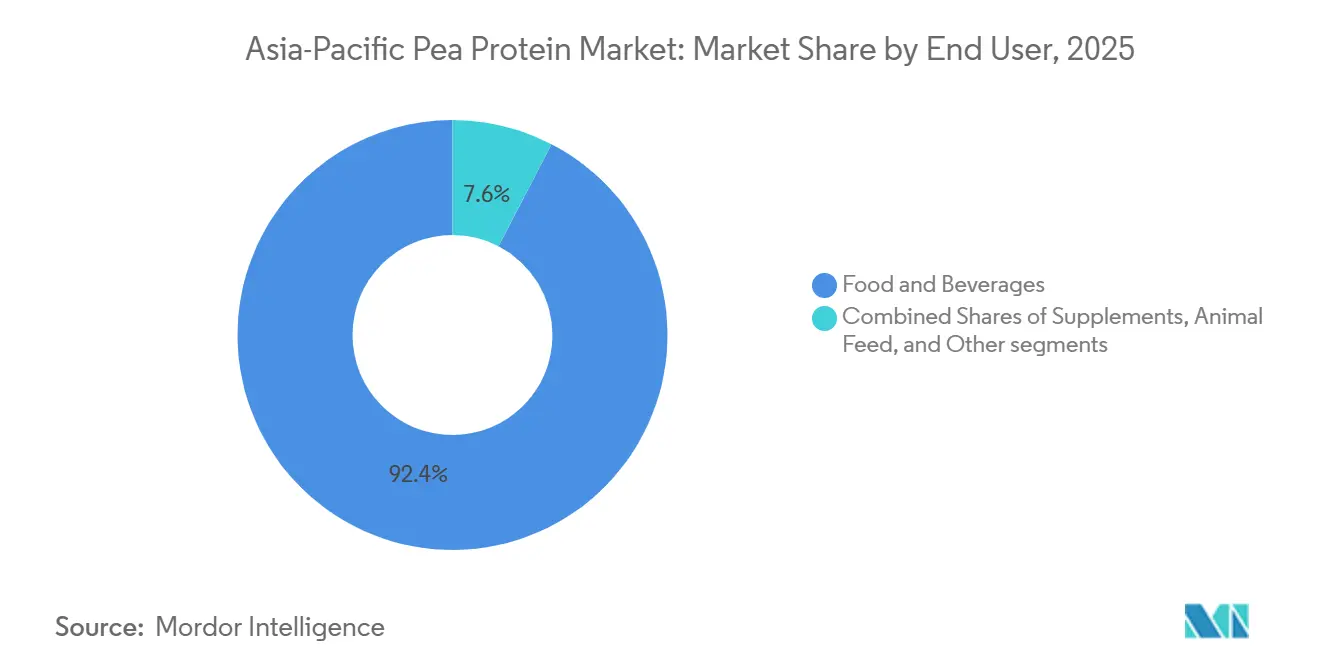
- By end user, food and beverages accounted for 92.38% of the Asia Pacific pea protein market size in 2025, while animal feed is projected to rise at a 7.28% CAGR through 2031.
- By geography, China contributed 45.28% of regional revenue in 2025, whereas Australia is forecast to advance at an 8.22% CAGR to 2031.
Note: Market size and forecast figures in this report are generated using Mordor Intelligence’s proprietary estimation framework, updated with the latest available data and insights as of January 2026.
Asia-Pacific Pea Protein Market Trends and Insights
Drivers Impact Analysis*
| Drivers | (~) % Impact on CAGR Forecasts | Geographic Relevance | Impact Timeline |
|---|---|---|---|
| Health Consciousness Favoring Pea Protein's High Protein, Fiber, and Low-Fat Profile | +1.2% | China, India, Japan, South Korea, Australia | Medium term (2-4 years) |
| Expanding Plant-Based Food and Beverage Sectors Like Meat/Dairy Alternatives | +1.5% | China, India, Singapore, Australia, South Korea | Short term (≤ 2 years) |
| Rising Veganism and Vegetarianism, Especially in India and China | +0.9% | India, China, with spillover to Thailand, Malaysia | Long term (≥ 4 years) |
| Versatility in Applications from Supplements to Bakery and Functional Foods | +0.8% | Japan, South Korea, Australia, Singapore | Medium term (2-4 years) |
| Technological Advances in Extraction Improving Quality and Hypoallergenicity | +0.7% | Global, with early adoption in Australia, Singapore | Long term (≥ 4 years) |
| Health Trends Like Preventive Care and Chronic Disease Prevention | +0.6% | Japan, South Korea, Australia, urban China and India | Long term (≥ 4 years) |
| Source: Mordor Intelligence | |||


Health Consciousness Favoring Pea Protein's High Protein, Fiber, and Low-Fat Profile
Pea protein provides 21 grams of protein, 6 grams of dietary fiber, and less than 2 grams of fat per 100 grams. This nutritional composition aligns with the World Health Organization's preventive-nutrition guidelines for managing non-communicable diseases. India's 2024 Household Consumption Expenditure Survey reports that the average daily protein intake is 61 to 63 grams per capita. While cereals account for the majority of this intake, pulses contribute only 8 to 10 grams. This gap highlights a rising demand for concentrated protein sources that do not require refrigeration, as noted by India's Ministry of Statistics and Programme Implementation[1]Source: Ministry of Statistics and Programme Implementation, India, “Household Consumption Expenditure Survey 2024,” mospi.gov.in. In 2025, Japan's Ministry of Health, Labor and Welfare updated its Dietary Reference Intakes, recommending 1.0 gram of protein per kilogram of body weight for adults over 65. This update supports the growth of fortified beverages and medical-nutrition products containing hypoallergenic isolates. Urban consumers in China and South Korea are increasingly attentive to ingredient labels, particularly amino-acid scores. Pea protein, with a lysine content of approximately 7.2% of its total amino acids, outperforms rice protein, making it a preferred co-ingredient in vegan meal replacements. Australia's CSIRO, in its 2025 pulse-nutrition roadmap, emphasized the potential of yellow-pea varieties bred for higher branched-chain amino acids. Their findings show these varieties can match whey isolate in post-exercise recovery trials, a claim now leveraged by sports-nutrition brands in their product marketing.
Expanding Plant-Based Food and Beverage Sectors Like Meat/Dairy Alternatives
During 2024 and 2025, alternative-protein startups in Singapore raised SGD 450 million (approximately USD 335 million) in venture funding, according to Enterprise Singapore. A significant share of this funding is allocated to pilot-scale extrusion lines. In South Korea, the Ministry of Agriculture allocated KRW 100 billion (around USD 75 million) in 2024 to support research and development in fermentation and hybrid plant-proteins. Grant recipients are required to achieve cost parity with conventional meat by 2027[2]Source: Ministry of Agriculture, Food and Rural Affairs, South Korea, “Alternative Protein R&D Funding 2024,” mafra.go.kr. India launched the BioE3 policy in 2024 with an initial budget of INR 10,000 crore (roughly USD 1.2 billion), focusing on precision fermentation. However, the policy mandates that applicants co-develop plant-protein blends to address technical and consumer-acceptance risks. Roquette's 2024 annual report revealed a 29% year-on-year increase in pea crushing volumes, reaching 118 kilotons. This growth was driven by dairy-alternative contracts in China and Japan, where approximately 90% of adults are lactose intolerant. In 2025, Thailand's National Food Institute introduced a plant-based labeling standard. This standard allows "meat-free" claims only if products contain at least 12% protein by weight, ensuring sustained demand for high-concentration isolates.
Rising Veganism and Vegetarianism, Especially in India and China
India's cultural and religious heritage has traditionally promoted vegetarianism. However, the 2024 Household Consumption Expenditure Survey indicates a slight decline in per capita pulse consumption over the years. This suggests that urban dietary habits are shifting toward convenience foods, moving away from traditional dal-based meals. In China, the State Council introduced a 2024 guideline encouraging citizens to reduce meat consumption by 20% by 2030. This initiative supports the country's climate goals under the Paris Agreement and provides momentum for plant-protein ingredients, although enforcement remains inconsistent across provinces. According to a 2025 survey by the Good Food Institute APAC, 18% of urban Chinese respondents identified as flexitarian, up from 12% in 2023. The survey also revealed that taste parity with animal protein is the leading factor driving purchases, surpassing environmental and ethical considerations. In India, the BioE3 policy designates "alternative proteins" as a strategic sector. The policy includes grants covering up to 50% of capital expenditure for domestic ingredient manufacturers, a subsidy framework that has spurred joint ventures between European isolate producers and Indian food conglomerates.
Versatility in Applications from Supplements to Bakery and Functional Foods
Pea protein's neutral flavor and emulsifying properties make it a versatile ingredient for formulators, allowing its use in categories that traditionally relied on whey or soy. In 2025, Japan's sports-nutrition market, valued at approximately JPY 120 billion (around USD 800 million), recorded a 15% increase in vegan-labeled products. Pea isolate featured prominently, appearing in 40% of these new product launches, as reported by the Japan Health and Nutrition Food Association. In 2024, Australia's Therapeutic Goods Administration approved several infant-formula products containing pea-protein isolate. This approval was based on allergenicity studies that found no IgE-mediated reactions in trials involving 200 infants with cow's-milk allergies. In bakery applications, pea protein's water-binding capacity, about 2.5 grams of water per gram of protein, proves advantageous by extending shelf life, particularly in ambient-temperature distribution channels common in Southeast Asia. A 2025 white paper from Singapore's Agency for Science, Technology and Research highlighted that pea-protein hydrolysates can replace egg whites in meringues and foams. This breakthrough, a significant development for vegan patisserie, has already been licensed to three commercial bakeries in Singapore.
Restraint Impact Analysis*
| Restraints | (~) % Impact on CAGR Forecasts | Geographic Relevance | Impact Timeline |
|---|---|---|---|
| Higher Production Costs Compared to Other Proteins Like Soy or Animal Sources | -0.9% | China, India, Indonesia, Thailand, Vietnam | Short term (≤ 2 years) |
| Supply Chain Complexities and Extraction Process Inefficiencies | -0.6% | Tropical Asia (Indonesia, Thailand, Malaysia, Vietnam) | Medium term (2-4 years) |
| Competition From Established Soy, Rice, or Other Plant Proteins | -0.7% | China, Japan, South Korea, with spillover to Southeast Asia | Medium term (2-4 years) |
| Regulatory Variations Across Asia Pacific Countries on Labeling and Approvals | -0.5% | Indonesia, Malaysia, Thailand, Philippines | Long term (≥ 4 years) |
| Source: Mordor Intelligence | |||
Higher Production Costs Compared to Other Proteins Like Soy or Animal Sources
Pea-protein extraction yields range from 60% to 90%, depending on the method used. Wet fractionation with isoelectric precipitation typically results in lower yields compared to dry air-classification. On the other hand, soy isolate consistently achieves yields exceeding 90%, thanks to decades of process optimization and enzyme-assisted techniques. Extracting pea protein consumes an average of 12 to 15 megajoules per kilogram of isolate, primarily due to the multiple washing and drying cycles required to eliminate off-flavors. In contrast, soy isolate requires only 8 to 10 megajoules, benefiting from a well-established deodorization infrastructure. China's Yantai Shuangta, which operates a pea-protein production capacity of 150 metric tons per day, reported in its 2024 annual statement that raw yellow-pea prices increased by 18% year-on-year. This rise, caused by droughts in Inner Mongolia and Heilongjiang provinces, reduced gross margins by 3 percentage points, even as sales volumes grew. In June 2024, the United States imposed final anti-dumping duties of 122.19% on Chinese pea-protein imports, along with countervailing duties ranging from 15.15% to 355.89%. These actions effectively excluded many Asian exporters from the North American market, forcing them to absorb margin pressures in their regional sales.
Supply Chain Complexities and Extraction Process Inefficiencies
Yellow peas grow best in temperate climates with cool growing seasons. This restricts their cultivation in the Asia Pacific to northern China, specific areas of Australia, and New Zealand. However, most food manufacturing facilities are located in tropical or subtropical regions, as reported by the FAO. Despite substantial end-user demand, Indonesia, Thailand, and Vietnam collectively contribute less than 5% of the region's pea-protein production capacity. This deficit forces manufacturers to depend on imports, which increases lead times by 8 to 12 weeks and exposes them to currency risks. Wet-fractionation plants require consistent water quality and advanced wastewater-treatment systems. A 2025 feasibility study by Thailand's National Food Institute indicated that modifying an existing soy-processing line to accommodate peas would necessitate a capital investment of THB 200 million (approximately USD 5.7 million) for upgrades such as pH-adjustment tanks and centrifuges. Conversely, dry air-classification, while less water-intensive, produces concentrates instead of isolates. This limitation restricts its use in high-protein sports beverages, where the market standard is 80% to 90% protein content, as noted by the National Research Council Canada. In 2024, Australia's CSIRO developed a mobile extraction unit to process peas on farms, potentially reducing transport costs by 30%. However, the technology remains unproven at a commercial scale and faces regulatory challenges related to food-safety audits.
*Our forecasts treat driver/restraint impacts as directional, not additive. The impact forecasts reflect baseline growth, mix effects, and variable interactions.
Segment Analysis
By Form: Isolates Lead, Textured Variants Gain in Meat Analogues
The Asia Pacific pea protein market size for isolates reached USD 680 million in 2025, equal to 56.15% of the total value, reflecting solubility and neutral flavor favored in dairy alternatives. Textured and hydrolysed variants are projected to post an 8.21% CAGR, outpacing concentrates and isolates as meat-analogue manufacturers seek fibrous structures that replicate whole-muscle cuts. Concentrates, at 50-70% protein, retain a role in bakery mixes and extruded snacks where cost sensitivity outweighs purity. Continuous process innovation, including low-temperature drying, lowers trypsin-inhibitor levels and broadens infant-formula acceptance in Australia and Singapore.
Discrete investments underscore shifting priorities. Burcon’s Peazazz C isolate commands premiums of 20-30% above commodity grades, owing to 85% protein content and clarity in acidic beverages. Roquette’s textured grades, released in 2024, enable plant-based seafood and sausage formats, opening menus in Japan and Singapore quick-service chains. Hydrolysates, because peptides under 5 kDa yield umami notes, permit formulators to reduce yeast-extract additions and sodium without sacrificing flavor, an advantage in markets tightening salt-reduction targets. As functional claims proliferate, high-gelling isolates engineered for egg-white replacement in patisserie help bakeries satisfy vegan demand.


By End User: Food Dominates, Animal Feed Accelerates
Food and beverages captured 92.38% of 2025 revenue, driven by dairy-free milks, creamers, ready-to-eat meals, and bakery items that blend pea protein for texture and amino-acid balance. The segment benefits from lactose intolerance rates exceeding 90% in East Asian adults and policy nudges to curb saturated-fat intake. Beverage formulations advance through pH-stable isolates that deliver 10-12 g protein per 250 ml serving without sediment, boosting market penetration among on-the-go consumers. Supplement brands leverage hydrolysates for rapid absorption, especially in Japan, where aging demographics propel high-protein elderly nutrition.
Animal feed, though only 4.6% of the 2025 value, is rising at a 7.28% CAGR as aquaculture operations in Indonesia, Thailand, and Vietnam target fishmeal substitution rates of 25-30% to meet Aquaculture Stewardship Council criteria. Pea protein’s lysine and methionine ratios support comparable growth in tilapia and shrimp while cutting nitrogen excretion by 10-15%. Regulatory breakthroughs also aid momentum: Australia’s Therapeutic Goods Administration cleared several infant formulas containing pea isolate in 2024 after zero IgE reactions in clinical trials, signaling safety confidence and paving paths for broader Asia Pacific approvals. Personal-care applications remain a niche but lucrative outlet for enzymatically derived peptides claiming anti-aging benefits in South Korea and Japan.
Geography Analysis
China remained the linchpin with 45.28% of 2025 revenue, anchored by Yantai Shuangta’s 150 t/day capacity and Shandong Jianyuan’s vertically integrated grower network. Domestic demand climbs in snacks, dairy-alternatives, and sports drinks, but export ambitions confront United States duties and a September 2025 EU anti-dumping probe that may introduce provisional levies in 2026. Despite these headwinds, Chinese producers pivot to ASEAN buyers, partially offsetting lost Western volume.
India’s BioE3 policy channels INR 10,000 crore (USD 1.2 billion) toward fermentation and plant-protein hybrids, encouraging joint ventures for local isolate production in Madhya Pradesh SEZs. Yet reliance on imported yellow peas maintains cost pressure until pulse-acreage expansion materializes. Japan’s market is modest—pea protein represented 1.6% of plant-protein sales in 2024—yet niche pet-food and elderly-nutrition lines sustain premium positioning.
Australia posts the fastest trajectory at an 8.22% CAGR to 2031, buoyed by CSIRO cultivars raising protein to 26% and processors supplying sports powders and infant formulas into Southeast Asia[3]Source: Commonwealth Scientific and Industrial Research Organisation, “Pulse Breeding Roadmap 2025,” csiro.au. South Korea’s KRW 100 billion research and development grant scheme, contingent on cost parity by 2027, propels hybrid formulations blending pea isolates with fermented mycoprotein. ASEAN’s aquaculture hubs—Indonesia, Thailand, Vietnam—import isolates from China and Australia due to limited local extraction capacity, adding 8-12 week delivery cycles that elevate working capital but still undercut fishmeal in feed-conversion economics. Singapore’s 30 by 30 mandate draws Roquette’s regional headquarters and innovation center, fast-tracking product trials for hot, humid climates. Malaysia’s 2025 halal update unlocks Muslim-majority markets, while New Zealand focuses upstream on pulse breeding for export rather than downstream fractionation
Competitive Landscape
The Asia-Pacific pea protein market registers a concentration score of 4 out of 10, reflecting a fragmented structure where no single player commands more than 15% share, yet scale advantages accrue to vertically integrated firms that control upstream pulse sourcing and downstream formulation expertise. Yantai Shuangta operates 150 metric tons per day of capacity and claims roughly 60% of Chinese domestic output, leveraging long-term contracts with yellow-pea growers in Inner Mongolia and Heilongjiang to lock in feedstock costs, yet the firm's export ambitions face headwinds from United States anti-dumping duties of 122.19% and a pending European Union investigation initiated in September 2025. Roquette's 2024 annual report disclosed that pea crushing volumes rose 29% year-on-year to 118 kilotons, driven by dairy-alternative contracts in China and Japan, and the company's decision to site its Asia-Pacific headquarters in Singapore positions it to capture regulatory-first-mover advantages as the city-state's novel-food framework evolves.
Burcon NutraScience achieved first commercial production of its Peazazz C isolate in December 2024 and secured a USD 6.8 million multi-year supply agreement in 2025, demonstrating that premium isolates with 85% protein content and less than 1% residual starch can command price points 20% to 30% above commodity grades. White-space opportunities center on animal-feed formulations, where aquaculture operators in Indonesia, Thailand, and Vietnam seek fishmeal substitutes that meet Aquaculture Stewardship Council certification while lowering nitrogen excretion by 10% to 15%, a performance threshold that pea protein's amino-acid profile can satisfy.
Smaller contenders such as Axiom Foods and AGT Food and Ingredients are deploying mobile extraction units to process peas on-farm, reducing transport costs by 30% and shortening time-to-market, though the technology remains unproven at commercial scale and faces food-safety audit hurdles. Patent filings reveal a strategic pivot toward enzymatic hydrolysis and fermentation hybrids; Singapore's Agency for Science, Technology and Research published a 2025 application describing a two-stage process yielding peptides with ACE-inhibitory activity, potentially unlocking cardiovascular-health claims that would differentiate products in Japan's aging-population market
Asia-Pacific Pea Protein Industry Leaders
Archer Daniels Midland Company
Cargill, Incorporated
Ingredion Incorporated
Kerry Group PLC
International Flavors and Fragrances Inc.
- *Disclaimer: Major Players sorted in no particular order

Recent Industry Developments
- December 2025: The Victorian Government has opened a USD 9 million Plant Protein Hub at Agriculture Victoria's Horsham SmartFarm, backed by a total USD 12 million investment (USD 3 million for an adjoining glasshouse), to accelerate research on high-protein crops like lentils, chickpeas, and field peas amid rising plant-based food demand.
- July 2025: India-based food tech startup Prot has introduced Prot Block, a versatile pea protein ingredient designed as a clean-label, allergen-free alternative for everyday cooking. Containing 15g protein and 10g fiber per 100g, the bite-sized blocks use pea protein, wheat fiber, coconut fat, and sunflower oil, processed via a proprietary platform for firm texture and neutral taste, suitable for curries, stir-fries, salads, and snacks.
- August 2024: DKSH, a leading Market Expansion Services provider, has extended its exclusive distribution agreement with Cosucra, a Belgian producer of natural food ingredients, to strengthen the supply of pea proteins (Pisane) and chicory root fibers (Fibruline, Fibrulose) in Australia and New Zealand.


Asia-Pacific Pea Protein Market Report Scope
Pea protein is a high-quality, plant-based protein powder extracted from yellow split peas, known for being dairy-free, gluten-free, and soy-free.
The Asia-Pacific pea protein market is segmented by form into isolates, concentrates, and textured/hydrolysed. By end user, the market is segmented into animal feed, food and beverages, personal care and cosmetics, and supplements. Food and beverages are further segmented into bakery, beverages, breakfast cereals, condiments/sauces, confectionery, dairy and dairy alternatives, RTE/RTC foods, and snacks. Supplements are further segmented into baby food and infant formula, elderly and medical nutrition, and sports/performance nutrition. By geography, the market is segmented into Australia, China, India, Indonesia, Japan, Malaysia, New Zealand, South Korea, Thailand, Vietnam, and the rest of Asia-Pacific. The market sizing has been done in value terms in USD for all the abovementioned segments.
Form
| Concentrates |
| Isolates |
| Textured/Hydrolysed |
End User
| Animal Feed | |
| Food and Beverages | Bakery |
| Beverages | |
| Breakfast Cereals | |
| Condiments / Sauces | |
| Confectionery | |
| Dairy and Dairy-Alternative Products | |
| RTE / RTC Foods | |
| Snacks | |
| Personal Care and Cosmetics | |
| Supplements | Baby Food and Infant Formula |
| Elderly and Medical Nutrition | |
| Sport / Performance Nutrition |
Geography
| Australia |
| China |
| India |
| Indonesia |
| Japan |
| Malaysia |
| New Zealand |
| South Korea |
| Thailand |
| Vietnam |
| Rest of Asia-Pacific |
| Form | Concentrates | |
| Isolates | ||
| Textured/Hydrolysed | ||
| End User | Animal Feed | |
| Food and Beverages | Bakery | |
| Beverages | ||
| Breakfast Cereals | ||
| Condiments / Sauces | ||
| Confectionery | ||
| Dairy and Dairy-Alternative Products | ||
| RTE / RTC Foods | ||
| Snacks | ||
| Personal Care and Cosmetics | ||
| Supplements | Baby Food and Infant Formula | |
| Elderly and Medical Nutrition | ||
| Sport / Performance Nutrition | ||
| Geography | Australia | |
| China | ||
| India | ||
| Indonesia | ||
| Japan | ||
| Malaysia | ||
| New Zealand | ||
| South Korea | ||
| Thailand | ||
| Vietnam | ||
| Rest of Asia-Pacific | ||


Market Definition
- End User - The Protein Ingredients Market operates on a B2B basis. Food, Beverages, Supplements, Animal Feed, and Personal Care & Cosmetic manufacturers are considered to be end-consumers in the market studied. The scope excludes manufacturers buying liquid/dry whey to be used for application as a binding agent or thickener or other non-protein applications.
- Penetration Rate - Penetration Rate is defined as the percentage of Protein-Fortified End User Market Volume in the Overall End User Market Volume.
- Average Protein Content - Average protein content is the average protein content present per 100 g of product manufactured by all end-user companies considered under the scope of this report.
- End User Market Volume - End-user market volume is the consolidated volume of all types and forms of end-user products in the country or region.
| Keyword | Definition |
|---|---|
| Alpha-lactalbumin (α-Lactalbumin) | It is a protein that regulates the production of lactose in the milk of almost all mammalian species. |
| Amino acid | It is an organic compound that contains both amino and carboxylic acid functional groups, which are required for the synthesis of body protein and other important nitrogen-containing compounds, such as creatine, peptide hormones, and some neurotransmitters. |
| Blanching | It is the process of briefly heating vegetables with steam or boiling water. |
| BRC | British Retail Consortium |
| Bread improver | It is a flour-based blend of several components with specific functional properties designed to modify dough characteristics and give quality attributes to bread. |
| BSF | Black Soldier Fly |
| Caseinate | It is a substance produced by adding an alkali to acid casein, a derivative of casein. |
| Celiac disease | Celiac disease is an immune reaction to eating gluten, a protein found in wheat, barley, and rye. |
| Colostrum | It is a milky fluid that’s released by mammals that have recently given birth before breast milk production begins. |
| Concentrate | It is the least processed form of protein and has a protein content ranging from 40-90% by weight. |
| Dry protein basis | It refers to the percentage of "pure protein" present in a supplement after the water in it is completely removed through heat. |
| Dry whey | It is the product resulting from drying fresh whey which has been pasteurized and to which nothing has been added as a preservative. |
| Egg protein | It is a mixture of individual proteins, including ovalbumin, ovomucoid, ovoglobulin, conalbumin, vitellin, and vitellenin. |
| Emulsifier | It is a food additive that facilitates the blending of foods that are immiscible with one another, such as oil and water. |
| Enrichment | It is the process of addition of micronutrients that are lost during the processing of the product. |
| ERS | Economic Research Service of the USDA |
| Extrusion | It is the process of forcing soft mixed ingredients through an opening in a perforated plate or die designed to produce the required shape. The extruded food is then cut to a specific size by blades. |
| Fava | Also known as Faba, it is another word for yellow split beans. |
| FDA | Food and Drug Administration |
| Flaking | It is a process in which typically a cereal grain (like corn, wheat, or rice) is broken down into grits, cooked with flavors and syrups, and then pressed into flakes between cooled rollers. |
| Foaming agent | It is a food ingredient that makes it possible to form or maintain a uniform dispersion of a gaseous phase in a liquid or solid food. |
| Foodservice | It refers to the part of the food industry which includes businesses, institutions, and companies which prepare meals outside the home. It includes restaurants, school and hospital cafeterias, catering operations, and many other formats. |
| Fortification | It is the deliberate addition of micronutrients that are not found in them naturally or which are lost during processing, to improve a food product's nutritional value. |
| FSANZ | Food Standards Australia New Zealand |
| FSIS | Food Safety and Inspection Service |
| FSSAI | Food Safety and Standards Authority of India |
| Gelling agent | It is an ingredient that functions as a stabilizer and thickener to provide thickening without stiffness through the formation of gel. |
| GHG | Greenhouse Gas |
| Gluten | It is a family of proteins found in grains, including wheat, rye, spelt, and barley. |
| Hemp | It is a botanical class of Cannabis sativa cultivars grown specifically for industrial or medicinal use. |
| Hydrolysate | It is a form of protein manufactured by exposing the protein to enzymes that can partially break the bonds between the protein's amino acids and break down large, complicated proteins into smaller pieces. Its processing makes it easier and quicker to digest. |
| Hypoallergenic | It refers to a substance that causes fewer allergic reactions. |
| Isolate | It is the purest and most processed form of protein which has undergone separation to obtain a pure protein fraction. It typically contains ≥ 90% of protein by weight. |
| Keratin | It is a protein that helps form hair, nails, and the outer layer of skin. |
| Lactalbumin | It is the albumin contained in milk and obtained from whey. |
| Lactoferrin | It is an iron‑binding glycoprotein that is present in the milk of most mammals. |
| Lupin | It is the yellow legume seeds of the genus Lupinus. |
| Millenial | Also known as Generation Y or Gen Y, it refers to the people born from 1981 to 1996. |
| Monogastric | It refers to an animal with a single-compartmented stomach. Examples of monogastric include humans, poultry, pigs, horses, rabbits, dogs, and cats. Most monogastric are generally unable to digest much cellulose food materials such as grasses. |
| MPC | Milk protein concentrate |
| MPI | Milk protein isolate |
| MSPI | Methylated soy protein isolate |
| Mycoprotein | Mycoprotein is a form of single-cell protein, also known as fungal protein, derived from fungi for human consumption. |
| Nutricosmetics | It is a category of products and ingredients that act as nutritional supplements to care for skin, nails, and hair natural beauty. |
| Osteoporosis | It is a medical condition in which the bones become brittle and fragile from loss of tissue, typically as a result of hormonal changes, or deficiency of calcium or vitamin D. |
| PDCAAS | Protein digestibility-corrected amino acid score (PDCAAS) is a method of evaluating the quality of a protein based on both the amino acid requirements of humans and their ability to digest it. |
| Per-capita consumption of animal protein | It is the average amount of animal protein (such as milk, whey, gelatin, collagen, and egg proteins) that is readily available for consumption by each person in an actual population. |
| Per-capita consumption of plant protein | It is the average amount of plant protein (such as soy, wheat, pea, oat, and hemp proteins) that is readily available for consumption by each person in an actual population. |
| Quorn | It is a microbial protein manufactured using mycoprotein as an ingredient, in which the fungus culture is dried and mixed with egg albumen or potato protein, which acts as a binder, and then is adjusted in texture and pressed into various forms. |
| Ready-to-Cook (RTC) | It refers to food products that include all of the ingredients, where some preparation or cooking is required through a process that is given on the package. |
| Ready-to-Eat (RTE) | It refers to a food product prepared or cooked in advance, with no further cooking or preparation required before being eaten. |
| RTD | Ready-to-Drink |
| RTS | Ready-to-Serve |
| Saturated fat | It is a type of fat in which the fatty acid chains have all single bonds. It is generally considered unhealthy. |
| Sausage | It is a meat product made of finely chopped and seasoned meat, which may be fresh, smoked, or pickled and which is then usually stuffed into a casing. |
| Seitan | It is a plant-based meat substitute made out of wheat gluten. |
| Softgel | It is a gelatin-based capsule with a liquid fill. |
| SPC | Soy protein concentrate |
| SPI | Soy protein isolate |
| Spirulina | It is a biomass of cyanobacteria that can be consumed by humans and animals. |
| Stabilizer | It is an ingredient added to food products to help maintain or enhance their original texture, and physical and chemical characteristics. |
| Supplementation | It is the consumption or provision of concentrated sources of nutrients or other substances that are intended to supplement nutrients in the diet and is intended to correct nutritional deficiencies. |
| Texturant | It is a specific type of food ingredient that is used to control and alter the mouthfeel and texture of food and beverage products. |
| Thickener | It is an ingredient that is used to increase the viscosity of a liquid or dough and make it thicker, without substantially changing its other properties. |
| Trans fat | Also called trans-unsaturated fatty acids or trans fatty acids, it is a type of unsaturated fat that naturally occurs in small amounts in meat. |
| TSP | Textured soy protein |
| TVP | Textured vegetable protein |
| WPC | Whey protein concentrate |
| WPI | Whey protein isolate |


Research Methodology
Mordor Intelligence follows a four-step methodology in all our reports.
- Step-1: Identify Key Variables: The quantifiable key variables (industry and extraneous) pertaining to the specific product segment and country are selected from a group of relevant variables & factors based on desk research & literature review; along with primary expert inputs. These variables are further confirmed through regression modeling (wherever required).
- Step-2: Build a Market Model: In order to build a robust forecasting methodology, the variables and factors identified in Step-1 are tested against available historical market numbers. Through an iterative process, the variables required for market forecast are set and the model is built on the basis of these variables.
- Step-3: Validate and Finalize: In this important step, all market numbers, variables and analyst calls are validated through an extensive network of primary research experts from the market studied. The respondents are selected across levels and functions to generate a holistic picture of the market studied.
- Step-4: Research Outputs: Syndicated Reports, Custom Consulting Assignments, Databases & Subscription Platforms


