Asia-Pacific Non-Dairy Milk Market Size and Share
Market Overview
| Study Period | 2017 - 2030 |
|---|---|
| Forecast Data Period | 2025 - 2030 |
| Historical Data Period | 2017 - 2023 |
| Market Size (2025) | USD 10.22 Billion |
| Market Size (2030) | USD 15.43 Billion |
| Growth Rate (2025 - 2030) | 8.58% CAGR |
| Market Concentration | Low |
Major Players*Disclaimer: Major Players sorted in no particular order Image © Mordor Intelligence. Reuse requires attribution under CC BY 4.0. | |

Asia-Pacific Non-Dairy Milk Market Analysis by Mordor Intelligence
The Asia-Pacific Non-Dairy Milk Market size is estimated at 10.22 billion USD in 2025, and is expected to reach 15.43 billion USD by 2030, growing at a CAGR of 8.58% during the forecast period (2025-2030).
The Asia-Pacific non-dairy milk market is experiencing a significant transformation in its retail landscape, particularly in distribution channels. Off-trade retailing has emerged as the dominant force, commanding a substantial 93.64% market share in 2022, driven by consumers' preference for convenient purchasing options. The retail environment has evolved to accommodate varying price points, with products like oat milk being offered across a wide price spectrum from INR 255 to INR 764, making dairy-free milk alternatives accessible to different consumer segments. Specialty stores have gained prominence over the past three years, offering enhanced product visibility and comprehensive information about ingredients and sourcing, which has become increasingly important to conscious consumers.
Consumer preferences in the region are increasingly shifting toward plant-based milk alternatives, reflecting a broader change in dietary habits and health consciousness. In South Korea, approximately 74% of consumers now opt for plant milk, demonstrating the strong acceptance of milk alternatives in the region. The average Australian consumer's intake has reached approximately half a metric cup of dairy substitutes per week in 2022, indicating the growing integration of non-dairy milk into daily dietary habits. This shift is particularly evident among younger consumers who are more inclined to embrace plant-based milk options for both health and environmental reasons.
The market is witnessing substantial innovation in product offerings and retail strategies, with companies focusing on developing new flavors and formats to meet diverse consumer preferences. Retailers are expanding their non-dairy milk selections to include various options such as unsweetened, chocolate, and vanilla variants, catering to evolving consumer tastes. The specialty retail sector has experienced significant growth, with stores implementing sophisticated retail tools to manage expanding SKUs and provide enhanced customer service through product expertise and personalized shopping experiences.
The foodservice sector is rapidly adapting to meet the growing demand for dairy-free milk alternatives, with major chains incorporating these options into their menus. This trend is exemplified by the successful introduction of oat milk at Starbucks Korea, which sold over 200,000 beverages in the first month alone. India's largest coffee chain, Café Coffee Day, with its network of over 900 outlets, has expanded its beverage offerings to include milk alternatives in 2023, demonstrating the foodservice industry's commitment to meeting evolving consumer preferences. The integration of non-dairy milk options in foodservice establishments is creating new growth opportunities and expanding consumer exposure to dairy alternatives.
Asia-Pacific Non-Dairy Milk Market Trends and Insights
The increasing vegan population in the region, coupled with increasing milk allergies, is supporting the plant-based milk consumption in the region
- The consumption of different types of plant milk in Asia-Pacific has been on the rise for the past few years due to the growing vegan population. There are even vegan exhibitions/trade shows and music festivals conducted in different countries. For example, Australia has the third-highest percentage of vegans per capita globally. As of 2022, there are 2.5 million vegans and vegetarians' population in the country. Several vegan celebrities across the region, particularly celebrity chefs, have played a significant role in bringing plant-based lifestyles into the mainstream of dining and food culture. Thus, increasing the inclusion of soy milk in the daily diet, as it replaces conventional milk, strengthening the consumption patterns across the region.
- Among the dairy alternatives, plant-based milk like soy milk and almond milk had the majority share across the region in 2022. China is the leading country across the region in terms of consumption of dairy alternatives milk. Within plant-based milk, soy drinks have traditionally been the most popular in China due to the long-standing tradition of soy consumption and its wide availability.
- Consumers, especially those allergic to milk, are keen to consume plant-based milk products. Cow milk allergy is one of the common food allergies in young children. Many Japanese consumers are lactose intolerant and do not consume milk or milk products. As of 2022, in Australia, around 1 in 50 babies and young children showed signs of an allergy to cow's milk. Also, 45% of consumers are actively trying to reduce the number of animal products they consume. Thus, the per capita consumption of plant-based milk in Australia is estimated to increase by 4.74% in 2022-2023.


OTHER KEY INDUSTRY TRENDS COVERED IN THE REPORT
- Increasing innovations in the plant-based milk category is driving the production and use of soybeans and other cereals.
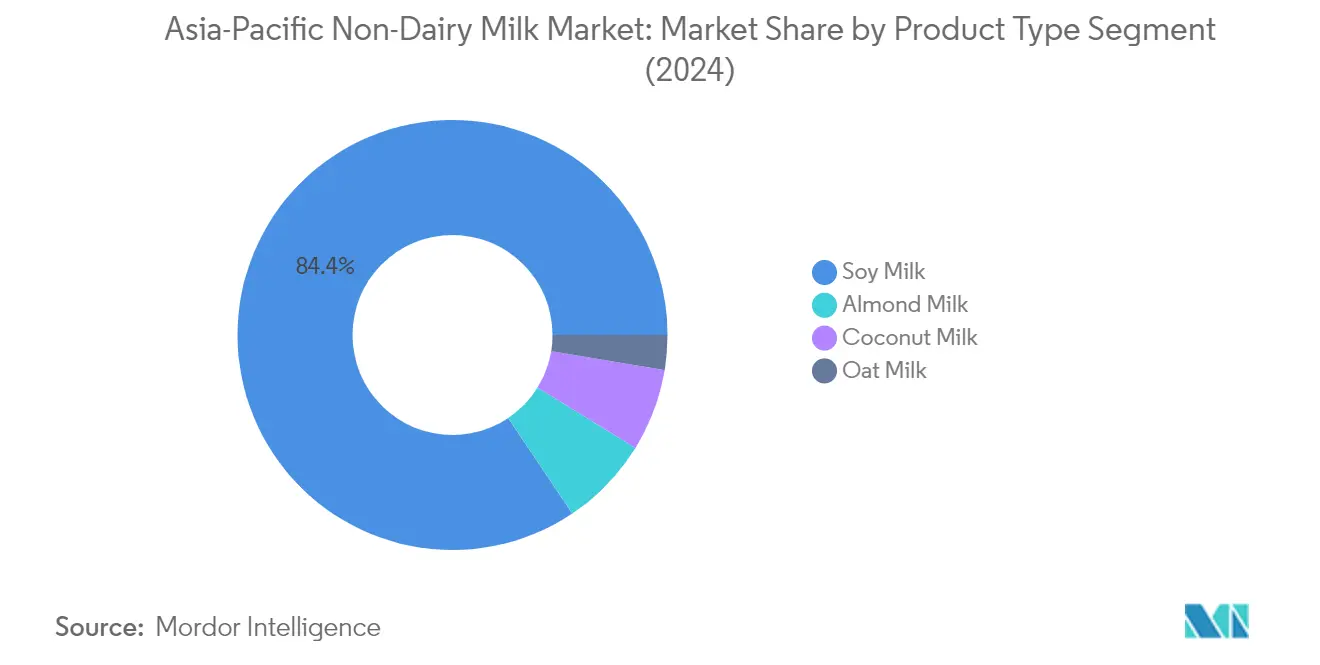
Segment Analysis: Product Type
Soy Milk Segment in Asia-Pacific Non-Dairy Milk Market
Soy milk dominates the Asia-Pacific non-dairy milk market, commanding approximately 84% of the total market volume in 2024. This substantial market leadership is primarily driven by its extensive usage in Chinese, Japanese, Korean, and other East Asian cuisines, along with its established position as a traditional plant-based protein source. The segment's strong performance is further supported by the increasing demand for low-fat and cholesterol-free milk alternatives among health-conscious consumers. Local producers like Kikkoman, Marusan, Sujahta, and other regional players have strengthened the segment's position through their wide distribution networks and product innovations. The segment's growth is also bolstered by the rising lactose-intolerant population in the region, with countries like Japan showing significant consumption patterns through both retail and foodservice channels.

Oat Milk Segment in Asia-Pacific Non-Dairy Milk Market
The oat milk segment is emerging as the fastest-growing category in the Asia-Pacific non-dairy milk market, projected to grow at approximately 12% during 2024-2029. This remarkable growth is driven by increasing environmental consciousness among consumers, particularly younger generations, who are actively seeking sustainable alternatives to traditional dairy products. The segment's expansion is further supported by the rising number of people adopting vegan diets across the region, with China expected to be the fastest-growing market for oat milk. Major cities including Beijing, Hong Kong, and Shanghai are witnessing rapid expansion of retail outlets stocking vegan products, with numerous restaurants incorporating oat milk options in their menus. The growth is also facilitated by strategic partnerships between international oat milk brands and local coffee chains, expanding the product's accessibility and visibility in the foodservice sector.
Remaining Segments in Product Type
The other significant segments in the Asia-Pacific non-dairy milk market include almond milk, coconut milk, hazelnut milk, and hemp milk, each catering to specific consumer preferences and dietary requirements. Almond milk has gained popularity due to its nutritional profile and lower calorie content, particularly among fitness enthusiasts. Coconut milk leverages the region's abundant coconut production, especially in Southeast Asian countries, and its versatile application in various cuisines. Hazelnut milk serves as a premium alternative with its distinct flavor profile and nutritional benefits, while hemp milk represents an emerging segment with growing acceptance among health-conscious consumers. These segments collectively contribute to the market's diversity and cater to varying consumer preferences across different regions and demographics.
Segment Analysis: Distribution Channel
Off-Trade Segment in Asia-Pacific Non-Dairy Milk Market
The off-trade distribution channel dominates the Asia-Pacific non-dairy milk market, accounting for approximately 94% of the total market share in 2024. This significant market share is attributed to the greater convenience offered to consumers when purchasing plant-based milk products. Off-trade channels provide plant-based milk at varied price points, ranging from low to premium, enabling consumers to choose products that suit their affordability parameters. The segment's strength is further reinforced by the extensive network of retail outlets, including supermarkets, convenience stores, online retailers, and specialty stores. These retailers focus on providing a wide variety of plant-based milk options, including different flavors such as unsweetened, chocolate, and vanilla, along with multiple brands to cater to diverse consumer preferences. Additionally, off-trade channels offer various promotional activities, discounts, and special offers, making plant-based milk more accessible and attractive to consumers.
On-Trade Segment in Asia-Pacific Non-Dairy Milk Market
The on-trade distribution channel is emerging as the fastest-growing segment in the Asia-Pacific non-dairy milk market, driven by the rising demand for out-of-home consumption. This channel encompasses foodservice establishments such as cafes, restaurants, and quick-service restaurants that are increasingly incorporating plant-based milk options into their menus. The segment's growth is supported by the expanding network of specialty coffee shops and cafes across the region that offer various plant-based milk alternatives for beverages. Major foodservice chains are actively expanding their plant-based milk offerings to meet the growing consumer demand for dairy alternatives in their coffee, tea, and other beverages. The channel's growth is further enhanced by the increasing number of consumers who prefer to experiment with plant-based milk options in their beverages when dining out or visiting coffee shops, particularly in urban areas where there is a higher concentration of foodservice establishments.
Asia-Pacific Non-Dairy Milk Market Geography Segment Analysis
Non-Dairy Milk Market in China
China dominates the Asia-Pacific non-dairy milk market, commanding approximately 53% of the total market value in 2024. The country's market leadership is driven by its large population base with lactose intolerance, with around 85% of people having difficulty digesting dairy products. The growing health consciousness among Chinese consumers has led to increased adoption of plant milk alternatives, particularly soy milk, which remains the dominant player by a significant margin. The market has also witnessed substantial growth in other varieties like almond milk, coconut milk, peanut milk, and walnut milk. Foreign businesses are actively targeting the Chinese market through strategic partnerships, exemplified by companies like OATLY collaborating with over 1,000 specialty coffee shops across major cities including Beijing, Shanghai, Guangzhou, and Shenzhen. The market is further strengthened by the rising popularity of Southeast Asian soybean milk brands, with companies from Singapore and Thailand gaining significant traction on major e-commerce platforms.
Non-Dairy Milk Market in New Zealand
New Zealand's non-dairy milk market is experiencing remarkable growth, projected to expand at approximately 15% annually from 2024 to 2029. The market's robust growth is attributed to changing consumer preferences and increasing awareness of health benefits associated with plant-based diets. The government actively supports the dairy-alternative industry through strategic investments, as demonstrated by its backing of local oat milk producers. The market has witnessed significant developments in manufacturing capabilities, with companies like Free Flow Manufacturing planning to establish facilities capable of producing 50 million liters of milk alternatives annually. The country has seen a particular surge in demand for soy milk, almond milk, and oat milk, with soy milk leading consumption patterns. The retail landscape has evolved to accommodate this growth, with major grocery chains expanding their plant-based milk offerings and reporting substantial increases in sales. Consumer awareness about sustainability and ethical consumption has further accelerated market growth, making New Zealand a key player in the region's plant-based beverage sector.
Non-Dairy Milk Market in Japan
Japan's non-dairy milk market demonstrates strong potential, driven by the country's high prevalence of lactose intolerance and growing consumer interest in plant-based alternatives. Soy milk dominates the market, accounting for a significant portion of plant-based milk consumption, supported by its deep-rooted presence in Japanese cuisine and culture. Local producers like Kikkoman, Marusan, Sujahta, Pokka Sapporo, and Otsuka Pharmaceutical maintain a strong presence in the market, particularly in the soy milk segment. The market's growth is further supported by innovative product launches and increasing adoption in the foodservice sector, particularly in coffee shops and restaurants. Japanese consumers' emphasis on health and wellness, combined with their openness to trying new plant-based alternatives, has created a favorable environment for market expansion. The country's robust distribution network and advanced retail infrastructure have also played crucial roles in making plant-based milk products widely accessible to consumers.
Non-Dairy Milk Market in South Korea
South Korea's non-dairy milk market showcases impressive development, supported by strong consumer acceptance and growing health consciousness. The market benefits from robust product registration with international certification bodies, with approximately 3,000 products registered by 250 South Korean firms with the Vegan Society Trademark. The country has witnessed a significant increase in its vegan population, with about half a million strict vegans and 1.5 million people following vegetarian or plant-based diets. The coffee shop culture in South Korea has been particularly instrumental in driving market growth, with major chains like Starbucks Korea successfully introducing dairy substitute milk options. The market is characterized by strong consumer awareness and preference for plant-based alternatives, with a notably high percentage of consumers choosing plant-based milk over other dairy alternatives. The retail sector has responded positively to this trend, with both domestic and international brands expanding their presence across various distribution channels.
Non-Dairy Milk Market in Other Countries
The non-dairy milk market in other Asia-Pacific countries, including Indonesia, India, Malaysia, Pakistan, Australia, and other Southeast Asian nations, demonstrates diverse growth patterns and consumer preferences. These markets are characterized by varying levels of consumer awareness, regulatory frameworks, and distribution infrastructure. Indonesia's market benefits from its position as a major coconut producer, while India's market is driven by its large vegetarian population and growing health consciousness. Malaysia's market shows strong potential due to its multicultural consumer base and growing vegan population, while Australia's market benefits from advanced retail infrastructure and strong consumer awareness of plant-based alternatives. The markets in these countries are supported by increasing urbanization, rising disposable incomes, and growing awareness of health and environmental issues. Local and international players are actively expanding their presence in these markets through product innovations and strategic partnerships, contributing to the overall growth of the Asia-Pacific non-dairy milk market.

Competitive Landscape
Top Companies in Asia-Pacific Non-Dairy Milk Market
The competitive landscape is characterized by a mix of established multinational companies and regional players actively expanding their presence through strategic initiatives. Companies are focusing heavily on product innovation, particularly in developing new flavors and fortified variants to meet evolving consumer preferences and health requirements. Operational agility is demonstrated through investments in advanced processing technologies and sustainable sourcing practices, with many players partnering with local farmers and suppliers. Strategic moves include expanding distribution networks through both traditional retail channels and e-commerce platforms, while also investing in marketing campaigns to educate consumers about plant-based milk benefits. Companies are strengthening their positions through geographic expansion, particularly in emerging markets like China and India, while simultaneously enhancing their production capabilities through new facility establishments and capacity expansions.
Market Dominated by Regional Manufacturing Specialists
The Asia-Pacific non-dairy milk market exhibits a moderately consolidated structure with a strong presence of regional manufacturing specialists who have a deep-rooted understanding of local taste preferences and distribution networks. These regional players, particularly from China and Japan, have established strong brand recognition and consumer trust through their long-standing presence in their respective markets. The landscape is characterized by a mix of pure-play plant-based milk beverage manufacturers and diversified food and beverage conglomerates that have expanded into the milk alternative segment, leveraging their existing distribution networks and brand equity.
The market is witnessing increased consolidation through strategic partnerships and joint ventures, particularly between local manufacturers and international players seeking to penetrate the Asian market. Local players are leveraging their manufacturing expertise and regional knowledge, while global companies bring advanced technology and international best practices. The competitive dynamics are further shaped by vertical integration strategies, with several players investing in their supply chain capabilities to ensure consistent quality and cost control. Market entry barriers remain relatively high due to the need for specialized processing capabilities and established distribution networks.
Innovation and Distribution Key to Growth
Success in the market increasingly depends on companies' ability to innovate across product formulation, packaging, and marketing strategies while maintaining strong distribution networks. Incumbents are focusing on expanding their product portfolios with premium offerings and functional benefits, while also investing in sustainable packaging solutions to appeal to environmentally conscious consumers. Companies are developing strategic partnerships with coffee chains, restaurants, and other foodservice outlets to increase their presence in the growing on-trade segment. The ability to maintain price competitiveness while ensuring product quality and meeting regulatory requirements remains crucial for market success.
For new entrants and smaller players, success lies in identifying and serving niche market segments with specialized products while building strong regional distribution networks. Companies need to focus on developing unique value propositions through product differentiation, whether through innovative ingredients, enhanced nutritional profiles, or specific functional benefits. Building direct-to-consumer channels and leveraging e-commerce platforms can help overcome traditional distribution barriers. The regulatory landscape, particularly regarding labeling requirements and health claims, continues to evolve, requiring companies to maintain flexibility in their compliance strategies while investing in quality control systems to meet varying standards across different markets.
Asia-Pacific Non-Dairy Milk Industry Leaders
Coconut Palm Group Co. Ltd
Hebei Yangyuan Zhihui Beverage Co. Ltd
Kikkoman Corporation
The Hershey Company
Vitasoy International Holdings Ltd
- *Disclaimer: Major Players sorted in no particular order


Recent Industry Developments
- September 2022: Hershey India launched Sofit Plus, a plant protein-fortified drink. The product is developed as a part of its ‘Nourishing Minds’ social initiative in collaboration with IIT-Bombay, Sion Hospital, to meet the nutritional needs of underprivileged kids.
- September 2022: Vitasoy launched a plant-based milk range Plant+, which includes oat and almond milk varieties with zero cholesterol, low sugar, and high calcium.
- September 2022: Vitasoy launched the Vitasoy Plant+ range of plant milk in the Singaporean market. These plant-based milk products are available in almond, oat, and soy varieties and are high in calcium and low in sugar with zero cholesterol.


Asia-Pacific Non-Dairy Milk Market Report Scope
Almond Milk, Cashew Milk, Coconut Milk, Hazelnut Milk, Hemp Milk, Oat Milk, Soy Milk are covered as segments by Product Type. Off-Trade, On-Trade are covered as segments by Distribution Channel. Australia, China, India, Indonesia, Japan, Malaysia, New Zealand, Pakistan, South Korea are covered as segments by Country.| Oat Milk |
| Hemp Milk |
| Hazelnut Milk |
| Soy Milk |
| Almond Milk |
| Coconut Milk |
| Cashew Milk |
| Flavored |
| Un-Flavored |
| PET Bottles |
| Cans |
| Cartons |
| Others |
| Off-Trade | Convenience Stores |
| Online Retail | |
| Specialist Retailers | |
| Supermarkets and Hypermarkets | |
| Others (Warehouse clubs, gas stations, etc.) | |
| On-Trade |
| Australia |
| China |
| India |
| Indonesia |
| Japan |
| Malaysia |
| New Zealand |
| Pakistan |
| South Korea |
| Rest of Asia Pacific |
| Product Type | Oat Milk | |
| Hemp Milk | ||
| Hazelnut Milk | ||
| Soy Milk | ||
| Almond Milk | ||
| Coconut Milk | ||
| Cashew Milk | ||
| Flavor | Flavored | |
| Un-Flavored | ||
| Packaging Type | PET Bottles | |
| Cans | ||
| Cartons | ||
| Others | ||
| Distribution Channel | Off-Trade | Convenience Stores |
| Online Retail | ||
| Specialist Retailers | ||
| Supermarkets and Hypermarkets | ||
| Others (Warehouse clubs, gas stations, etc.) | ||
| On-Trade | ||
| Country | Australia | |
| China | ||
| India | ||
| Indonesia | ||
| Japan | ||
| Malaysia | ||
| New Zealand | ||
| Pakistan | ||
| South Korea | ||
| Rest of Asia Pacific | ||


Market Definition
- Dairy Alternatives - Dairy alternatives are foods that are made from plant-based milk/oils instead of their usual animal products, such as cheese, butter, milk, ice cream, yogurt, etc. Plant-based or non-dairy milk alternative is the fast-growing segment in the newer food product development category of functional and specialty beverage across the globe.
- Non-Dairy Butter - Non dairy butter is a vegan butter alternative that is made from a mixture of plant oils. With an increase in alternative diets like vegetarianism, veganism, and gluten intolerance, plant butter is a healthy non-dairy substitute for normal butter.
- Non-Dairy Ice Cream - Plant based ice cream is a growing category. Non-dairy ice cream is a type of dessert made without any animal ingredients. This is typically considered a substitute for regular ice cream for those who cannot or do not eat animal or animal-derived products, including eggs, milk, cream, or honey.
- Plant-Based Milk - Plant based milks are milk substitutes that are made from nuts (e.g., hazelnuts, hemp seeds), seeds (e.g., sesame, walnuts, coconuts, cashews, almonds, rice, oats, etc.) or legumes (e.g., soy). Plant-based milk such as soy milk and almond milk have been popular in East Asia and the Middle East for centuries.
| Keyword | Definition |
|---|---|
| Cultured Butter | Cultured butter is prepared by having the raw butter go through chemical processing and has been added with certain emulsifiers and foreign ingredients. |
| Uncultured Butter | This type of butter is one which has not been processed in any way |
| Natural Cheese | The type of cheese in its most natural form. It is made from natural and simple products and ingredients, including fresh and natural salts, natural colors, enzymes, and high-quality milk. |
| Processed Cheese | Processed cheese undergoes the same processes as natural cheese; however, it requires more steps and many different forms of ingredients. Making processed cheese involves melting natural cheese, emulsifying it, and adding preservatives and other artificial ingredients or colorings. |
| Single Cream | Single cream contains around 18% fat. It’s a single layer of cream that appears over boiled milk. |
| Double Cream | Double cream contains 48% fat, more than double the amount of fat of single cream. It’s heavier and thicker than single cream |
| Whipping Cream | This has a much higher fat percentage than single cream (36%). Used to top cakes, pies, and puddings and as a thickener for sauces, soups, and fillings. |
| Frozen Desserts | Desserts that are meant to be eaten in frozen condition. E.g., sherbets, sorbets, frozen yogurts |
| UHT Milk (Ultra-high temperature milk) | Milk heated at a very high temperature. Ultra-high-temperature processing (UHT) of milk involves heating for 1–8 sec at 135–154°C. which kills the spore-forming pathogenic microorganism, resulting in a product with a shelf-life of several months. |
| Non-dairy butter/Plant-based butter | Butter made from plant-derived oil such as coconut, palm, etc. |
| Non-dairy Yogurt | Yogurt made from typically made from nuts, like almonds, cashews, coconuts, and even other foods like soybeans, plantains, oats, and peas |
| On-trade | It refers to restaurants, QSRs, and bars. |
| Off-trade | It refers to supermarkets, hypermarkets, on-line channels, etc. |
| Neufchatel cheese | One of the oldest kinds of cheese in France. It is a soft, slightly crumbly, mold-ripened, bloomy-rind cheese made in the Neufchâtel-en-Bray region of Normandy. |
| Flexitarian | It refers to a consumer preferring a semi-vegetarian diet, that is centered on plant foods with limited or occasional inclusion of meat. |
| Lactose Intolerance | Lactose intolerance is a reaction in digestive system to lactose, the sugar in milk. It causes uncomfortable symptoms in response to the consumption of dairy products. |
| Cream Cheese | Cream cheese is a soft and creamy fresh cheese with a tangy taste made from milk and cream. |
| Sorbets | Sorbet is a frozen dessert made using ice combined with fruit juice, fruit purée, or other ingredients, such as wine, liqueur, or honey. |
| Sherbet | Sherbet is a sweetened frozen dessert made with fruit and some sort of dairy product such as milk or cream. |
| Shelf stable | Foods that can be safely stored at room temperature, or "on the shelf," for at least one year and do not have to be cooked or refrigerated to eat safely. |
| DSD | Direct Store Delivery is the process in supply chain management wherein the product is delivered from manufacturing plant directly to the retailer. |
| OU Kosher | Orthodox Union Kosher is a kosher certification agency based in New York City. |
| Gelato | Gelato is a frozen creamy dessert made with milk, heavy cream and sugar. |
| Grass-fed Cows | Grass-fed cows are allowed to graze in pastures, where they eat a variety of grasses and clover. |


Research Methodology
Mordor Intelligence follows a four-step methodology in all our reports.
- Step-1: Identify Key Variables: In order to build a robust forecasting methodology, the variables and factors identified in Step 1 are tested against available historical market numbers. Through an iterative process, the variables required for market forecast are set, and the model is built on the basis of these variables.
- Step-2: Build a Market Model: Market-size estimations for the forecast years are in nominal terms. Inflation is not a part of the pricing, and the average selling price (ASP) is kept constant throughout the forecast period for each country.
- Step-3: Validate and Finalize: In this important step, all market numbers, variables, and analyst calls are validated through an extensive network of primary research experts from the market studied. The respondents are selected across levels and functions to generate a holistic picture of the market studied.
- Step-4: Research Outputs: Syndicated Reports, Custom Consulting Assignments, Databases & Subscription Platforms


