Hard Disk Drive (HDD) Market Size and Share
Market Overview
| Study Period | 2020 - 2031 |
|---|---|
| Forecast Data Period | 2026 - 2031 |
| Historical Data Period | 2020 - 2024 |
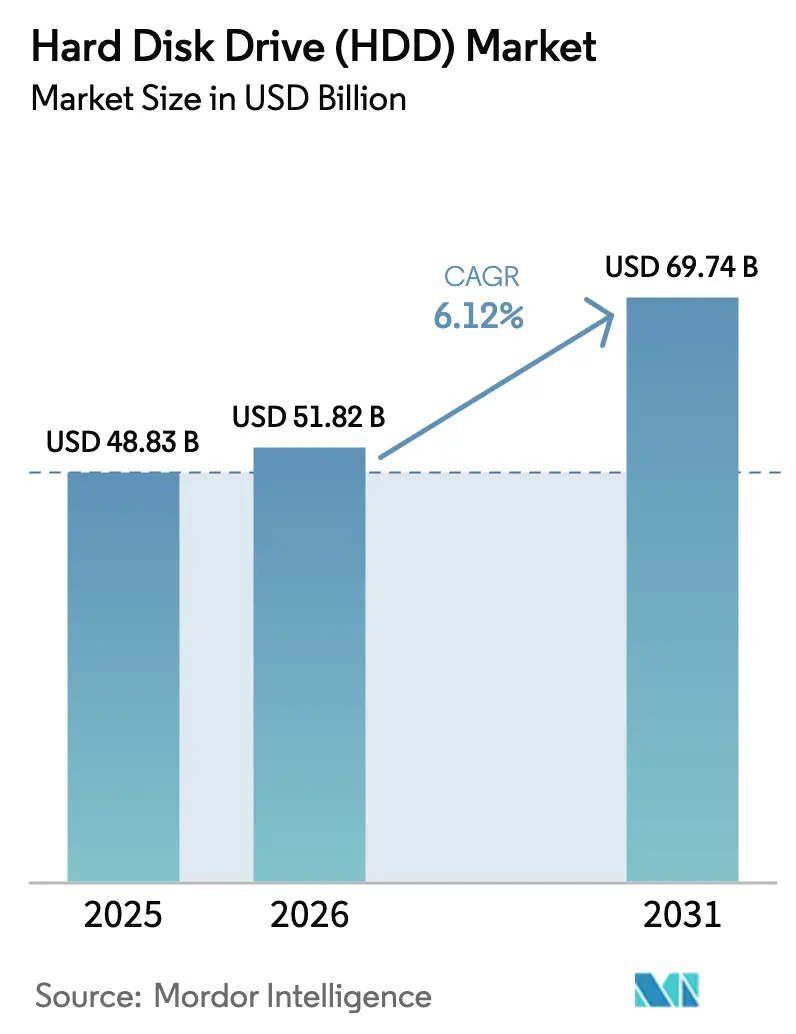
| Market Size (2026) | USD 51.82 Billion |
| Market Size (2031) | USD 69.74 Billion |
| Growth Rate (2026 - 2031) | 6.12% CAGR |
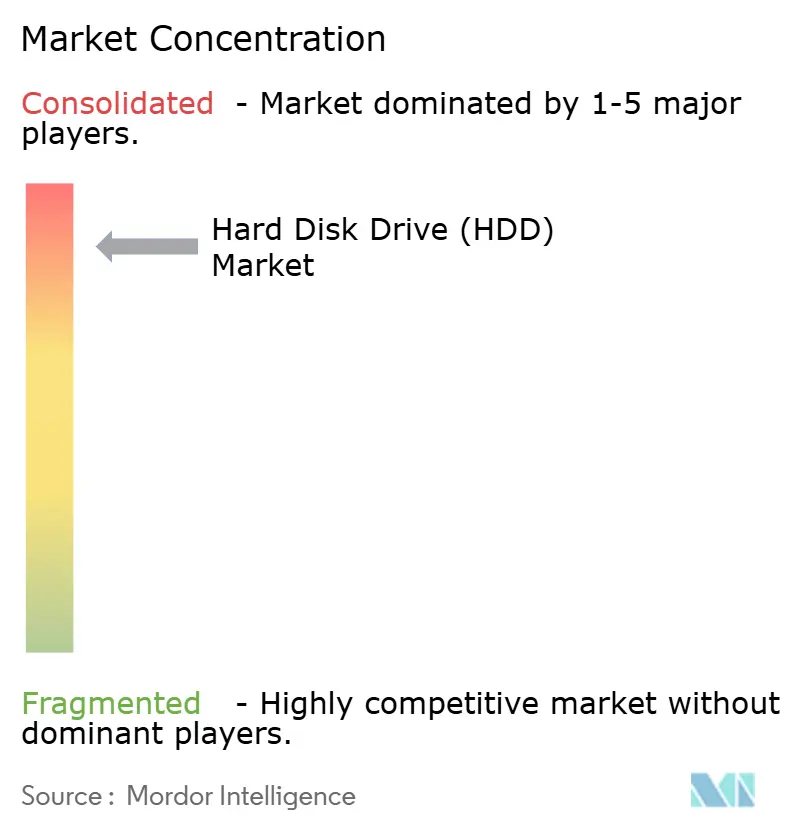
| Market Concentration | High |
Major Players
*Disclaimer: Major Players sorted in no particular order Image © Mordor Intelligence. Reuse requires attribution under CC BY 4.0. |
|
Hard Disk Drive (HDD) Market Analysis by Mordor Intelligence
Hard Disk Drive market size in 2026 is estimated at USD 51.82 billion, growing from 2025 value of USD 48.83 billion with 2031 projections showing USD 69.74 billion, growing at 6.12% CAGR over 2026-2031. Cost-per-terabyte advantages, HAMR-driven capacity roadmaps that point to 100 TB and beyond, and the explosion of AI-generated cold data keep hard drives central to hyperscale storage strategies. Near-line enterprise deployments expand as cloud providers allocate roughly 15–20% of their record USD 315 billion 2025 capital budgets to storage infrastructure, while energy-per-terabyte metrics sustain demand in power-constrained data-center markets[1]Investor Relations Team, “FY 2024 10-K,” Western Digital Corporation, wdc.com . Interface trends reveal SATA’s broad installed base, yet SAS and emerging NVMe pathways gain momentum where higher bandwidth is essential. Supply dynamics remain delicate because three suppliers control nearly all output; any disruption, from trade friction to natural disasters, propagates quickly through the Hard Disk Drive market [WESTERN DIGITAL.COM]. At the same time, regional manufacturing incentives in Asia-Pacific and North America are rewriting production footprints and favoring near-shoring of final assembly for mission-critical enterprise orders.
Key Report Takeaways
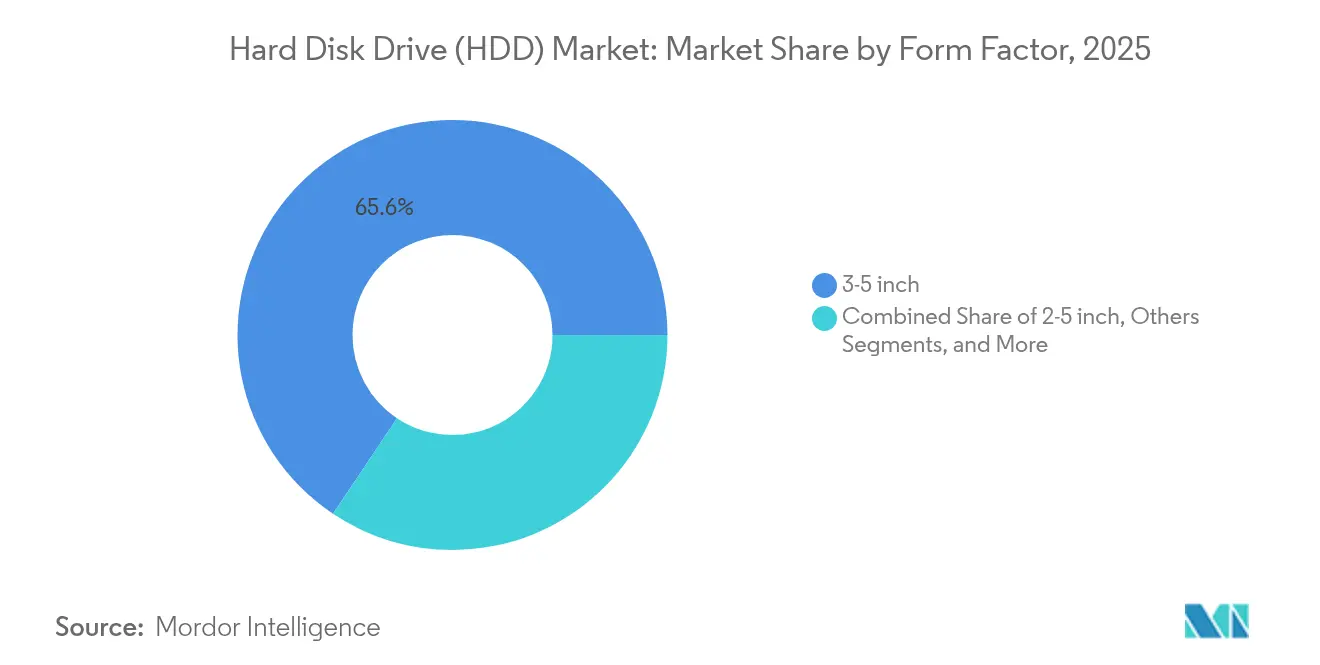
- By form factor, 3.5-inch drives led with 65.62% revenue share in 2025; the segment is advancing at a 9.29% CAGR through 2031.
- By application, near-line enterprise captured 44.10% of the Hard Disk Drive market share in 2025 and is expanding at a 9.52% CAGR through 2031.
- By storage capacity, drives above 10 TB delivered the fastest growth at a 13.14% CAGR, while capacities above 5 TB accounted for 54.40% of 2025 shipments.
- By interface, SAS posted the highest projected growth at a 12.06% CAGR to 2031 while SATA retained 67.55% share in 2025.
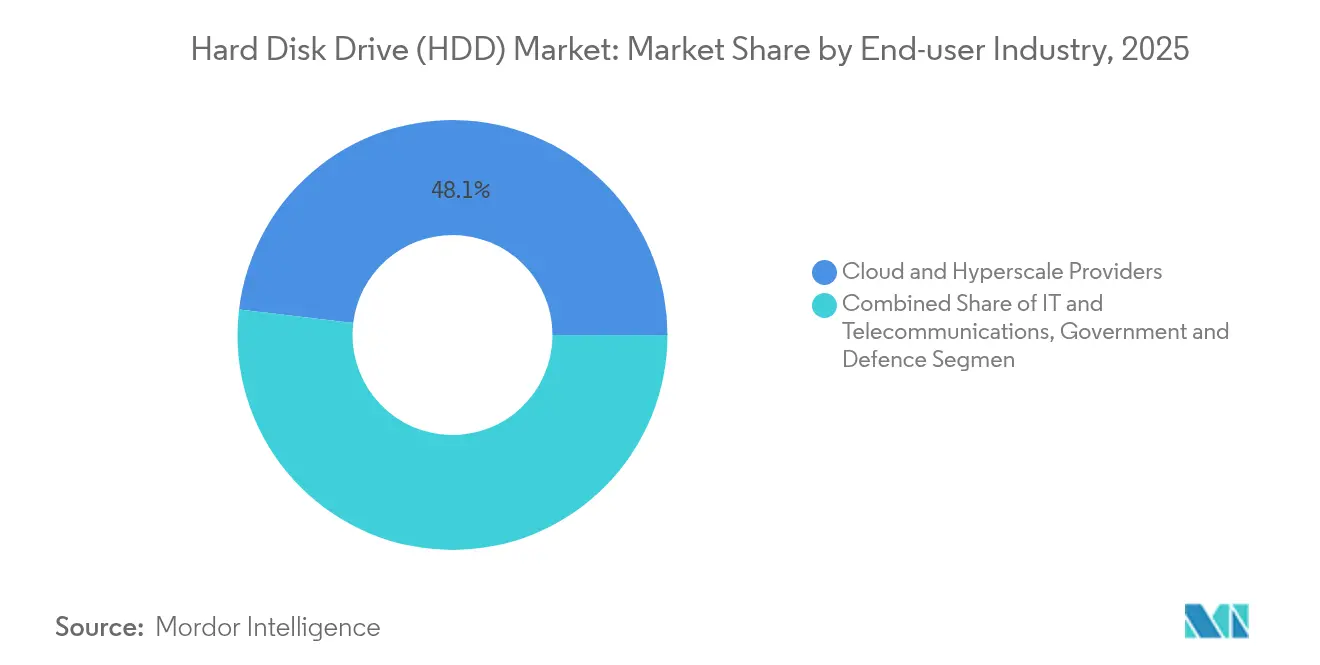
- By end-user, cloud and hyperscale operators represented 48.10% of 2025 demand and are forecast to grow at an 11.42% CAGR through 2031.
- By recording technology, HAMR is the fastest-growing category at a 16.98% CAGR, although CMR still held 56.45% share in 2025.
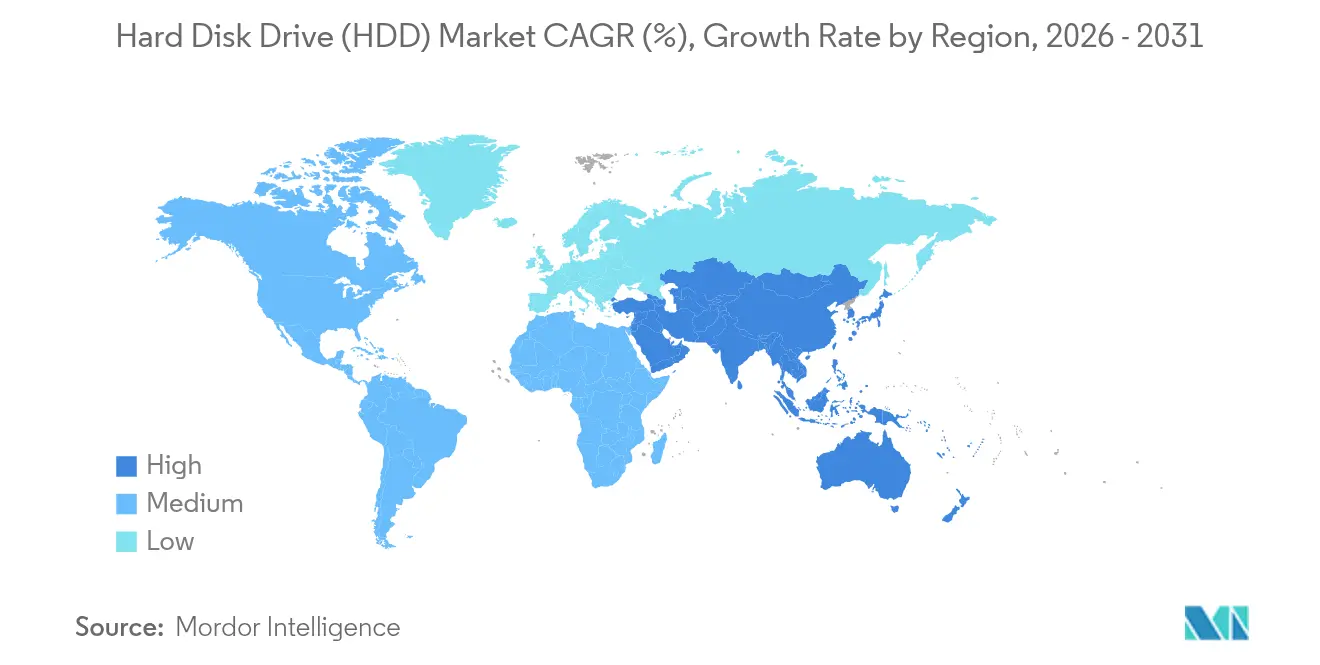
- Asia-Pacific dominated regional revenue with 36.10% in 2025 and is tracking a 6.84% CAGR to 2031.
- Seagate, Western Digital, and Toshiba collectively accounted for more than 95% of global shipments in 2025.
Note: Market size and forecast figures in this report are generated using Mordor Intelligence’s proprietary estimation framework, updated with the latest available data and insights as of 2026.
Global Hard Disk Drive (HDD) Market Trends and Insights
Drivers Impact Analysis*
| Driver | (~) % Impact on CAGR Forecast | Geographic Relevance | Impact Timeline |
|---|---|---|---|
| Hyperscale and cloud capacity build-out | +2.1% | Global (APAC and North America lead) | Long term (≥ 4 years) |
| Cost-per-terabyte edge over SSDs in near-line workloads | +1.8% | Global enterprise segments | Medium term (2-4 years) |
| Video-surveillance data growth in smart-city roll-outs | +1.2% | APAC core; MEA and Latin America follow | Medium term (2-4 years) |
| AI-driven cold-data tiering adoption | +1.4% | Global, concentrated in hyperscale regions | Long term (≥ 4 years) |
| Large-capacity HAMR roadmap to 50 TB | +0.8% | Global enterprise and hyperscale | Long term (≥ 4 years) |
| Circular-economy recycling programs | +0.4% | North America and EU | Medium term (2-4 years) |
| Source: Mordor Intelligence | |||


Rising Demand for Hyperscale and Cloud Storage Capacity
Hyperscale data-center count reached 1,136 at year-end 2024 and is projected to triple by 2030 as AI accelerators reshape computing footprints. Storage represents roughly one-fifth of the 2025 capex plans of major cloud operators, channeling billions into very-large-capacity racks that favor the Hard Disk Drive market for cold-tier deployments. Exabyte shipments of HDDs are forecast by Western Digital to grow at 23% between 2024 and 2028, driven primarily by HAMR-enabled density gains. The United States holds 54% of installed hyperscale capacity, yet local power constraints reward drives that deliver superior watts-per-terabyte performance. Disaggregated architectures now separate compute from storage, letting HDDs handle vast cold data pools while SSDs manage hot data access.
Cost/TB Advantage Over SSDs in Near-line Workloads
Seagate reported achieving USD 15 per terabyte across 398 exabytes shipped in fiscal 2024, preserving an estimated 2.5× cost gap against enterprise SSDs. At 30 TB capacity points, the price delta widens to roughly 3–4×, reinforcing the Hard Disk Drive market in cost-sensitive cold-data tiers. Flash manufacturers continue lowering dollars-per-terabyte through 3D NAND scaling, yet endurance and write-cost constraints keep total-cost-of-ownership favorable to drives for sequential-heavy workloads. Enterprise buyers increasingly articulate hybrid strategies that blend high-performance SSD tiers with large pools of HDD capacity to optimize spend and service-level objectives.
Growth of Video-Surveillance Data for Smart-City Roll-outs
Smart-city initiatives across Asia-Pacific mandate continuous, high-resolution video capture that can exceed petabytes per municipality each year. Western Digital’s WD Purple Pro line now reaches 26 TB with annual workload ratings of 550 TB, satisfying 24 × 7 recording under harsh environmental profiles. SMR technology amplifies capacity by roughly 25% compared with CMR for sequential write streams typical of surveillance. Municipalities in Malaysia and Thailand are investing billions in smart infrastructure, creating a sustained pipeline for multi-drive NVRs and centralized archival arrays. AI-enabled analytics further increase retention windows because raw footage must be stored alongside inference metadata for compliance verification.
AI-Driven Cold-Data Tiering Adoption
McKinsey projects that cold data could account for 80% of all digital storage by 2025, a by-product of exponential AI model training and inferencing datasets. Enterprise SSD consumption is expanding at a 35% CAGR, but that footprint still targets active, latency-sensitive workloads, leaving vast archives for HDDs. AI governance policies require reproducibility, so intermediate training artifacts are retained for years, aligning with cost-optimized tiers. IBM research confirms HDDs deliver a lower carbon footprint than SSDs for archival horizons, adding a sustainability argument for tiered architectures[2]Research Blog, “Sustainability in Data Storage,” IBM Research, ibm.com. Automated lifecycle management now migrates bits between NVMe flash and high-capacity disks based on real-time access patterns, strengthening the Hard Disk Drive market’s long-term outlook.
Restraints Impact Analysis*
| Restraint | (~) % Impact on CAGR Forecast | Geographic Relevance | Impact Timeline |
|---|---|---|---|
| Rapid SSD $/TB declines and flash TCO gains | -1.6% | Global enterprise and consumer | Short term (≤ 2 years) |
| Extreme supplier concentration and supply-chain shocks | -0.9% | Global, manufacturing in APAC | Short term (≤ 2 years) |
| Prospective carbon taxes on energy-intensive HDD output | -0.3% | EU and North America | Long term (≥ 4 years) |
| Rack-density limits that favor flash | -0.7% | Global data-center markets | Medium term (2-4 years) |
| Source: Mordor Intelligence | |||
Rapid SSD $/TB Declines and Enterprise Flash TCO Gains
Flash vendors now produce 232-layer 3D NAND, pushing bit costs lower each quarter. Pure Storage’s design wins at hyperscalers highlight scenarios where flash achieves compelling total cost when energy, cooling, and floor space savings are lumped into the equation. The arrival of 61.44 TB enterprise SSDs signals capacity convergence, albeit at a premium price. QLC NAND promises further dollar-per-bit gains, yet endurance constraints confine such products to read-heavy workloads. As corporate buyers increasingly adopt a holistic procurement lens, HDDs must continue to elevate capacity faster than flash narrows its cost gap.
Extreme Supplier Concentration and Supply-Chain Shocks
Seagate, Western Digital, and Toshiba together control more than 95% of volumes, creating a brittle supply chain when a single factory incident can remove a double-digit portion of global output. Western Digital’s April 2024 notice of constrained supply triggered allocation protocols and revealed how quickly pricing can swing when inventories tighten. Tariffs of 25–34% on certain Asian manufacturing routes add cost volatility, prompting vendors to examine assembly relocation to Mexico or the United States. High barriers to entry—precision tooling, tribology expertise, and multi-billion-dollar fabs—discourage new players, so consolidation risk remains an enduring restraint on the Hard Disk Drive market.
*Our forecasts treat driver/restraint impacts as directional, not additive. The impact forecasts reflect baseline growth, mix effects, and variable interactions.
Segment Analysis
By Form Factor: Enterprise Density Drives 3.5-Inch Dominance
3.5-inch units delivered 65.62% revenue in 2025, outpacing the overall Hard Disk Drive market with a 9.29% CAGR to 2031. Their large platters enable superior gigabytes-per-rack metrics, critical for hyperscale operators that price floor space in thousands of dollars per square foot. The Hard Disk Drive market size for 3.5-inch products is projected to eclipse USD 45.2 billion by 2031. HAMR and UltraSMR advances let vendors roadmap 40 TB on the same envelope, reinforcing the segment’s scale economics.
Smaller 2.5-inch drives cater to notebooks and compact servers but face SSD substitution, limiting growth prospects. Sub-1.8-inch form factors occupy niche consumer electronics and industrial gear. High-density JBOD chassis relying on 3.5-inch platforms retain cost leadership in cold-tier architectures because fewer spindles meet exabyte targets. Seagate’s recent Japan launch of 20 TB and 24 TB BarraCuda SKUs at consumer-friendly pricing underscores continued investment in the high-capacity 3.5-inch roadmap.


By Application: Near-Line Enterprise Captures AI Storage Demand
Near-line enterprise environments garnered 44.10% of 2025 shipments and will grow at a 9.52% CAGR, the fastest among major workloads. Cloud architects funnel expanding AI training sets onto low-cost, high-density tiers, keeping the Hard Disk Drive market central to petabyte-scale clusters. The Hard Disk Drive market share for near-line roles benefits from the cold-data swell forecast by McKinsey, which aligns with drives’ sequential write and economical retention strengths.
Consumer desktop and gaming PCs move steadily to SSD, trimming unit demand for entry drives below 1 TB. Surveillance arrays and NAS devices remain resilient because write patterns and capacity needs suit magnetic media. Enterprise data-center teams continue adopting disaggregated models where SSD and HDD coexist, but the near-line layer commands the highest absolute exabyte growth through the decade.
By Storage Capacity: Ultra-High Capacity Drives Accelerate
Shipments above 5 TB formed 54.40% of the 2025 unit mix, while devices exceeding 10 TB are rising at a 13.14% CAGR through 2031. The Hard Disk Drive market size for >10 TB capacity points aligns tightly with hyperscale rack-design refresh cycles that target lower watts-per-terabyte. Seagate’s HAMR roadmap targets 50 TB single drives before 2031, extending to 100 TB by the early 2030s.
Sub-1 TB drives tumble as SSD price curves cross critical thresholds in retail channels. The 1-3 TB band persists for replacement in legacy enterprise arrays and price-sensitive emerging economies. Western Digital’s ePMR and UltraSMR families offer interim density hikes-32 TB on CMR class platters-easing migration for operators that cannot yet certify HAMR within existing supply chains.
By Interface: SAS Growth Signals Enterprise Performance Migration
SATA accounted for 67.55% shipments in 2025 because of its entrenched presence in legacy gear and consumer PCs. Yet SAS is challenging that lead with a 12.06% CAGR through 2031 as enterprises consolidate mixed workloads onto fewer, faster ports. The Hard Disk Drive market size tied to SAS implementations will surpass USD 21.4 billion by the end of the forecast window.
NVMe discussions once centered solely on flash, but Seagate and NVIDIA are co-developing NVMe HDD prototypes that promise to slash protocol latency while preserving cost advantages. Dual-port SAS and multi-link NVMe pathways deliver bandwidth scalability matching modern CPU PCIe lanes, which is vital for AI pipelines that back-read terabytes during training epochs. SATA continues serving archival and consumer replacement needs but will gradually cede ground where throughput matters.
By End-User Industry: Cloud Providers Drive Market Evolution
Cloud and hyperscale operators claimed 48.10% of 2025 demand and are growing at 11.42% CAGR, reflecting their massive concentration of compute and storage capital. These buyers purchase directly from ODMs and negotiate technology roadmaps with manufacturers, placing them at the center of HAMR qualification cycles. Telecommunications and IT service firms maintain robust refresh schedules yet trail hyperscale volume.
Industrial and video-surveillance deployments rise on the back of smart-city roll-outs, while consumer electronics OEMs witness continued cannibalization by SSD modules. Government and defense niches procure hardened or FIPS-certified drives, prioritizing security over raw cost. The Hard Disk Drive industry finds its highest pricing leverage in specialized verticals where certification barriers limit substitution.
By Recording Technology: HAMR Emergence Reshapes Competitive Landscape
CMR still led with 56.45% of 2025 units, but HAMR is the clear growth engine at 16.98% CAGR. Seagate’s USD 119 million acquisition of Intevac in March 2025 accelerates head-laser advances, enabling exabyte deployments already inside tier-one cloud data centers. Western Digital’s December 2024 confirmation of commercial HAMR shipment in 2025 illustrates industry alignment.
SMR remains relevant for write-once, read-often environments such as surveillance or backup. Energy-assisted variants like ePMR deliver incremental gains without massive firmware upheaval, offering operators a bridge until HAMR maturity. As capacities climb past 50 TB, platter count and spindle power envelopes remain largely unchanged, sustaining the Hard Disk Drive market against flash incursions on rack-density grounds.
Geography Analysis
Asia-Pacific commanded 36.10% of global revenue in 2025 and is growing at a 6.84% CAGR through 2031. China and Japan anchor regional demand through hyperscale build-outs and domestic OEM shipments, while Thailand continues as a manufacturing hub with Western Digital’s USD 693 million expansion approved in August 2024. India’s retail drive volumes expanded 12% quarter-over-quarter in Q2 2024 as e-commerce and home-office trends persisted. Smart-city budgets across Southeast Asia, including Malaysia’s USD 17 billion data-center and surveillance programs, intensify regional exabyte uptake.
North America is the second-largest territory, propelled by U.S. hyperscale operators that hold 54% of installed cloud capacity. Trade-policy headwinds inject cost uncertainty, though proposed incentives encourage domestic assembly that could shorten supply chains. Growing power-grid constraints around Virginia’s data-center corridor steer architects toward watts-per-terabyte efficiencies that favor the Hard Disk Drive market versus all-flash arrays. Canada and Mexico play supportive roles by providing land, renewable electricity, and cross-border logistics advantages.
Europe maintains consistent enterprise replacement cycles amid stringent data-sovereignty mandates. Germany and the United Kingdom deploy cold-tier clusters to meet compliance retention windows, while France expands public-sector cloud workloads. The region’s circular-economy focus dovetails with vendor recycling programs, such as Western Digital’s recovery of rare-earth elements from 50,000 pounds of retired drives in 2024. Long-term carbon tax discussions may influence recording-technology choices as HDD makers showcase lower lifecycle CO2 than competing storage media.

Competitive Landscape
Top Companies in Hard Disk Drive Market
Seagate, Western Digital, and Toshiba collectively supply virtually the entire market, granting them scaling efficiencies and pricing leverage. Their oligopolistic structure lets them synchronize node transitions, evident in simultaneous HAMR commercialization roadmaps. Seagate’s integration of Intevac lasers positions it for first-mover capacity records, while Western Digital pursues internally developed heat-assisted heads aimed at 100 TB milestones. Toshiba differentiates through SMR firmware optimization and targeted surveillance models.
Technology partnerships intensify. Seagate’s collaboration with NVIDIA on NVMe HDDs seeks to blend lower protocol latency with traditional disk economics[4]Press Release, “NVIDIA and Seagate to Develop NVMe HDDs,” NVIDIA Corporation, nvidia.com . Western Digital teams with cloud titans to co-design rack architectures that maximize airflow and platter counts per enclosure. Sony’s joint R&D initiative with Seagate on 30 TB laser-assisted drives illustrates cross-industry pooling of optics and magnetic expertise.
Sustainability is emerging as a competitive vector. Western Digital’s material-recovery program and Seagate’s focus on energy-efficient motors resonate with enterprises evaluating ESG scorecards alongside TCO. Supply-chain resilience is another battleground; manufacturers diversify factory footprints to buffer geopolitical risks, with Mexico and India surfacing as optional assembly sites. Despite extreme concentration, niche opportunities remain—for instance, icy rugged drives for edge-compute deployments where vibration and temperature extremes preclude flash.
Hard Disk Drive (HDD) Industry Leaders
-
Western Digital Corporation
-
Hewlett Packard Enterprise Development LP
-
Toshiba Corporation
-
Dell Technologies Inc.
-
Lenovo Group Limited
- *Disclaimer: Major Players sorted in no particular order

Recent Industry Developments
- January 2025: Seagate completed the acquisition of Intevac for USD 119 million, accelerating HAMR commercialization.
- December 2024: Western Digital announced its first commercial HAMR drives for 2025 shipment windows.
- November 2024: Toshiba confirmed SMR optimizations that promise 25% capacity gains for 2025 releases.
- October 2024: Seagate launched 20 TB and 24 TB BarraCuda drives in Japan at aggressive consumer price points.
- September 2024: Sony and Seagate revealed joint development of 30 TB laser-assisted enterprise drives with USD 33 million funding.


Global Hard Disk Drive (HDD) Market Report Scope
Hard disk drives (HDDs) are data storage devices used in computers and other electronic devices. They consist of one or more magnetic disks or platters coated with a magnetic material. HDDs provide non-volatile storage, retaining data even when powered off.
The hard disk drive (HDD) market is segmented by form factor (2.5 inch and 3.5 inch and others), application (mobile, consumer, desktop, enterprise, nearline, and other applications), and geography (United States, China, Taiwan, South Korea, Japan, Southeast Asia, and Rest of the World).
The report offers market forecasts and size in value (USD) and volume (units) for all the above segments.
| 2.5-inch |
| 3.5-inch |
| Others (<1.8-inch, Enterprise JBOD) |
| Mobile/Portable |
| Consumer Desktop and Gaming |
| NAS and SOHO |
| Enterprise and Data-Center |
| Near-line / Cold-Data |
| Surveillance and Smart-City |
| <1 TB |
| 1 – 3 TB |
| 3 – 5 TB |
| >5 TB |
| SATA |
| SAS |
| PCIe / NVMe (U.2, U.3) |
| IT and Telecommunications |
| Consumer Electronics OEMs |
| Cloud and Hyperscale Providers |
| Industrial and Video-Surveillance |
| Government and Defence |
| CMR / PMR |
| SMR |
| HAMR and Energy-Assisted |
| North America | United States | |
| Canada | ||
| Mexico | ||
| Europe | Germany | |
| United Kingdom | ||
| France | ||
| Russia | ||
| Rest of Europe | ||
| Asia-Pacific | China | |
| Japan | ||
| India | ||
| South Korea | ||
| Australia | ||
| Rest of Asia-Pacific | ||
| Middle East and Africa | Middle East | Saudi Arabia |
| United Arab Emirates | ||
| Rest of Middle East | ||
| Africa | South Africa | |
| Egypt | ||
| Rest of Africa | ||
| South America | Brazil | |
| Argentina | ||
| Rest of South America | ||
| By Form Factor | 2.5-inch | ||
| 3.5-inch | |||
| Others (<1.8-inch, Enterprise JBOD) | |||
| By Application | Mobile/Portable | ||
| Consumer Desktop and Gaming | |||
| NAS and SOHO | |||
| Enterprise and Data-Center | |||
| Near-line / Cold-Data | |||
| Surveillance and Smart-City | |||
| By Storage Capacity | <1 TB | ||
| 1 – 3 TB | |||
| 3 – 5 TB | |||
| >5 TB | |||
| By Interface | SATA | ||
| SAS | |||
| PCIe / NVMe (U.2, U.3) | |||
| By End-User Industry | IT and Telecommunications | ||
| Consumer Electronics OEMs | |||
| Cloud and Hyperscale Providers | |||
| Industrial and Video-Surveillance | |||
| Government and Defence | |||
| By Recording Technology | CMR / PMR | ||
| SMR | |||
| HAMR and Energy-Assisted | |||
| By Geography | North America | United States | |
| Canada | |||
| Mexico | |||
| Europe | Germany | ||
| United Kingdom | |||
| France | |||
| Russia | |||
| Rest of Europe | |||
| Asia-Pacific | China | ||
| Japan | |||
| India | |||
| South Korea | |||
| Australia | |||
| Rest of Asia-Pacific | |||
| Middle East and Africa | Middle East | Saudi Arabia | |
| United Arab Emirates | |||
| Rest of Middle East | |||
| Africa | South Africa | ||
| Egypt | |||
| Rest of Africa | |||
| South America | Brazil | ||
| Argentina | |||
| Rest of South America | |||


Key Questions Answered in the Report
What is the forecast growth rate for the Hard Disk Drive market to 2031?
The market is projected to expand at a 6.12% CAGR, rising from USD 51.82 billion in 2026 to USD 69.74 billion in 2031.
Which form factor generates the largest revenue?
The 3.5-inch category delivered 65.62% of 2025 revenue and is growing at a 9.29% CAGR as hyperscale operators prioritize capacity density.
How quickly will HAMR technology grow?
HAMR shipments are forecast to increase at a 16.98% CAGR through 2031 as both Seagate and Western Digital move toward 50 TB-plus capacity milestones.
Which end-user sector buys the most drives?
Cloud and hyperscale operators represented 48.10% of 2025 demand and are forecast to grow at an 11.42% CAGR through 2031.
Why does Asia-Pacific lead regional sales?
The region hosts extensive manufacturing bases and large-scale build-outs in China, Thailand, and India, resulting in a 36.10% revenue share and a 6.84% forecast CAGR.
Page last updated on:


