Market Overview
| Study Period | 2018 - 2031 |
|---|---|
| Forecast Data Period | 2026 - 2031 |
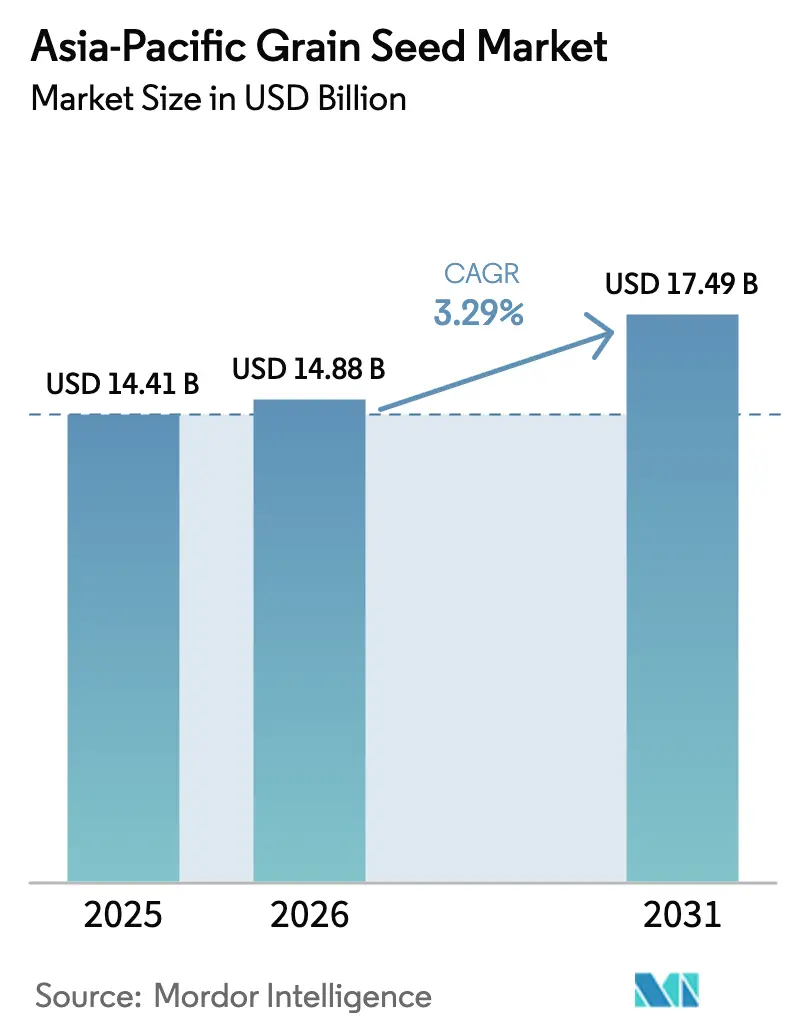
| Base Year Market Size (2025) | USD 14.41 Billion |
| Market Size (2026) | USD 14.88 Billion |
| Market Size (2031) | USD 17.49 Billion |
| Growth Rate (2026 - 2031) | 3.29% CAGR |
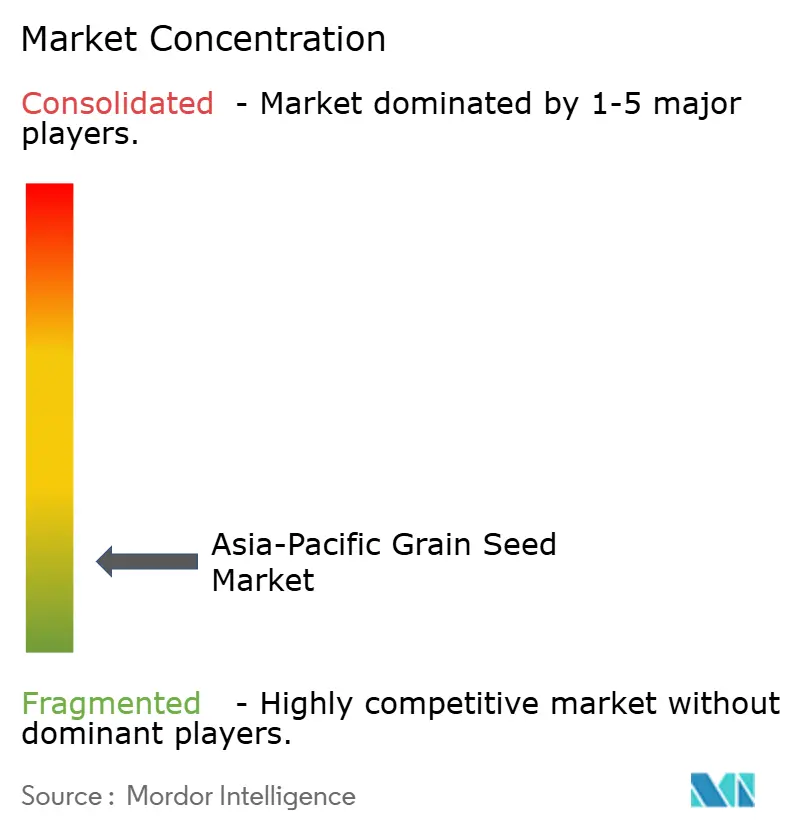
| Market Concentration | Low |
Major Players *Disclaimer: Major Players sorted in no particular order Image © Mordor Intelligence. Reuse requires attribution under CC BY 4.0. | |
Asia-Pacific Grain Seed Market Analysis by Mordor Intelligence
The Asia-Pacific grain seed market size is expected to grow from USD 14.41 billion in 2025 to USD 14.88 billion in 2026 and is forecast to reach USD 17.49 billion by 2031 at 3.29% CAGR over 2026-2031. Robust demand for drought-tolerant hybrids after the 2024 El Niño losses, widening livestock-feed requirements, and steady government seed subsidy programs underpin the expansion. Regional specialists continue to gain ground because farmers favor locally adapted germplasm, while digital platforms that bypass traditional dealer networks compress distribution costs and improve seed authenticity. Nonetheless, evolving biosafety rules and the prevalence of counterfeit seed in frontier markets pose persistent growth constraints.
Key Report Takeaways
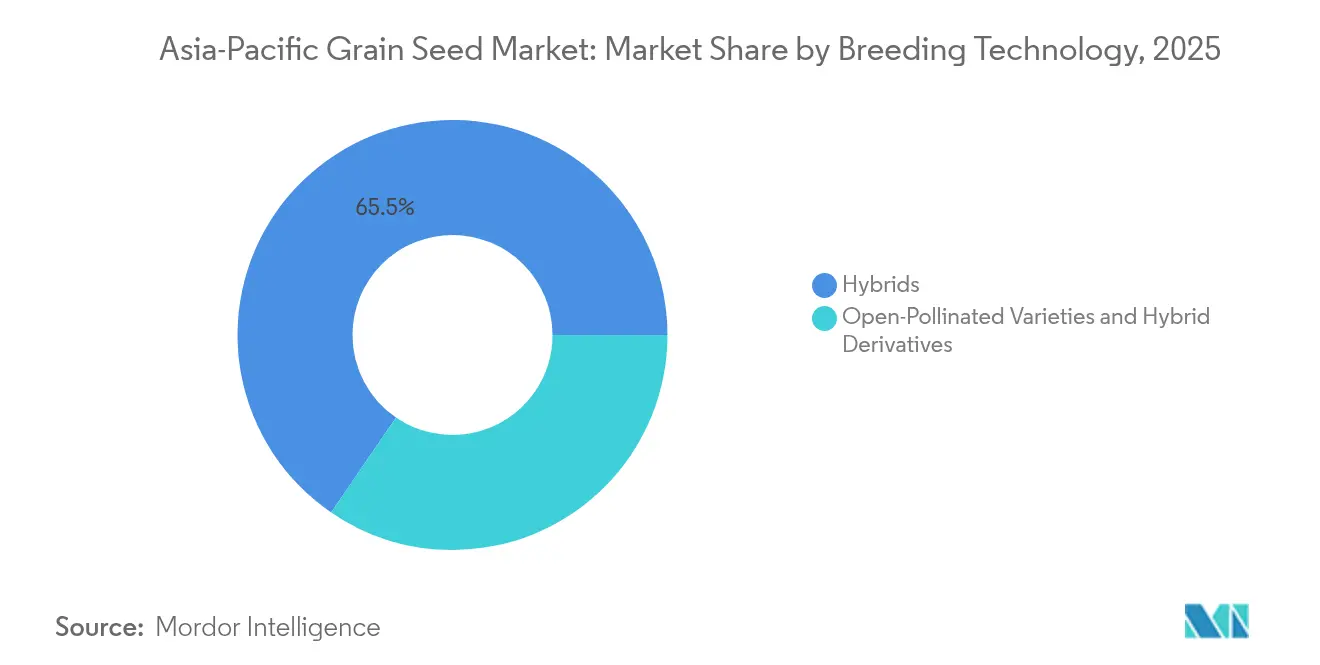
- By breeding technology, hybrids led with 65.45% of the Asia-Pacific grain seed market share in 2025, whereas open-pollinated varieties and hybrid derivatives recorded the fastest 4.06% CAGR through 2031.
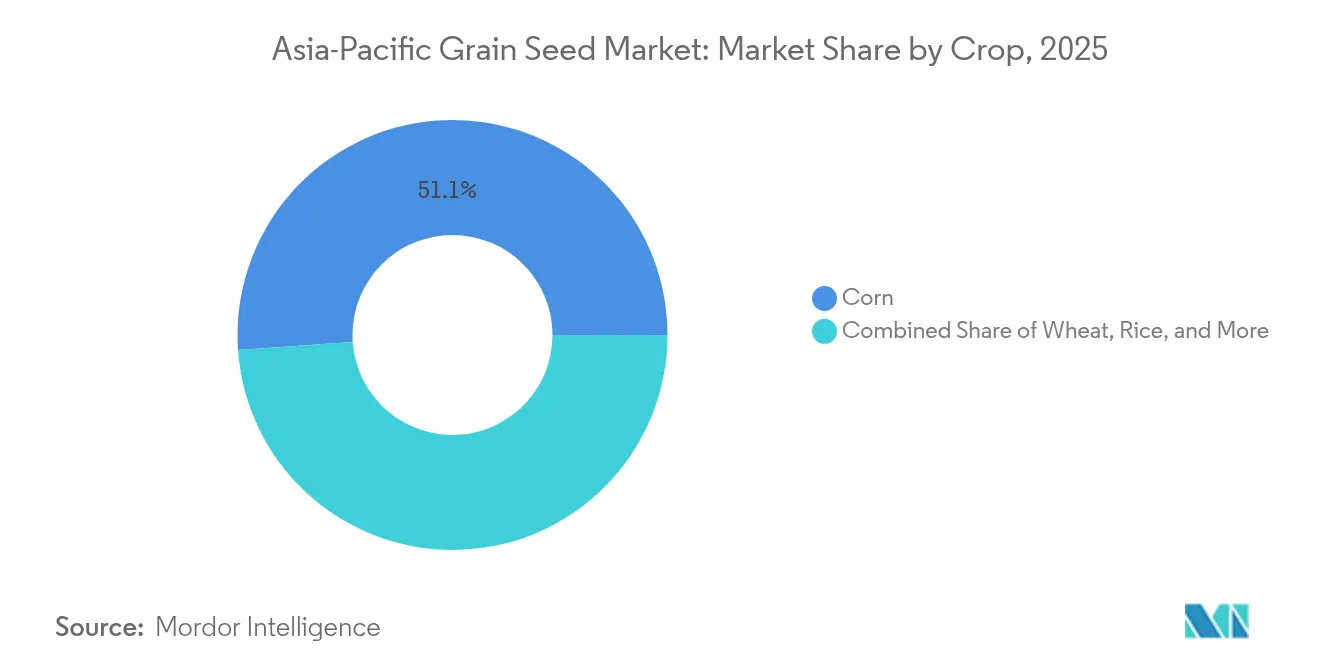
- By crop, corn dominated with a 51.12% revenue share in 2025, while wheat is projected to expand at a 5.53% CAGR to 2031.
- By geography, China held 60.25% of the Asia-Pacific grain seed market size in 2025, and Australia is advancing at an 8.61% CAGR over the forecast horizon.
- The top five suppliers controlled about 20% of the Asia-Pacific grain seed market share in 2024, underscoring fragmented competitive intensity.
Note: Market size and forecast figures in this report are generated using Mordor Intelligence’s proprietary estimation framework, updated with the latest available data and insights as of 2026.
Asia-Pacific Grain Seed Market Trends and Insights
Drivers Impact Analysis*
| Driver | (~) % Impact on CAGR Forecast | Geographic Relevance | Impact Timeline |
|---|---|---|---|
| Favorable seed subsidy programs across Asia-Pacific countries | +0.8% | China, India, Philippines, Indonesia, and Thailand | Medium term (2-4 years) |
| Livestock-feed expansion accelerating corn and sorghum seed demand | +0.6% | China, India, Vietnam, Thailand, and Philippines | Long term (≥ 4 years) |
| Rapid adoption of drought-tolerant hybrids | +0.9% | Philippines, Indonesia, Thailand, Vietnam, and India | Short term (≤ 2 years) |
| Digital-ag commerce platforms shortening dealer networks in Tier-2 rural markets | +0.4% | India, Indonesia, Philippines, Cambodia, and Malaysia | Medium term (2-4 years) |
| Widespread shift to direct-seeded rice creating demand for shorter-duration varieties | +0.7% | India, Philippines, Vietnam, Thailand, and Nepal | Medium term (2-4 years) |
| Growing cross-border rice trade spurring uniform quality standards and certified seed uptake | +0.5% | Vietnam, Thailand, Cambodia, Myanmar, and Philippines | Long term (≥ 4 years) |
| Source: Mordor Intelligence | |||
Favorable seed subsidy programs across Asia-Pacific countries
China’s 2024 corn seed subsidy covered 85% of the planting cost for drought-tolerant hybrids, lifting certified adoption by 18% year on year.[1]Source: China National Development and Reform Commission, “Agricultural Policies and Subsidies,” en.ndrc.gov.cn India’s Pradhan Mantri Fasal Bima Yojana added hybrid rice seeds to its crop-insurance roster, lowering farmer risk and boosting hybrid use. The Philippines allocated PHP 3 billion (USD 53.6 million) to certified seed distribution from its Rice Competitiveness Enhancement Fund, and Indonesia widened subsidies to sorghum and millet for marginal lands.[2]Source: Philippine Statistics Authority, “Palay and Corn Production Survey,” psa.gov.ph Thailand’s Smart Farmer program blended digital extension with input coupons, illustrating a scalable, tech-enabled subsidy model. While these initiatives raise adoption by 15-20% a year, leakage in remote districts still erodes full benefit.
Livestock-Feed Expansion Accelerating Corn and Sorghum Seed Demand
Asia-Pacific feed mills increased corn consumption for animal diets by 8-12% annually in 2024-2025 as swine and poultry production intensified.[3]Source: Food and Agriculture Organization, “Asia-Pacific Regional Overview,” fao.org Vietnam’s pig sector rebound lifted corn seed sales 25%, and India’s poultry growth called for an extra 2.5 million metric tons of grain. Sorghum gained traction in Australia’s mixed systems for its drought resilience and dual feed-plus-cash role. Premium feed manufacturers now contract hybrid corn and sorghum with improved amino-acid profiles, paying 15-30% seed price premiums. These direct contracts create stable, certified seed demand while reducing price volatility for farmers.
Rapid Adoption of Drought-Tolerant Hybrids
The 2024 El Niño wiped out 30% of Philippine rice output and triggered Indonesia’s worst drought in two decades. Seed companies responded with stress-tolerant hybrids, pushing corn hybrid sales up 40% across affected provinces. India released 15 climate-resilient rice varieties under the Climate Resilient Rice initiative. Thailand’s Royal Initiative trials showed 20-35% yield stability gains for drought-tolerant hybrids, bolstering farmer confidence. The crisis also unlocked investment in precision irrigation, reinforcing demand for seeds optimized for deficit moisture regimes.
Digital-Ag Commerce Platforms Shortening Dealer Networks in Tier-2 Rural Markets
Indonesia’s agritech startup Semaai linked more than 50,000 farmers to certified seed suppliers, cutting distribution costs by 20% through blockchain lot tracking. India’s Agribazaar processed USD 2.8 billion in agri-transactions, with seeds among its fastest-growing categories. Cambodia’s FarmByte enabled mobile seed ordering over basic networks, completing 10,000 orders in its launch year. These platforms compress multi-tier dealer chains and raise authenticity, although poor connectivity and a preference for physical inspection still limit uptake in frontier districts.
Restraints Impact Analysis*
| Restraint | (~) % Impact on CAGR Forecast | Geographic Relevance | Impact Timeline |
|---|---|---|---|
| Farmer hesitancy toward GM traits amid evolving biosafety regulations | -0.6% | China, India, Philippines, Indonesia, and Thailand | Long term (≥ 4 years) |
| Counterfeit and brown-bag seed infiltration in Myanmar, Laos and Cambodia | -0.4% | Myanmar, Laos, Cambodia, Pakistan, and Bangladesh | Medium term (2-4 years) |
| Climate-induced pest pressures driving higher seed costs and margin squeeze | -0.8% | Philippines, Indonesia, and India | Short term (≤ 2 years) |
| Rising royalty fees from global multinationals limiting access for SMEs | -0.3% | India, China, Indonesia, Philippines, and Thailand | Long term (≥ 4 years) |
| Source: Mordor Intelligence | |||
Farmer Hesitancy Toward GM Traits Amid Evolving Biosafety Regulations
China’s measured GM approval pace and India’s pending biotech rules sustain uncertainty for transgenic hybrids. Farmers fear market rejection, preferring non-GM hybrids that still deliver yield gains. This caution restrains global multinationals but opens space for regional breeders to develop non-GM stress traits aligned with domestic policies.
Counterfeit and Brown-Bag Seed Infiltration in Myanmar, Laos and Cambodia
Weak enforcement allows counterfeit packets to enter markets, eroding farmer trust and reducing the use of certified seed. Myanmar and Laos see up to 25% unofficial volume in maize, eroding brand premiums and compressing margins for legitimate suppliers. Digital verification via QR codes is emerging, but remains in early pilot stages.
*Our forecasts treat driver/restraint impacts as directional, not additive. The impact forecasts reflect baseline growth, mix effects, and variable interactions.
Segment Analysis
By Breeding Technology: Hybrids Retain Edge as OPVs Regain Relevance
Hybrids contributed 65.45% of the Asia-Pacific grain seed market in 2025, supported by a solid 3.8% premium over conventional lines and 15-20% yield uplift under stress conditions. The Asia-Pacific grain seed market size for hybrids is forecast to expand steadily as governments subsidize climate-resilient traits in corn and rice. Continuous trait stacking in drought tolerance and pest resistance sustains hybrid pricing power, even while biosafety debates slow the rollout of transgenic events. Non-GM hybrid launches thus dominate pipelines, easing regulatory friction and widening farmer acceptance.
Open-pollinated varieties and hybrid derivatives recorded a 4.06% CAGR, reflecting renewed interest in seed sovereignty and cost savings where seasonal credit is scarce. Farmer-managed seed systems supported by community banks stretch the Asia-Pacific grain seed market share of OPVs, particularly in upland rice and millet. Government conservation programs further boost local landrace maintenance. While yield gaps remain versus hybrids, lower seed cost and re-planting flexibility keep OPVs relevant for risk-averse growers in marginal zones.


By Crop: Corn Commands but Wheat Accelerates
Corn held 51.12% of the Asia-Pacific grain seed market size in 2025, underpinned by escalating feed demand and starch processing capacity. High-oil and amino-acid-dense hybrids attract feed integrators seeking efficiency gains, locking in contract-based sales that stabilize seed uptake. The Asia-Pacific grain seed market share of corn is projected to hover near 50% through 2031 despite rotation with soy and sorghum in some regions.
Wheat emerges as the fastest-growing crop segment at 5.53% CAGR, driven by shorter-duration varieties that enable intensive cropping systems and climate adaptation strategies in traditional rice-wheat rotations. Breeders leverage marker-assisted selection for heat tolerance, creating cultivars that mature 10-15 days earlier without sacrificing protein. Sorghum gains visibility as a dual-purpose crop in water-stressed zones, though limited malt and feed infrastructure tempers scale. Niche grains such as millet and barley serve nutrition-security programs and attract premium health-food channels, extending crop diversity within the Asia-Pacific grain seed industry.
Geography Analysis
The Asia-Pacific grain seed market exhibits distinct regional growth patterns, with China maintaining 60.25% market share in 2025 despite regulatory uncertainties around genetically modified traits that have created opportunities for conventional breeding technologies. India represents the second-largest market, driven by hybrid rice adoption rates of 35% in major producing states and expanding corn cultivation for livestock feed applications, while the government's Pradhan Mantri Fasal Bima Yojana has extended crop insurance coverage to hybrid seeds. Southeast Asian markets, including Indonesia, the Philippines, and Thailand, show steady growth supported by government seed subsidy programs, with Indonesia's Ministry of Agriculture allocating subsidies for sorghum and millet varieties on marginal lands and the Philippines' Rice Competitiveness Enhancement Fund distributing PHP 3 billion (USD 53.6 million) for certified seed programs in 2024.
Australia emerges as the fastest-growing market at 8.61% CAGR through 2031, driven by drought-tolerant wheat and barley breeding programs that have demonstrated 20-35% yield stability improvements under water stress conditions. The country's focus on premium grain varieties for export markets has created demand for certified seeds with specific quality attributes, while mixed farming systems have embraced sorghum as a drought-resilient alternative crop serving dual purposes as livestock feed and cash crop. Vietnam and Thailand benefit from growing cross-border rice trade, with Vietnam's rice exports requiring specific variety certifications for premium markets and Thailand developing blockchain-based traceability systems for jasmine rice authenticity, driving certified seed adoption rates up 15-20% annually across participating regions.
Smaller markets including Myanmar, Bangladesh, and Cambodia face challenges from counterfeit seed infiltration and limited regulatory enforcement, though digital agriculture platforms are beginning to address distribution inefficiencies and seed authenticity verification through mobile-based ordering systems. Japan maintains a specialized market focused on precision agriculture applications and premium hybrid technologies, while regulatory frameworks across the region continue evolving around biosafety standards, with ASEAN Food Safety Network establishing harmonized standards for rice quality parameters that favor certified seed adoption in export-oriented production systems.
Competitive Landscape
Fragmentation defines the Asia-Pacific grain seed market, with the top five players holding roughly 20% of 2024 revenue. Multinationals pursue targeted acquisitions, exemplified by UPL's purchase of Wuhan Advanta Seeds to deepen Chinese corn and sorghum portfolios. Such moves supply specific germplasm rather than broad consolidation, reflecting the heterogeneous crop mix and country-specific regulation.
Digital engagement and trait innovation emerge as the primary differentiators. Bayer has earmarked significant investments for regional R&D hubs in India and Indonesia to accelerate the development of climate-resilient corn and rice hybrids, partnering with public institutes for rapid trialing. Syngenta launched a substantial venture fund to support precision breeding and agritech startups, betting on ecosystem leverage rather than relying solely on internal development. Domestic specialists such as Yuan Longping High-Tech invested in Myanmar and Cambodia breeding stations, deploying regionally adapted hybrid rice to capture underserved markets.
Digital-native platforms shape distribution. Indonesia's Semaai reduced delivery lead times significantly, and India's Mahyco mobile storefront handles direct seed orders alongside agronomy advice. Regional breeders leverage local germplasm collections and open-source trait pools to avoid royalty hikes, maintaining cost competitiveness versus global brands. Overall, success hinges on marrying climate-ready traits with localized service and transparent distribution.
Asia-Pacific Grain Seed Industry Leaders
Bayer AG
Syngenta Group
Corteva Agriscience
Yuan Longping High-Tech Agriculture Co. Ltd
Advanta Seeds (UPL Ltd.)
- *Disclaimer: Major Players sorted in no particular order

Recent Industry Developments
- July 2025: UPL Ltd. acquired a 100% stake in Wuhan Advanta Seeds Co. Ltd. through its step-down subsidiary. This acquisition expanded UPL's presence in China's grain seed market. Advanta's specialization in corn, rice, and sorghum seeds enhanced UPL's position in East Asia's hybrid grain seed segment.
- May 2024: Bioseed and the International Rice Research Institute (IRRI) have extended their partnership to develop new rice varieties with higher yields, improved stress tolerance, and climate resilience. This collaboration focuses on developing hybrid rice varieties for small-scale farmers across Asia.


Asia-Pacific Grain Seed Market Report Scope
Hybrids, Open Pollinated Varieties & Hybrid Derivatives are covered as segments by Breeding Technology. Corn, Rice, Sorghum, Wheat are covered as segments by Crop. Australia, Bangladesh, China, India, Indonesia, Japan, Myanmar, Pakistan, Philippines, Thailand, Vietnam are covered as segments by Country.Breeding Technology
| Hybrids | Non-Transgenic Hybrids | |
| Transgenic Hybrids | Herbicide Tolerant Hybrids | |
| Insect Resistant Hybrids | ||
| Other Traits | ||
| Open Pollinated Varieties and Hybrid Derivatives | ||
Crop
| Corn |
| Rice |
| Sorghum |
| Wheat |
| Other Grains and Cereals |
Country
| Australia |
| Bangladesh |
| China |
| India |
| Indonesia |
| Japan |
| Myanmar |
| Pakistan |
| Philippines |
| Thailand |
| Vietnam |
| Rest of Asia-Pacific |
| Breeding Technology | Hybrids | Non-Transgenic Hybrids | |
| Transgenic Hybrids | Herbicide Tolerant Hybrids | ||
| Insect Resistant Hybrids | |||
| Other Traits | |||
| Open Pollinated Varieties and Hybrid Derivatives | |||
| Crop | Corn | ||
| Rice | |||
| Sorghum | |||
| Wheat | |||
| Other Grains and Cereals | |||
| Country | Australia | ||
| Bangladesh | |||
| China | |||
| India | |||
| Indonesia | |||
| Japan | |||
| Myanmar | |||
| Pakistan | |||
| Philippines | |||
| Thailand | |||
| Vietnam | |||
| Rest of Asia-Pacific | |||


Market Definition
- Commercial Seed - For the purpose of this study, only commercial seeds have been included as part of the scope. Farm-saved Seeds, which are not commercially labeled are excluded from scope, even though a minor percentage of farm-saved seeds are exchanged commercially among farmers. The scope also excludes vegetatively reproduced crops and plant parts, which may be commercially sold in the market.
- Crop Acreage - While calculating the acreage under different crops, the Gross Cropped Area has been considered. Also known as Area Harvested, according to the Food & Agricultural Organization (FAO), this includes the total area cultivated under a particular crop across seasons.
- Seed Replacement Rate - Seed Replacement Rate is the percentage of area sown out of the total area of crop planted in the season by using certified/quality seeds other than the farm-saved seed.
- Protected Cultivation - The report defines protected cultivation as the process of growing crops in a controlled environment. This includes greenhouses, glasshouses, hydroponics, aeroponics, or any other cultivation system that protects the crop against any abiotic stress. However, cultivation in an open field using plastic mulch is excluded from this definition and is included under open field.
| Keyword | Definition |
|---|---|
| Row Crops | These are usually the field crops which include the different crop categories like grains & cereals, oilseeds, fiber crops like cotton, pulses, and forage crops. |
| Solanaceae | These are the family of flowering plants which includes tomato, chili, eggplants, and other crops. |
| Cucurbits | It represents a gourd family consisting of about 965 species in around 95 genera. The major crops considered for this study include Cucumber & Gherkin, Pumpkin and squash, and other crops. |
| Brassicas | It is a genus of plants in the cabbage and mustard family. It includes crops such as carrots, cabbage, cauliflower & broccoli. |
| Roots & Bulbs | The roots and bulbs segment includes onion, garlic, potato, and other crops. |
| Unclassified Vegetables | This segment in the report includes the crops which don’t belong to any of the above-mentioned categories. These include crops such as okra, asparagus, lettuce, peas, spinach, and others. |
| Hybrid Seed | It is the first generation of the seed produced by controlling cross-pollination and by combining two or more varieties, or species. |
| Transgenic Seed | It is a seed that is genetically modified to contain certain desirable input and/or output traits. |
| Non-Transgenic Seed | The seed produced through cross-pollination without any genetic modification. |
| Open-Pollinated Varieties & Hybrid Derivatives | Open-pollinated varieties produce seeds true to type as they cross-pollinate only with other plants of the same variety. |
| Other Solanaceae | The crops considered under other Solanaceae include bell peppers and other different peppers based on the locality of the respective countries. |
| Other Brassicaceae | The crops considered under other brassicas include radishes, turnips, Brussels sprouts, and kale. |
| Other Roots & Bulbs | The crops considered under other roots & bulbs include Sweet Potatoes and cassava. |
| Other Cucurbits | The crops considered under other cucurbits include gourds (bottle gourd, bitter gourd, ridge gourd, Snake gourd, and others). |
| Other Grains & Cereals | The crops considered under other grains & cereals include Barley, Buck Wheat, Canary Seed, Triticale, Oats, Millets, and Rye. |
| Other Fibre Crops | The crops considered under other fibers include Hemp, Jute, Agave fibers, Flax, Kenaf, Ramie, Abaca, Sisal, and Kapok. |
| Other Oilseeds | The crops considered under other oilseeds include Ground nut, Hempseed, Mustard seed, Castor seeds, safflower seeds, Sesame seeds, and Linseeds. |
| Other Forage Crops | The crops considered under other forages include Napier grass, Oat grass, White clover, Ryegrass, and Timothy. Other forage crops were considered based on the locality of the respective countries. |
| Pulses | Pigeon peas, Lentils, Broad and horse beans, Vetches, Chickpeas, Cowpeas, Lupins, and Bambara beans are the crops considered under pulses. |
| Other Unclassified Vegetables | The crops considered under other unclassified vegetables include Artichokes, Cassava Leaves, Leeks, Chicory, and String beans. |


Research Methodology
Mordor Intelligence follows a four-step methodology in all our reports.
- Step-1: IDENTIFY KEY VARIABLES: In order to build a robust forecasting methodology, the variables and factors identified in Step-1 are tested against available historical market numbers. Through an iterative process, the variables required for market forecast are set and the model is built on the basis of these variables.
- Step-2: Build a Market Model: Market-size estimations for the forecast years are in nominal terms. Inflation is not a part of the pricing, and the average selling price (ASP) is kept constant throughout the forecast period.
- Step-3: Validate and Finalize: In this important step, all market numbers, variables and analyst calls are validated through an extensive network of primary research experts from the market studied. The respondents are selected across levels and functions to generate a holistic picture of the market studied.
- Step-4: Research Outputs: Syndicated Reports, Custom Consulting Assignments, Databases, and Subscription Platforms


