Market Overview
| Study Period | 2021 - 2031 |
|---|---|
| Forecast Data Period | 2026 - 2031 |
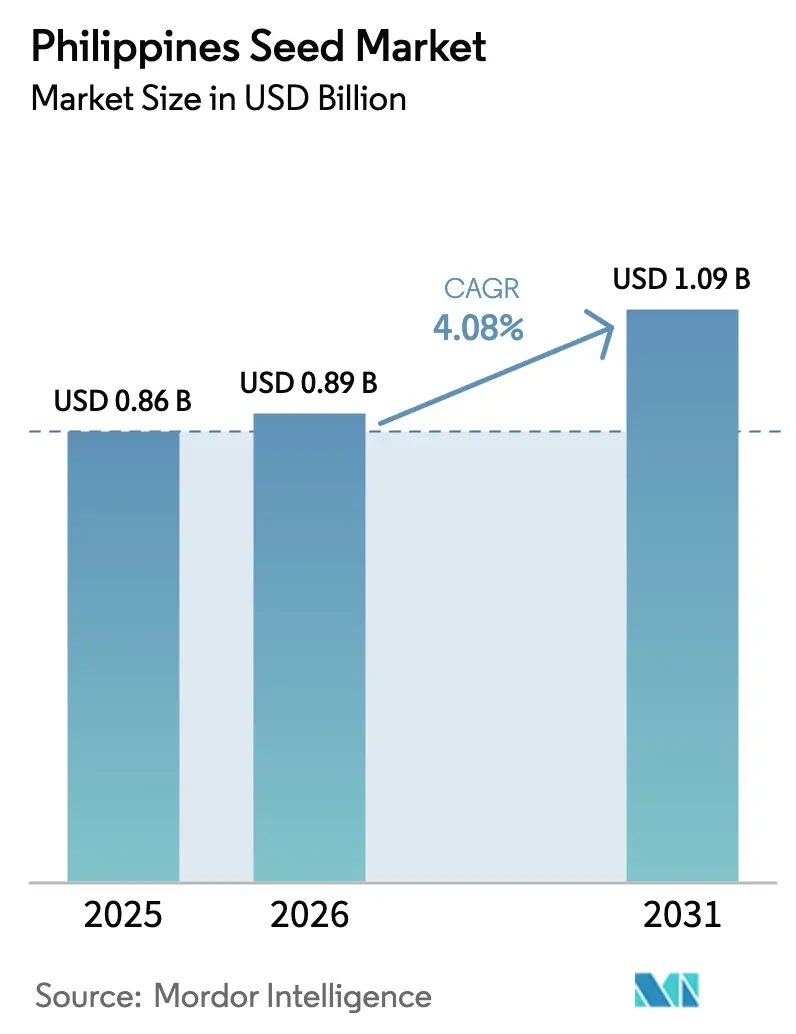
| Base Year Market Size (2025) | USD 0.86 Billion |
| Market Size (2026) | USD 0.89 Billion |
| Market Size (2031) | USD 1.09 Billion |
| Growth Rate (2026 - 2031) | 4.08% CAGR |
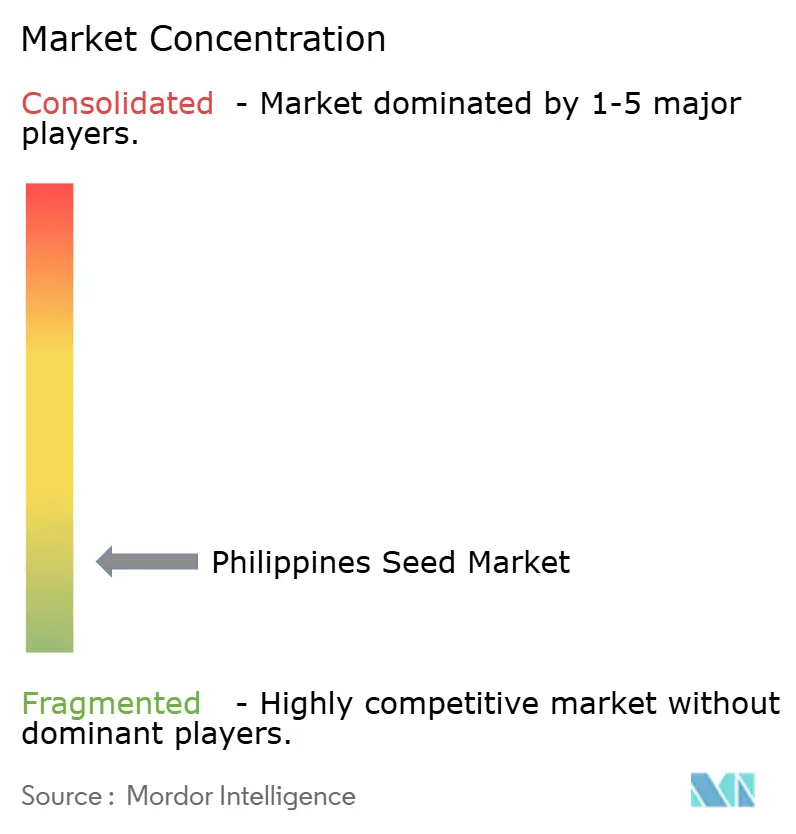
| Market Concentration | Low |
Major Players *Disclaimer: Major Players sorted in no particular order Image © Mordor Intelligence. Reuse requires attribution under CC BY 4.0. | |
Philippines Seed Market Analysis by Mordor Intelligence
The Philippines seed market size was valued at USD 0.86 billion in 2025 and estimated to grow from USD 0.89 billion in 2026 to reach USD 1.09 billion by 2031, at a CAGR of 4.08% during the forecast period (2026-2031). Hybrid momentum in vegetables and corn is accelerating even as government rice self-sufficiency programs extend subsidies that stabilize demand for certified inbred lines. Contract farming, digital ordering, and protected cultivation are widening the gap in seed quality expectations between commercially oriented growers and smallholders who continue saving grain. Multinational companies continue to dominate the corn and rice markets, while domestic breeders are increasing their market share in vegetables, supported by localized research and development tax incentives. However, challenges such as deficits in cold-chain infrastructure, delays in Plant Variety Protection approvals, and coastal salinity issues limit the growth potential. Despite these obstacles, the structural shift toward breeding technology persists.
Key Report Takeaways
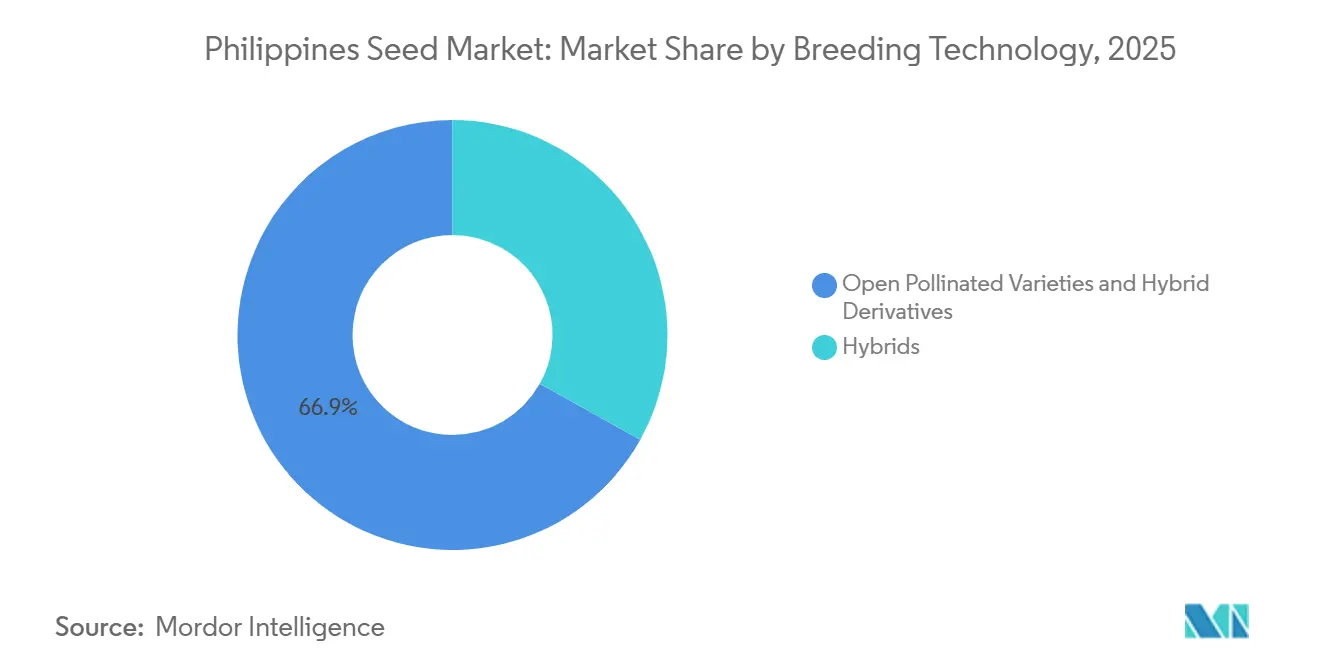
- By breeding technology, open-pollinated varieties and hybrid derivatives accounted for the largest segment in 2025, with 66.9% of the Philippines seed market share, while hybrids held the fastest-growing segment and advanced at a 4.9% CAGR through 2031.
- By cultivation mechanism, open-field systems accounted for the largest segment, capturing 99.9% of the Philippines seed market size in 2025, whereas protected cultivation held the fastest-growing segment, forecast to rise at a 10.2% CAGR to 2031.
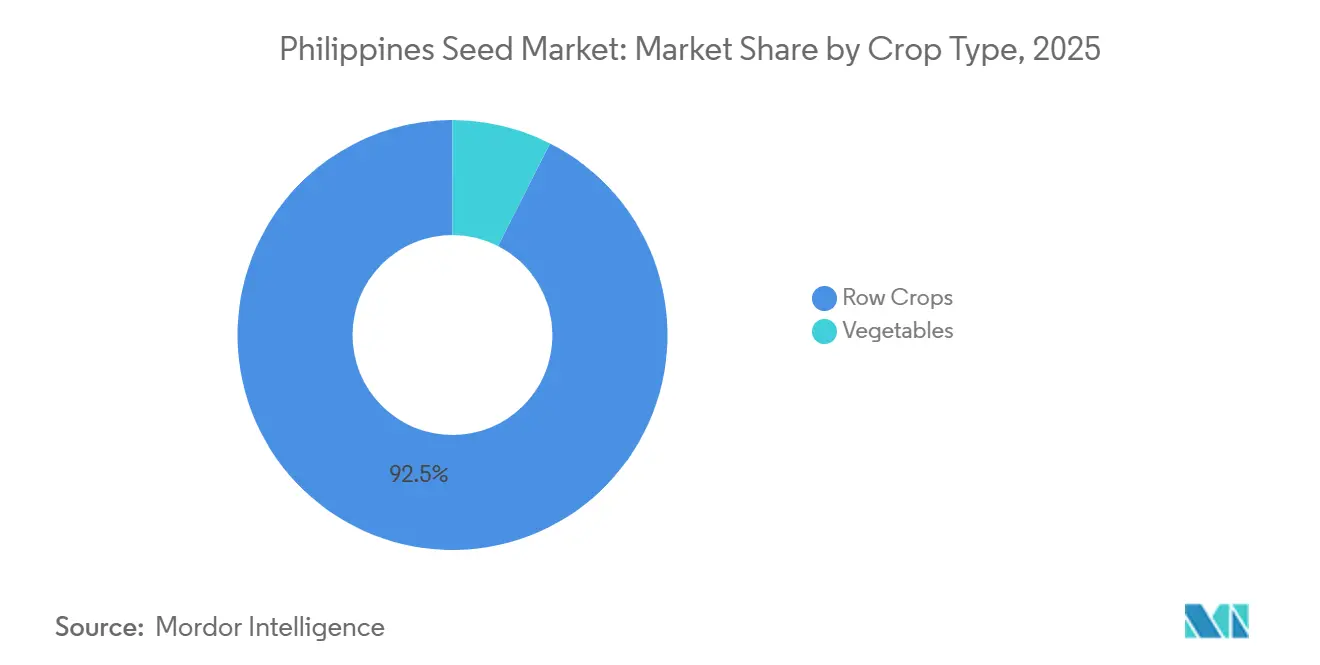
- By crop type, row crops accounted for the largest segment, commanding 92.5% of the Philippines seed market share in 2025, yet vegetables held the fastest-growing segment and are projected to grow at a 6.1% CAGR through 2031.
Note: Market size and forecast figures in this report are generated using Mordor Intelligence’s proprietary estimation framework, updated with the latest available data and insights as of 2026.
Philippines Seed Market Trends and Insights
Drivers Impact Analysis*
| Driver | (~) % Impact on CAGR Forecast | Geographic Relevance | Impact Timeline |
|---|---|---|---|
| Rice self-sufficiency programs | +1.2% | Central Luzon, Cagayan Valley, and Western Visayas | Medium term (2-4 years) |
| Expansion of contract farming by seed firms | +0.9% | Mindanao corn zones, and Benguet vegetables | Short term (≤ 2 years) |
| Rising demand for high-value vegetables | +0.8% | Metro Manila, Cebu, and Davao | Medium term (2-4 years) |
| Growth in protected cultivation acreage | +0.6% | Benguet, Bukidnon, and Ilocos coast | Long term (≥ 4 years) |
| Research and development tax incentives | +0.4% | Nationwide | Long term (≥ 4 years) |
| Digital seed ordering platforms | +0.3% | Provinces with 4G coverage above 80% | Short term (≤ 2 years) |
| Source: Mordor Intelligence | |||
Rice Self-Sufficiency Programs
The Rice Competitiveness Enhancement Fund now allocates PHP 30 billion (USD 535 million) annually, tripling the previous outlay and earmarking PHP 6 billion (USD 107 million) for seed development [1]Source: Department of Agriculture, “Rice Competitiveness Enhancement Fund Extension,” da.gov.ph. Certified seed costs at the farm gate have decreased, increasing replacement rates in priority provinces. In 2021, the Philippine Department of Agriculture and the Philippine Rice Research Institute (PhilRice) distributed 46,800 bags of high-yielding and stress-tolerant rice seeds developed by the International Rice Research Institute (IRRI) to farmers in the agricultural hubs of Central Visayas. This initiative was part of the government-supported Seed Program under the Rice Competitiveness Enhancement Fund (RCEF), which aimed to improve the performance of local farmers in the international rice market. Stricter certification requirements by the Bureau of Plant Industry have raised production costs, though these are largely offset by subsidies. The use of certified and farmer-saved seed in irrigated paddies is driving farmers toward commercial suppliers.
Expansion of Contract Farming by Seed Firms
East-West Seed's Seed-to-Market program aims to connect major vegetable growers with supermarket off-takers by 2025. This initiative ensures premium prices, offsetting the higher cost of hybrid seeds, which are three to four times more expensive than open-pollinated varieties. Charoen Pokphand Group integrates corn hybrids with poultry grow-out contracts, capturing margins from both seed and feed while reducing distribution costs. These risk-sharing models promote the adoption of hybrids in crops previously hindered by yield variability. Logistics capacity remains a key challenge for scaling these efforts.
Rising Consumer Demand for High-Value Vegetables
In 2025, urban households increased their spending on fresh vegetables, with supermarkets and e-commerce accounting for a significant share. Retailers favored hybrid varieties due to their uniform size and extended shelf life. Tomato hybrids reduced harvest labor by streamlining the harvesting process, making it more efficient and cost-effective. Eggplant hybrids improved yields significantly, driven by their resistance to bacterial wilt, which is a major disease affecting production. Additionally, advancements in cold storage facilities helped maintain the freshness of vegetables during transportation, reducing post-harvest losses. Furthermore, consumer preference for organic and pesticide-free hybrid vegetables also contributed to the growing demand in urban markets.
Growth in Protected Cultivation Acreage
The Department of Agriculture, through a PHP 200 million grant from South Korea (MAFRA), established smart greenhouse pilot centers in Iloilo and Bukidnon to modernize high-value crop production. Meanwhile, a newer USD 8 million (PHP 450 million) project launched in 2026 aims to further expand smart farming technology across the country through 2027. Protected structures increase annual seed demand per hectare, favoring compact, disease-resistant hybrids. Benguet growers expanded by using subsidized loans, yet electricity access in only 68% of agricultural barangays caps nationwide scalability. The program is projected to improve crop yields by providing a controlled environment that minimizes the impact of adverse weather conditions. It aims to promote the use of advanced agricultural technologies, fostering innovation and efficiency in farming practices.
Restraints Impact Analysis*
| Restraint | (~) % Impact on CAGR Forecast | Geographic Relevance | Impact Timeline |
|---|---|---|---|
| Limited cold-chain logistics | -0.7% | Eastern Visayas, Bicol, and island provinces | Medium term (2-4 years) |
| Fragmented informal seed saving | -0.5% | Rain-fed rice and upland corn areas | Long term (≥ 4 years) |
| Registration backlog at the Plant Variety Protection Board | -0.3% | Nationwide | Medium term (2-4 years) |
| Coastal soil salinity | -0.2% | Pampanga, Bulacan, Iloilo, and Mindanao deltas | Long term (≥ 4 years) |
| Source: Mordor Intelligence | |||
Limited Cold-Chain Logistics
Vegetable post-harvest losses reached 20%-40% in 2025 because the country operates fewer than 200 refrigerated trucks and 50 agricultural cold stores[2]Source: Philippine Rice Research Institute, “Salinity Impact Assessment,” philrice.gov.ph. Growers outside a six-hour delivery radius from Metro Manila revert to hardy open-pollinated lines, weakening demand for premium hybrids despite their yield edge. The lack of adequate cold chain infrastructure hinders the efficient transport of perishable goods, particularly for farmers in remote areas. These farmers, located beyond a six-hour delivery radius from Metro Manila, often rely on hardy open-pollinated varieties, which are more resilient but less profitable than premium hybrids. This shift reduces demand for premium hybrid seeds, despite their higher yield potential and greater revenue potential.
Registration Backlog at Plant Variety Protection Board
A two-year approval queue slows commercialization of new vegetable hybrids and shifts breeder attention to longer-lifecycle rice and corn lines. Domestic firms with narrower pipelines bear the brunt, ceding early-mover ground to multinationals that can launch in neighboring Asia-Pacific markets first. This institutional friction discourages investment in niche crops with narrow market windows and rapidly changing varietal preferences. As a result, breeding efforts are focused on high-volume crops like rice and corn, where longer commercial lifespans justify the regulatory requirements.
*Our forecasts treat driver/restraint impacts as directional, not additive. The impact forecasts reflect baseline growth, mix effects, and variable interactions.
Segment Analysis
By Breeding Technology: Hybrids Gain Despite Open Pollinated Varieties Dominance
Open-pollinated varieties and hybrid derivatives accounted for the largest segment, with 66.9% of the Philippines seed market share in 2025. Open-pollinated varieties will persist in rain-fed rice and upland corn zones where hybrid yield premiums narrow and seed costs consume a high proportion of production budgets. The Bureau of Plant Industry's certification initiative, supported by the Rice Competitiveness Enhancement Fund (RCEF), seeks to reduce derivative planting. Enforcement in remote barangays remains limited. Consequently, the Philippine seed market exhibits a dual structure, with hybrids driving growth segments and open-pollinated varieties (OPVs) catering to subsistence farming communities.
Hybrids held the fastest-growing segment, advancing at a 4.9% CAGR through 2031. Non-transgenic hybrids account for a substantial share of hybrid sales, with Bt corn as the only widely adopted biotech variety. The implementation of the enhanced research and development deduction is anticipated to encourage the introduction of domestic hybrid varieties, particularly in vegetables, where shorter feedback loops facilitate quicker development cycles. East-West Seed holds a notable share of the vegetable hybrid market by customizing disease resistance and maturity periods to suit specific local microclimates. However, regulatory uncertainty regarding biotech vegetables restricts pipeline diversity. Marker-assisted selection is helping to address this limitation by enabling the development of traits such as bacterial wilt resistance and improved shelf life.


By Cultivation Mechanism: Protected Cultivation Reshapes Demand
Open-field systems accounted for the largest segment, capturing 99.9% of the Philippines seed market share in 2025, owing to increased row-crop and vegetable seed demand. These systems remain the preferred choice due to their cost-effectiveness and suitability for large-scale farming, which aligns with the country's agricultural practices. The capital cost of the smart greenhouse program's polyhouse system has encouraged larger cooperatives to invest, as it offers higher productivity and better control over environmental factors. In Benguet, the adoption of protected vegetable cultivation systems highlights a shift in the Philippines seed market toward high-margin segments, as farmers increasingly recognize the benefits of improved yield quality and reduced crop losses associated with these systems.
Protected cultivation was the fastest-growing segment, forecast to grow at a 10.2% CAGR through 2031. Expanding beyond peri-urban areas depends on access to reliable electricity for ventilation and fertigation systems. While agricultural barangays are connected to the grid, the Luzon Spine Expressway, scheduled for completion in three years, will address logistical challenges. In the interim, open-field systems will continue to dominate the production of cereals and low-value vegetables, while protected cultivation will focus on premium crop segments.
By Crop Type: Vegetables Outpace Row Crops
Row crops accounted for the largest segment, commanding 92.5% of the Philippines seed market share in 2025. Corn hybrid demand is buoyant, driven by rising poultry sector consumption. Rice seed gains are modest as certified distribution offsets shrinking area. Challenges such as water scarcity and urbanization have reduced rice cultivation, making certified seeds crucial to maintaining productivity.
Vegetables held the fastest-growing segment and are projected to grow at a 6.1% CAGR through 2031. Hybrid tomato lines with concentrated ripening reduce harvest labor requirements, particularly as rural wages are projected to increase in 2025. Eggplant hybrids extend their productive lifespan by an additional month, enabling double-cropping. As a result, vegetable hybrids are driving a shift toward premiumization, steering the broader Philippine seed market toward technology-intensive products.
Geography Analysis
Central Luzon and Cagayan Valley accounted for nearly one-third of the total Rice Competitiveness Enhancement Fund (RCEF) seed distribution in 2025, helping drive the national certified seed adoption rate from a pre-program low of 18% to over 31%[3]Source: Department of Agriculture, “Rice Competitiveness Enhancement Fund Extension,” da.gov.ph. The region is projected to grow further as hybrid rice trials expand and protected cultivation clusters increase in Benguet and Nueva Vizcaya. Government seed subsidies play a crucial role in stabilizing demand cycles, while the region's port accessibility facilitates investment in cold-chain infrastructure.
Mindanao is the fastest-growing region, supported by larger farm sizes, diversified crop rotations, and progressive cooperatives. The Davao region combines export-oriented banana and cacao plantations with hybrid corn production and emerging greenhouse vegetable cultivation, attracting private equity investments in seed conditioning plants. Additionally, road upgrades in Northern Mindanao help reduce logistics bottlenecks, encouraging greater participation in contract farming.
The Visayas islands experience growth fueled by tourism-driven hospitality demand and aquaculture feed markets, which boost corn seed volumes. Logistics challenges persist, as ferry links and limited cold storage facilities increase landed costs. Despite these issues, incentives for agricultural cold hubs are being implemented. Typhoon risks in Eastern Visayas drive demand for quick-maturing crop varieties. Regional research centers in Iloilo and Cebu focus on refining varietal recommendations, supporting consistent adoption of vegetables and specialty rice lines.
Competitive Landscape
The Philippines seed market is characterized by fragmented competition in 2025, with key players including Allied Botanical Corporation, Bayer AG, Charoen Pokphand Group (CP Group), Corteva Agriscience, and Syngenta Group leveraging their robust farmer-training networks to maintain their market share in vegetable seeds and consistently introduce varieties suited to tropical humidity. Syngenta Group focuses on hybrid rice and integrates crop protection solutions, achieving scale through nationwide dealer partnerships. Allied Botanical Corporation and Harbest Agribusiness Corporation enhance their presence in provincial areas through demonstration plots and micro-financing initiatives, each holding mid-single-digit market shares.
In 2025, Corteva Agriscience launched a digital agronomy platform that integrates seed recommendations with weather alerts, aiming to enhance farmer loyalty. This platform provides farmers with real-time insights, enabling them to make informed decisions about crop management and optimize yields. Additionally, startups specializing in CRISPR-based seed development and e-commerce seed retail are emerging, challenging traditional dealership models. These startups are leveraging advanced genetic editing technologies and online platforms to offer innovative solutions and greater accessibility to farmers.
Intellectual property enforcement remains a significant challenge in the market. The increasing adoption of hybrid seeds is driving a shift toward professionalized distribution channels, enhancing the potential for premium branding. The competitive landscape reflects broader trends in agricultural modernization, where success hinges on balancing technological advancements with a deep understanding of local farming practices and cultural preferences. These factors play a critical role in influencing variety adoption across the Philippines diverse agroecological zones.
Philippines Seed Industry Leaders
Allied Botanical Corporation
Bayer AG
Charoen Pokphand Group (CP Group)
Corteva Agriscience
Syngenta Group
- *Disclaimer: Major Players sorted in no particular order

Recent Industry Developments
- February 2026: The Department of Agriculture’s Agricultural Training Institute (DA-ATI) and East-West Seed Knowledge Transfer (EWS-KT) Philippines, in collaboration with East-West Seed Philippines, have established a partnership to enhance farmer capacity building and agricultural extension services across the country.
- September 2025: The Philippine Rice Research Institute (PhilRice) plans to distribute DNA-fingerprinted rice seeds to ensure varietal purity and prevent cross-contamination. This initiative aims to enhance seed quality, support local farmers, and increase national rice production.
- February 2025: East-West Seed Group established a 36-hectare Hortanova Research Center in San Juan, Batangas. The facility focuses on developing climate-resilient vegetable seed varieties adapted to local rice-based farming conditions and assists farmers in transitioning to vegetable cultivation.


Philippines Seed Market Report Scope
A seed is a small embryonic plant enclosed in a protective coat and containing stored food. It develops from a fertilized ovule and enables plant reproduction. The Philippines Seed Market Report is Segmented by Breeding Technology (Hybrids and Open Pollinated Varieties and Hybrid Derivatives), Cultivation Mechanism (Open Field and Protected Cultivation), and Crop Type (Row Crops and Vegetables). The Market Forecasts are Provided in Terms of Value (USD) and Volume (Metric Tons).
Breeding Technology
| Hybrids | Non-Transgenic Hybrids | |
| Transgenic Hybrids | Herbicide Tolerant Hybrids | |
| Insect Resistant Hybrids | ||
| Other Traits | ||
| Open Pollinated Varieties and Hybrid Derivatives | ||
Cultivation Mechanism
| Open Field |
| Protected Cultivation |
Crop Type
| Row Crops | Fiber Crops | Cotton |
| Other Fiber Crops | ||
| Forage Crops | Alfalfa | |
| Forage Corn | ||
| Forage Sorghum | ||
| Other Forage Crops | ||
| Grains and Cereals | Corn | |
| Rice | ||
| Sorghum | ||
| Oilseeds | Soybean | |
| Other Oilseeds | ||
| Pulses | ||
| Vegetables | Brassicas | Cabbage |
| Carrot | ||
| Cauliflower and Broccoli | ||
| Other Brassicas | ||
| Cucurbits | Cucumber and Gherkin | |
| Pumpkin and Squash | ||
| Other Cucurbits | ||
| Roots and Bulbs | Garlic | |
| Onion | ||
| Potato | ||
| Other Roots and Bulbs | ||
| Solanaceae | Chilli | |
| Eggplant | ||
| Tomato | ||
| Other Solanaceae | ||
| Unclassified Vegetables | Asparagus | |
| Lettuce | ||
| Okra | ||
| Peas | ||
| Spinach | ||
| Other Unclassified Vegetables | ||
| Breeding Technology | Hybrids | Non-Transgenic Hybrids | |
| Transgenic Hybrids | Herbicide Tolerant Hybrids | ||
| Insect Resistant Hybrids | |||
| Other Traits | |||
| Open Pollinated Varieties and Hybrid Derivatives | |||
| Cultivation Mechanism | Open Field | ||
| Protected Cultivation | |||
| Crop Type | Row Crops | Fiber Crops | Cotton |
| Other Fiber Crops | |||
| Forage Crops | Alfalfa | ||
| Forage Corn | |||
| Forage Sorghum | |||
| Other Forage Crops | |||
| Grains and Cereals | Corn | ||
| Rice | |||
| Sorghum | |||
| Oilseeds | Soybean | ||
| Other Oilseeds | |||
| Pulses | |||
| Vegetables | Brassicas | Cabbage | |
| Carrot | |||
| Cauliflower and Broccoli | |||
| Other Brassicas | |||
| Cucurbits | Cucumber and Gherkin | ||
| Pumpkin and Squash | |||
| Other Cucurbits | |||
| Roots and Bulbs | Garlic | ||
| Onion | |||
| Potato | |||
| Other Roots and Bulbs | |||
| Solanaceae | Chilli | ||
| Eggplant | |||
| Tomato | |||
| Other Solanaceae | |||
| Unclassified Vegetables | Asparagus | ||
| Lettuce | |||
| Okra | |||
| Peas | |||
| Spinach | |||
| Other Unclassified Vegetables | |||


Market Definition
- Commercial Seed - For the purpose of this study, only commercial seeds have been included as part of the scope. Farm-saved Seeds, which are not commercially labeled are excluded from scope, even though a minor percentage of farm-saved seeds are exchanged commercially among farmers. The scope also excludes vegetatively reproduced crops and plant parts, which may be commercially sold in the market.
- Crop Acreage - While calculating the acreage under different crops, the Gross Cropped Area has been considered. Also known as Area Harvested, according to the Food & Agricultural Organization (FAO), this includes the total area cultivated under a particular crop across seasons.
- Seed Replacement Rate - Seed Replacement Rate is the percentage of area sown out of the total area of crop planted in the season by using certified/quality seeds other than the farm-saved seed.
- Protected Cultivation - The report defines protected cultivation as the process of growing crops in a controlled environment. This includes greenhouses, glasshouses, hydroponics, aeroponics, or any other cultivation system that protects the crop against any abiotic stress. However, cultivation in an open field using plastic mulch is excluded from this definition and is included under open field.
| Keyword | Definition |
|---|---|
| Row Crops | These are usually the field crops which include the different crop categories like grains & cereals, oilseeds, fiber crops like cotton, pulses, and forage crops. |
| Solanaceae | These are the family of flowering plants which includes tomato, chili, eggplants, and other crops. |
| Cucurbits | It represents a gourd family consisting of about 965 species in around 95 genera. The major crops considered for this study include Cucumber & Gherkin, Pumpkin and squash, and other crops. |
| Brassicas | It is a genus of plants in the cabbage and mustard family. It includes crops such as carrots, cabbage, cauliflower & broccoli. |
| Roots & Bulbs | The roots and bulbs segment includes onion, garlic, potato, and other crops. |
| Unclassified Vegetables | This segment in the report includes the crops which don’t belong to any of the above-mentioned categories. These include crops such as okra, asparagus, lettuce, peas, spinach, and others. |
| Hybrid Seed | It is the first generation of the seed produced by controlling cross-pollination and by combining two or more varieties, or species. |
| Transgenic Seed | It is a seed that is genetically modified to contain certain desirable input and/or output traits. |
| Non-Transgenic Seed | The seed produced through cross-pollination without any genetic modification. |
| Open-Pollinated Varieties & Hybrid Derivatives | Open-pollinated varieties produce seeds true to type as they cross-pollinate only with other plants of the same variety. |
| Other Solanaceae | The crops considered under other Solanaceae include bell peppers and other different peppers based on the locality of the respective countries. |
| Other Brassicaceae | The crops considered under other brassicas include radishes, turnips, Brussels sprouts, and kale. |
| Other Roots & Bulbs | The crops considered under other roots & bulbs include Sweet Potatoes and cassava. |
| Other Cucurbits | The crops considered under other cucurbits include gourds (bottle gourd, bitter gourd, ridge gourd, Snake gourd, and others). |
| Other Grains & Cereals | The crops considered under other grains & cereals include Barley, Buck Wheat, Canary Seed, Triticale, Oats, Millets, and Rye. |
| Other Fibre Crops | The crops considered under other fibers include Hemp, Jute, Agave fibers, Flax, Kenaf, Ramie, Abaca, Sisal, and Kapok. |
| Other Oilseeds | The crops considered under other oilseeds include Ground nut, Hempseed, Mustard seed, Castor seeds, safflower seeds, Sesame seeds, and Linseeds. |
| Other Forage Crops | The crops considered under other forages include Napier grass, Oat grass, White clover, Ryegrass, and Timothy. Other forage crops were considered based on the locality of the respective countries. |
| Pulses | Pigeon peas, Lentils, Broad and horse beans, Vetches, Chickpeas, Cowpeas, Lupins, and Bambara beans are the crops considered under pulses. |
| Other Unclassified Vegetables | The crops considered under other unclassified vegetables include Artichokes, Cassava Leaves, Leeks, Chicory, and String beans. |


Research Methodology
Mordor Intelligence follows a four-step methodology in all our reports.
- Step-1: IDENTIFY KEY VARIABLES: In order to build a robust forecasting methodology, the variables and factors identified in Step-1 are tested against available historical market numbers. Through an iterative process, the variables required for market forecast are set and the model is built on the basis of these variables.
- Step-2: Build a Market Model: Market-size estimations for the forecast years are in nominal terms. Inflation is not a part of the pricing, and the average selling price (ASP) is kept constant throughout the forecast period.
- Step-3: Validate and Finalize: In this important step, all market numbers, variables and analyst calls are validated through an extensive network of primary research experts from the market studied. The respondents are selected across levels and functions to generate a holistic picture of the market studied.
- Step-4: Research Outputs: Syndicated Reports, Custom Consulting Assignments, Databases, and Subscription Platforms


