Market Overview
| Study Period | 2017 - 2030 |
|---|---|
| Forecast Data Period | 2025 - 2030 |
| Historical Data Period | 2017 - 2023 |
| Market Size (2025) | USD 1.25 Billion |
| Market Size (2030) | USD 1.54 Billion |
| Growth Rate (2025 - 2030) | 4.25% CAGR |
| Market Concentration | Low |
Major Players*Disclaimer: Major Players sorted in no particular order Image © Mordor Intelligence. Reuse requires attribution under CC BY 4.0. | |

Asia-Pacific Feed Minerals Market Analysis by Mordor Intelligence
The Asia-Pacific Feed Minerals Market size is estimated at 1.25 billion USD in 2025, and is expected to reach 1.54 billion USD by 2030, growing at a CAGR of 4.25% during the forecast period (2025-2030).
The Asia-Pacific feed minerals industry has emerged as a crucial component of the broader animal nutrition sector, with feed minerals accounting for 10.7% of the total animal feed additives market value and 18.3% of volume in 2022. This significant market presence reflects the growing recognition of animal nutrition minerals' essential role in supporting metabolic functions and overall animal health. The industry has witnessed a fundamental shift toward premium quality ingredients, driven by increasing consumer awareness about food safety and quality. Manufacturers are increasingly focusing on developing innovative mineral formulations that offer enhanced bioavailability and absorption rates, leading to improved animal performance and reduced environmental impact.
The market landscape is experiencing a notable transformation with the integration of advanced technologies in mineral production and quality control processes. Leading manufacturers are investing in state-of-the-art production facilities and implementing rigorous quality assurance protocols to meet the stringent regulatory requirements across different countries. The industry has also seen a surge in research and development activities focused on developing novel mineral combinations and delivery systems that can enhance the efficiency of nutrient absorption while reducing mineral excretion into the environment. These technological advancements are reshaping the competitive landscape and creating new opportunities for market players.
A significant trend shaping the industry is the growing emphasis on sustainable and environmentally responsible mineral supplementation practices. Feed manufacturers are increasingly adopting precision nutrition approaches, utilizing advanced analytical tools to optimize mineral inclusion rates and reduce waste. The industry is witnessing a rising demand for organic mineral sources and natural alternatives, reflecting the broader shift toward sustainable animal production systems. This trend is particularly evident in the increasing adoption of chelated and organic trace minerals, which offer improved bioavailability and reduced environmental impact compared to traditional inorganic sources.
The market is experiencing a notable shift in distribution channels and supply chain dynamics. Digital transformation is revolutionizing the way mineral feed supplements are marketed and distributed, with many companies adopting e-commerce platforms and digital solutions for order management and customer service. The industry is also witnessing increased vertical integration, with major players expanding their presence across the value chain to ensure quality control and supply chain efficiency. These developments are accompanied by growing investments in logistics infrastructure and inventory management systems to improve product availability and reduce lead times. The emphasis on traceability and transparency in the supply chain has become paramount, with companies implementing advanced tracking systems to ensure product quality and safety throughout the distribution network.
Asia-Pacific Feed Minerals Market Trends and Insights
The growing disposable income in developing countries of Asia-Pacific and government support schemes for poultry industry, and China is largest producer of eggs are helping in growth of poultry population in the region
- The Asia-Pacific region dominated the global agricultural sector, with poultry being the largest segment, accounting for 42.4% of global poultry production in 2022. This increase in poultry consumption is driven by a rise in popularity, rapid urbanization, and growing disposable incomes in developing countries such as India and Vietnam, which recorded a 37.3% increase in poultry population in 2021 from 2017.
- In 2021, China, Indonesia, and India held a significant share of the poultry market in the region, with market shares of 39.7%, 25.3%, and 5.7%, respectively. This growth in demand for poultry products can be attributed to increased demand for eggs, meat, and government schemes that support the poultry industry. For instance, the Department of Animal Husbandry and Dairy in India is introducing capital fund schemes to support poultry businesses, educating farmers on improving their yield quality, and boosting the market growth. China was the largest producer of eggs in the world, with consumption and production accounting for over 40% of global production in 2022. With over 900 million stock-laying hens and the country's largest layer poultry farming center hatching 60 million chicks per year, the country's layer farming recorded significant growth.
- Broiler production in the region is also growing rapidly due to the increased consumer demand for chicken meat. The Philippines, for instance, recorded a 2.2% increase in chicken meat production in 2021 from 2017. As such, the region's poultry production is expected to increase further, driven by a shift in consumer preferences toward poultry meat and the rapid development of the poultry industry. This growth in poultry production is expected to lead to an increase in demand for feed additives.


Improvement in fish farming technologies, expansion in number of feed mills and Indian government initiatives are helping in increasing the aquaculture feed production
- The Asia-Pacific region was a major player in the global aquaculture feed production market, with fish and shrimp being the primary products. In 2021, the region produced 37.6 million metric tons of aquaculture feed, which accounted for 8.7% of the region's total feed production. Several countries in the region are focusing on expanding their aquaculture production and intensification through technological advancements and increased use of feed to meet the growing demand. India, for instance, increased its budget allocation to the Department of Fisheries to boost production.
- Fish had a significant share of aquaculture feed, accounting for 31.1 million metric tons in 2022, an increase from 66% compared to 2017. This growth was due to the conversion of agricultural land to aquaculture ponds, the improvement of fish farming technologies, and the intensification of production. Shrimp feed production accounted for 4.2% of the aquafeed production in the region in 2022. It is expected to increase rapidly during the forecast period as some countries in the region started implementing a self-sufficient aquaculture system through a number of government initiatives to increase the production of certified sustainable seafood.
- China dominated the aquafeed market in the Asia-Pacific region, accounting for 51.2% of the market share in 2022 due to increased feed mills with higher capacities. For instance, AB Agri opened its ninth feed mill in China, a plant with an annual capacity of 240,000 tons. Factors such as an increase in aquaculture production, expansion of aqua farming, and rise in consumption of feed are expected to drive the growth of aquafeed production in the region during the forecast period.

OTHER KEY INDUSTRY TRENDS COVERED IN THE REPORT
- China has the largest sheep and goats in the region and Asia-Pacific region's ruminants population is growing owing to high profit margins in beef business and surge in demand for milk products
- The high demand for broiler feed, increase in Indonesia's poultry bird population and recovery from avian influenza are increasing the demand for poultry feed production
- Increase in large scale farms in China by 16,000, and introduction of new animal-rearing practices are increasing the swine feed production in the region
- Asia-Pacific is the leading producer of pork meat and changes in food consumption pattern of people with high consumption in South Korea and China are the factors driving the increase in the swine population
- High number of dairy cattle producers, demand for increasing milk yield and government schemes are increasing the demand for nutrient rich ruminant feed
Segment Analysis: Sub Additive
Macrominerals Segment in Asia-Pacific Feed Minerals Market
The macrominerals segment dominates the Asia-Pacific feed minerals market, commanding approximately 88% of the market share in 2024. This substantial market presence is attributed to the crucial role macrominerals play in livestock metabolic functions, including calcium, chlorine, magnesium, phosphorus, potassium, sodium, and sulfur. The segment's dominance is particularly evident in the poultry sector, where it accounts for about 43% of the macromineral consumption, followed by swine and ruminants at 26% and 20%, respectively. The segment is projected to maintain its market leadership while growing at approximately 4% during 2024-2029, driven by the increasing awareness of mineral benefits in animal nutrition minerals and the rising demand for high-quality meat products. China holds the maximum market share in the macrominerals segment, while Japan and India are emerging as key growth markets, reflecting the segment's strong regional presence and growth potential.
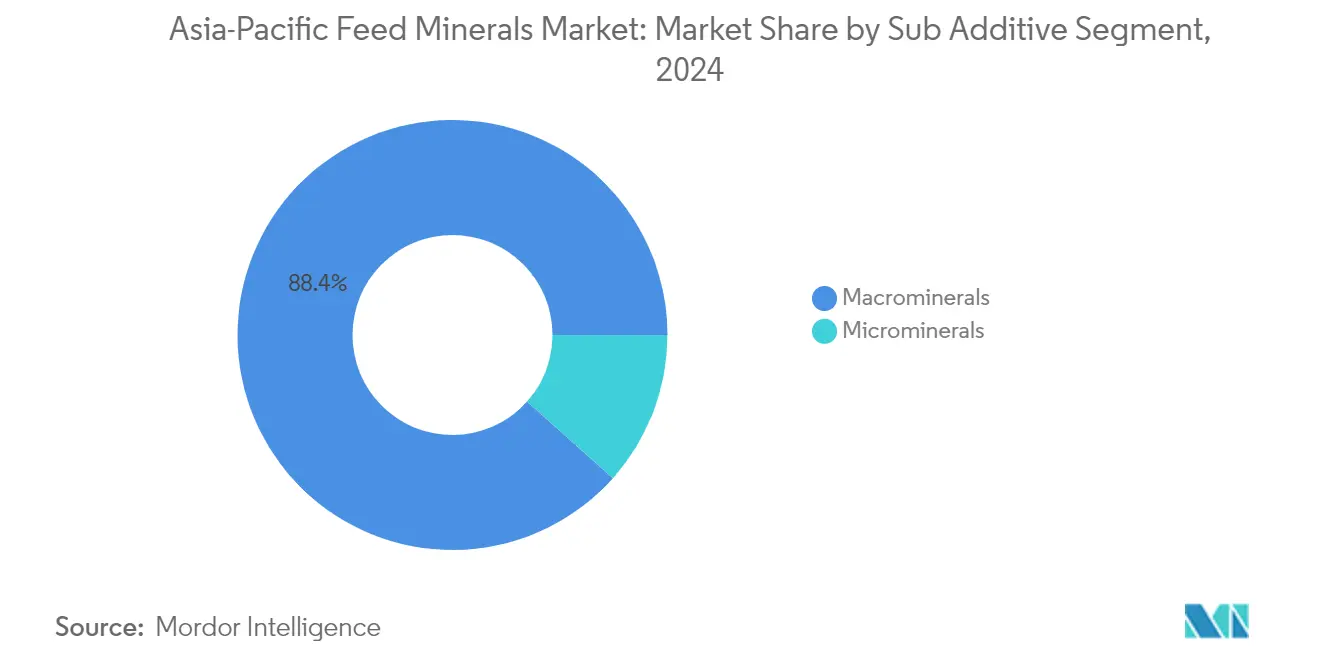

Microminerals Segment in Asia-Pacific Feed Minerals Market
The microminerals segment, while smaller in market share, plays a vital role in the Asia-Pacific feed minerals market by providing essential nutrients for cellular metabolism and skeletal structure formation in animals. The segment is particularly significant in the poultry industry, where it holds the largest share of micromineral consumption at approximately 50%, followed by the swine segment at 31%. Microminerals are crucial during stressful situations that alter animals' physiological needs, making them an indispensable component of modern animal mineral supplements. The segment's growth is supported by increasing awareness of micromineral benefits in preventing various diseases and improving animal immunity, particularly in developing markets across the region.
Segment Analysis: Animal
Poultry Segment in Asia-Pacific Feed Minerals Market
The poultry segment maintains its dominant position in the Asia-Pacific feed minerals market, commanding approximately 44% of the market share in 2024. This substantial market presence is primarily driven by the segment's high consumption of both macro and microminerals, with broilers accounting for about 68% of the poultry segment. The segment's leadership is further strengthened by the rapid expansion of industrial poultry farms across the region and the rising demand for eggs and meat products. China leads the poultry feed minerals consumption with around 50% market share, followed by India and Thailand, reflecting the robust growth of the poultry industry in these countries. The increasing awareness about the benefits of mineral feed supplements in poultry diets, particularly their role in improving feed conversion and weight gain, continues to drive market growth in this segment.
Aquaculture Segment in Asia-Pacific Feed Minerals Market
The aquaculture segment is emerging as the fastest-growing sector in the Asia-Pacific feed minerals market, projected to experience significant growth during the forecast period 2024-2029. This growth is primarily driven by the expansion of commercial aquaculture production and increasing awareness about the benefits of minerals in aquatic species nutrition. The segment's growth is particularly notable in countries like Vietnam and the Philippines, where government initiatives are supporting aquaculture development. Fish feed minerals, which constitute about 74% of the aquaculture segment, are witnessing increased demand due to their critical role in maintaining acid-base equilibrium and osmotic interaction in the aquatic environment. The rising consumption of fish and seafood products, coupled with technological advancements in aquaculture farming, is further accelerating the segment's growth trajectory.
Remaining Segments in Animal Segmentation
The remaining segments in the Asia-Pacific feed minerals market include swine and ruminants, each playing crucial roles in shaping the market landscape. The swine segment maintains significant importance in countries like China and Vietnam, where pork consumption remains high and commercial pig farming continues to expand. The ruminants segment, particularly focusing on dairy cattle and beef cattle, demonstrates steady growth driven by the increasing demand for dairy products and meat across the region. These segments benefit from ongoing technological advancements in animal nutrition and the growing awareness of mineral supplementation benefits. The market also includes a small but notable other animals segment, which caters to specialized livestock such as horses and rabbits, contributing to the overall market diversity.
Asia-Pacific Feed Minerals Market Geography Segment Analysis
Feed Minerals Market in China
China dominates the Asia-Pacific feed minerals market, holding approximately 46% market share in 2024. The country's market leadership is driven by its vast livestock industry and increasing focus on animal nutrition minerals and health. The growing awareness about the benefits of feed minerals in improving animal productivity and health has led to widespread adoption across various animal segments. China's poultry sector, in particular, has shown significant demand for feed minerals, accounting for nearly half of the country's feed minerals consumption. The country's transition towards organized livestock farming and the implementation of advanced feeding practices have further boosted the market. Additionally, the increasing consumer demand for high-quality meat products has prompted farmers to focus more on animal nutrition, driving the adoption of livestock mineral supplements. The government's support for modernizing the livestock industry and emphasis on food security has also contributed to market growth.
Feed Minerals Market in Japan
Japan's feed minerals market is experiencing remarkable growth, projected to expand at approximately 5% CAGR from 2024 to 2029. The country's advanced livestock industry and strong focus on animal health and nutrition have created a robust market for mineral feed supplements. Japanese farmers are increasingly adopting scientific feeding practices, incorporating precise mineral supplementation in animal diets. The country's strict quality standards and regulatory framework ensure the use of high-quality feed minerals, making it a premium market for manufacturers. The ruminant segment, particularly dairy cattle, represents a significant portion of feed mineral consumption, reflecting Japan's sophisticated dairy industry. The country's emphasis on research and development in animal nutrition has led to the development of innovative feed mineral formulations. Furthermore, the growing consumer preference for high-quality meat and dairy products has encouraged farmers to optimize animal nutrition through mineral supplementation.
Feed Minerals Market in India
India's feed minerals market demonstrates strong potential, supported by the country's massive livestock population and growing awareness about scientific feeding practices. The ruminant segment, particularly dairy cattle, drives significant demand for mineral feed supplements, reflecting India's position as a global leader in milk production. The country's poultry industry has also emerged as a major consumer of feed minerals, driven by increasing meat consumption and the modernization of poultry farming practices. The government's initiatives to improve livestock productivity through better nutrition have created a favorable environment for market growth. Local manufacturers are expanding their production capabilities to meet the growing demand, while international players are strengthening their presence through partnerships and distribution networks. The increasing adoption of commercial feed and rising awareness about the benefits of mineral supplementation among small and medium-scale farmers continue to drive market expansion.
Feed Minerals Market in Other Countries
The feed minerals market in other Asia-Pacific countries exhibits diverse growth patterns influenced by local livestock industries and feeding practices. Countries like Indonesia, Thailand, and Vietnam are witnessing increased adoption of feed minerals, driven by the modernization of their livestock sectors. The Philippines and South Korea demonstrate growing awareness about the importance of mineral supplementation in animal nutrition, particularly in their poultry and swine segments. Australia's market is characterized by its focus on high-quality feed minerals for its extensive cattle industry. These countries are experiencing varying degrees of market development, influenced by factors such as government support, industry modernization, and changing consumer preferences. The increasing presence of international feed mineral manufacturers and growing investment in local production capabilities are helping develop these markets further. Additionally, the rising awareness about scientific feeding practices and the benefits of mineral supplementation continues to drive market growth across these countries.

Competitive Landscape
Top Companies in Asia-Pacific Feed Minerals Market
The leading companies in the feed minerals market are focusing on strengthening their positions through various strategic initiatives. Product innovation remains a key trend, with companies developing specialized mineral formulations for different animal species and introducing new delivery mechanisms for better bioavailability. Operational agility is demonstrated through the establishment of research and development centers, particularly in strategic locations like Singapore, to address regional challenges in animal nutrition. Companies are actively pursuing expansion through partnerships and joint ventures, especially in high-growth markets like China and India. Strategic moves include acquisitions of regional feed mills, technology startups, and distribution partnerships to enhance market penetration and product development capabilities. Manufacturing facility investments across multiple countries and the development of innovative solutions through research collaborations with universities and customers are becoming increasingly common approaches.
Market Structure Shows Mixed Competition Dynamics
The Asia-Pacific feed minerals market exhibits a relatively fragmented structure with a mix of global conglomerates and regional specialists. Major global players leverage their extensive research capabilities and broad product portfolios to maintain strong positions, while regional players capitalize on their local market knowledge and established distribution networks. The market demonstrates moderate consolidation, with the top five companies holding a significant but not dominant share, indicating room for competition and new entrants. These leading players typically operate as diversified chemical or agricultural companies with animal feed additives as part of their broader portfolio.
Merger and acquisition activity in the market is characterized by strategic moves aimed at vertical integration and geographic expansion. Global players are actively acquiring regional feed mills and local manufacturers to strengthen their presence in key markets, while also pursuing partnerships with technology companies to enhance their product development capabilities. The trend of consolidation is particularly evident in emerging markets where larger companies are acquiring local players to gain immediate market access and established distribution channels. Joint ventures between international and local companies are becoming increasingly common, especially in markets with complex regulatory environments or specific local requirements.
Innovation and Distribution Drive Market Success
Success in the feed minerals market increasingly depends on companies' ability to innovate while maintaining strong distribution networks. Incumbent companies are focusing on developing specialized products for specific animal segments, particularly in high-growth areas like poultry and aquaculture. The emphasis is on creating more bioavailable mineral formulations that improve absorption and effectiveness while reducing environmental impact. Companies are also investing in digital technologies for better customer service and supply chain management, while establishing strong relationships with key stakeholders including feed manufacturers and large-scale farming operations.
For contenders looking to gain market share, the focus needs to be on developing niche products for underserved segments while building robust distribution networks. Success factors include establishing strong technical support services, developing cost-effective solutions for price-sensitive markets, and maintaining compliance with evolving regulatory standards. Companies must also address the growing emphasis on sustainable practices and traceability in the feed industry. The regulatory environment, particularly in countries like China and India, continues to shape market dynamics, with companies needing to maintain strong quality control systems and documentation processes. Building relationships with local agricultural cooperatives and industry associations is becoming increasingly important for market success. Manufacturers of mineral additives are also focusing on these strategies to enhance their market presence.
Asia-Pacific Feed Minerals Industry Leaders
Archer Daniel Midland Co.
BASF SE
Cargill Inc.
SHV (Nutreco NV)
Solvay S.A.
- *Disclaimer: Major Players sorted in no particular order


Recent Industry Developments
- January 2023: Novus International acquired the Biotech company Agrivida to develop new feed additives.
- April 2022: Novus International opened a new corporate office in India. This helps the company to improve its market and access the advantage of the location.
- December 2021: Nutreco partnered with the tech start-up Stellapps. This will give accessibility for the company to sell feed products, premixes, and feed additives to three million smallholder farmers using Stellapps’ technology.


Asia-Pacific Feed Minerals Market Report Scope
Macrominerals, Microminerals are covered as segments by Sub Additive. Aquaculture, Poultry, Ruminants, Swine are covered as segments by Animal. Australia, China, India, Indonesia, Japan, Philippines, South Korea, Thailand, Vietnam are covered as segments by Country.Sub Additive
| Macrominerals |
| Microminerals |
Animal
| Aquaculture | By Sub Animal | Fish |
| Shrimp | ||
| Other Aquaculture Species | ||
| Poultry | By Sub Animal | Broiler |
| Layer | ||
| Other Poultry Birds | ||
| Ruminants | By Sub Animal | Beef Cattle |
| Dairy Cattle | ||
| Other Ruminants | ||
| Swine | ||
| Other Animals |
Geography
| Australia |
| China |
| India |
| Indonesia |
| Japan |
| Philippines |
| South Korea |
| Thailand |
| Vietnam |
| Rest of Asia-Pacific |
| Sub Additive | Macrominerals | ||
| Microminerals | |||
| Animal | Aquaculture | By Sub Animal | Fish |
| Shrimp | |||
| Other Aquaculture Species | |||
| Poultry | By Sub Animal | Broiler | |
| Layer | |||
| Other Poultry Birds | |||
| Ruminants | By Sub Animal | Beef Cattle | |
| Dairy Cattle | |||
| Other Ruminants | |||
| Swine | |||
| Other Animals | |||
| Geography | Australia | ||
| China | |||
| India | |||
| Indonesia | |||
| Japan | |||
| Philippines | |||
| South Korea | |||
| Thailand | |||
| Vietnam | |||
| Rest of Asia-Pacific | |||


Market Definition
- FUNCTIONS - For the study, feed additives are considered to be commercially manufactured products that are used to enhance characteristics such as weight gain, feed conversion ratio, and feed intake when fed in appropriate proportions.
- RESELLERS - Companies engaged in reselling feed additives without value addition have been excluded from the market scope, to avoid double counting.
- END CONSUMERS - Compound feed manufacturers are considered to be end-consumers in the market studied. The scope excludes farmers buying feed additives to be used directly as supplements or premixes.
- INTERNAL COMPANY CONSUMPTION - Companies engaged in the production of compound feed as well as the manufacturing of feed additives are part of the study. However, while estimating the market sizes, the internal consumption of feed additives by such companies has been excluded.
| Keyword | Definition |
|---|---|
| Feed additives | Feed additives are products used in animal nutrition for purposes of improving the quality of feed and the quality of food from animal origin, or to improve the animals’ performance and health. |
| Probiotics | Probiotics are microorganisms introduced into the body for their beneficial qualities. (It maintains or restores beneficial bacteria to the gut). |
| Antibiotics | Antibiotic is a drug that is specifically used to inhibit the growth of bacteria. |
| Prebiotics | A non-digestible food ingredient that promotes the growth of beneficial microorganisms in the intestines. |
| Antioxidants | Antioxidants are compounds that inhibit oxidation, a chemical reaction that produces free radicals. |
| Phytogenics | Phytogenics are a group of natural and non-antibiotic growth promoters derived from herbs, spices, essential oils, and oleoresins. |
| Vitamins | Vitamins are organic compounds, which are required for normal growth and maintenance of the body. |
| Metabolism | A chemical process that occurs within a living organism in order to maintain life. |
| Amino acids | Amino acids are the building blocks of proteins and play an important role in metabolic pathways. |
| Enzymes | Enzyme is a substance that acts as a catalyst to bring about a specific biochemical reaction. |
| Anti-microbial resistance | The ability of a microorganism to resist the effects of an antimicrobial agent. |
| Anti-microbial | Destroying or inhibiting the growth of microorganisms. |
| Osmotic balance | It is a process of maintaining salt and water balance across membranes within the body's fluids. |
| Bacteriocin | Bacteriocins are the toxins produced by bacteria to inhibit the growth of similar or closely related bacterial strains. |
| Biohydrogenation | It is a process that occurs in the rumen of an animal in which bacteria convert unsaturated fatty acids (USFA) to saturated fatty acids (SFA). |
| Oxidative rancidity | It is a reaction of fatty acids with oxygen, which generally causes unpleasant odors in animals. To prevent these, antioxidants were added. |
| Mycotoxicosis | Any condition or disease caused by fungal toxins, mainly due to contamination of animal feed with mycotoxins. |
| Mycotoxins | Mycotoxins are toxin compounds that are naturally produced by certain types of molds (fungi). |
| Feed Probiotics | Microbial feed supplements positively affect gastrointestinal microbial balance. |
| Probiotic yeast | Feed yeast (single-cell fungi) and other fungi used as probiotics. |
| Feed enzymes | They are used to supplement digestive enzymes in an animal’s stomach to break down food. Enzymes also ensure that meat and egg production is improved. |
| Mycotoxin detoxifiers | They are used to prevent fungal growth and to stop any harmful mold from being absorbed in the gut and blood. |
| Feed antibiotics | They are used both for the prevention and treatment of diseases but also for rapid growth and development. |
| Feed antioxidants | They are used to protect the deterioration of other feed nutrients in the feed such as fats, vitamins, pigments, and flavoring agents, thus providing nutrient security to the animals. |
| Feed phytogenics | Phytogenics are natural substances, added to livestock feed to promote growth, aid in digestion, and act as anti-microbial agents. |
| Feed vitamins | They are used to maintain the normal physiological function and normal growth and development of animals. |
| Feed flavors and sweetners | These flavors and sweeteners help to mask tastes and odors during changes in additives or medications and make them ideal for animal diets undergoing transition. |
| Feed acidifiers | Animal feed acidifiers are organic acids incorporated into the feed for nutritional or preservative purposes. Acidifiers enhance congestion and microbiological balance in the alimentary and digestive tracts of livestock. |
| Feed minerals | Feed minerals play an important role in the regular dietary requirements of animal feed. |
| Feed binders | Feed binders are the binding agents used in the manufacture of safe animal feed products. It enhances the taste of food and prolongs the storage period of the feed. |
| Key Terms | Abbreviation |
| LSDV | Lumpy Skin Disease Virus |
| ASF | African Swine Fever |
| GPA | Growth Promoter Antibiotics |
| NSP | Non-Starch Polysaccharides |
| PUFA | Polyunsaturated Fatty Acid |
| Afs | Aflatoxins |
| AGP | Antibiotic Growth Promoters |
| FAO | The Food And Agriculture Organization of the United Nations |
| USDA | The United States Department of Agriculture |


Research Methodology
Mordor Intelligence follows a four-step methodology in all our reports.
- Step-1: IDENTIFY KEY VARIABLES: In order to build a robust forecasting methodology, the variables and factors identified in Step-1 are tested against available historical market numbers. Through an iterative process, the variables required for market forecast are set and the model is built on the basis of these variables.
- Step-2: Build a Market Model: Market-size estimations for the forecast years are in nominal terms. Inflation is not a part of the pricing, and the average selling price (ASP) is kept constant throughout the forecast period.
- Step-3: Validate and Finalize: In this important step, all market numbers, variables and analyst calls are validated through an extensive network of primary research experts from the market studied. The respondents are selected across levels and functions to generate a holistic picture of the market studied.
- Step-4: Research Outputs: Syndicated Reports, Custom Consulting Assignments, Databases & Subscription Platforms


