Market Overview
| Study Period | 2020 - 2031 |
|---|---|
| Forecast Data Period | 2026 - 2031 |
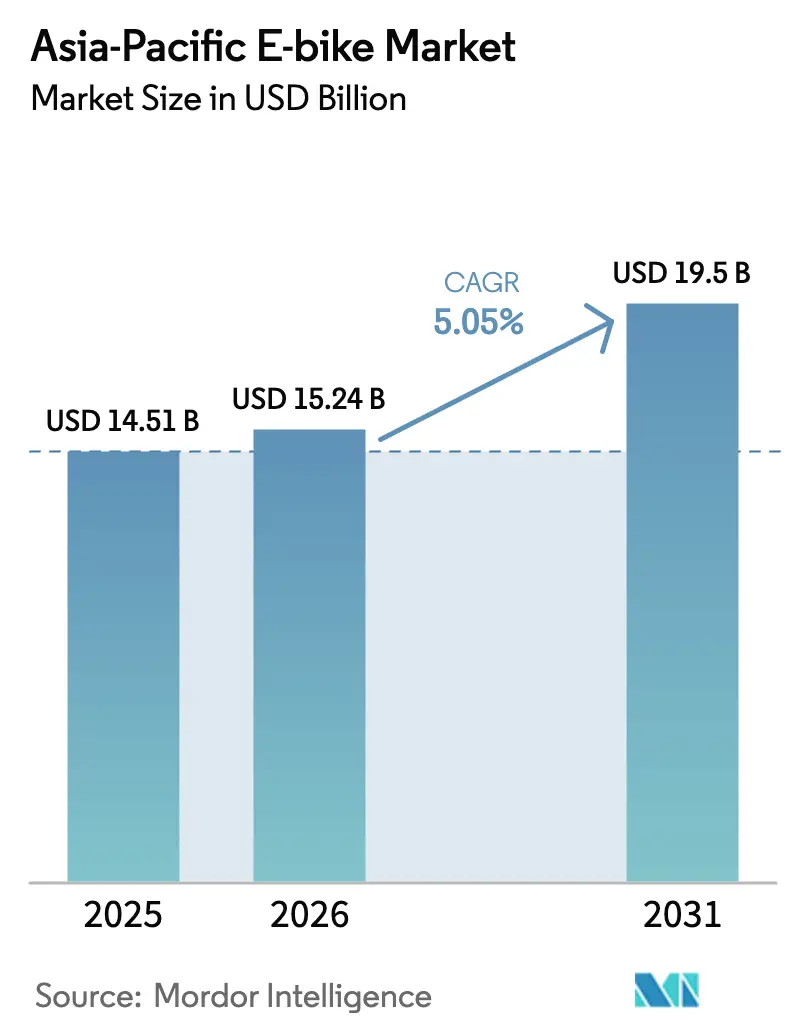
| Base Year Market Size (2025) | USD 14.51 Billion |
| Market Size (2026) | USD 15.24 Billion |
| Market Size (2031) | USD 19.5 Billion |
| Growth Rate (2026 - 2031) | 5.05% CAGR |
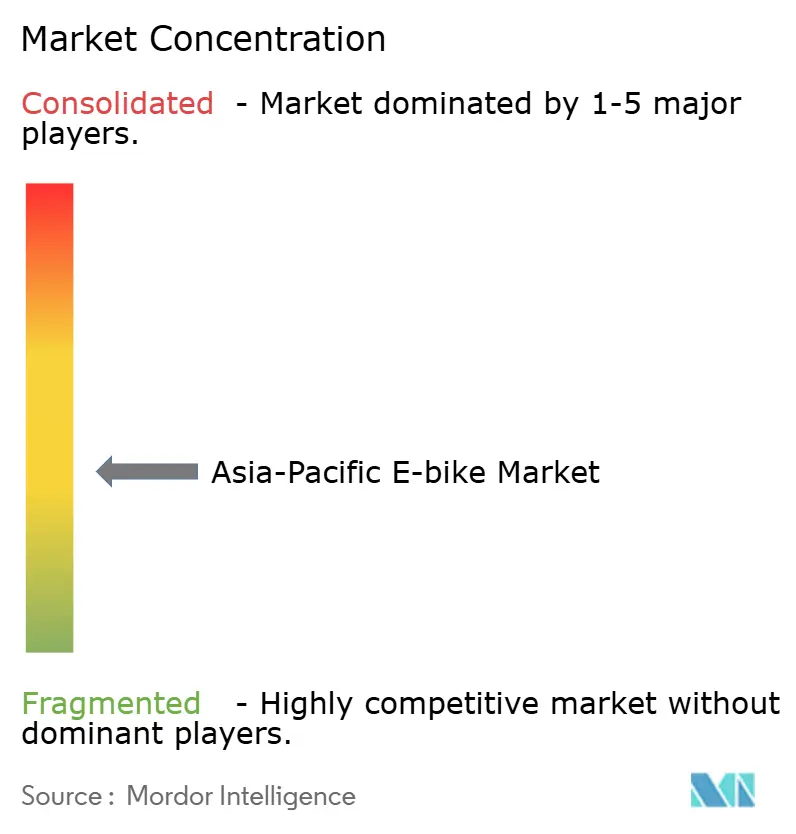
| Market Concentration | Medium |
Major Players*Disclaimer: Major Players sorted in no particular order Image © Mordor Intelligence. Reuse requires attribution under CC BY 4.0. | |
Asia-Pacific E-bike Market Analysis by Mordor Intelligence
Asia-Pacific E-bike Market size in 2026 is estimated at USD 15.24 billion, growing from 2025 value of USD 14.51 billion with 2031 projections showing USD 19.5 billion, growing at 5.05% CAGR over 2026-2031. Demand pivots from simple adoption to technology-rich models, with lithium-ion battery innovation, IoT connectivity, and fleet-level service contracts steering growth. Urban congestion, government subsidies, and corporate ESG commitments add structural momentum, while mid-drive motors, belt drives, and higher-priced models signal a premiumization trajectory. Supply-chain integration around battery manufacturing and motor production creates new barriers to entry. Yet, commercial delivery fleets and tourism-driven mountain routes continue to open fresh volume streams across the Asia-Pacific e-bike market.
Key Report Takeaways
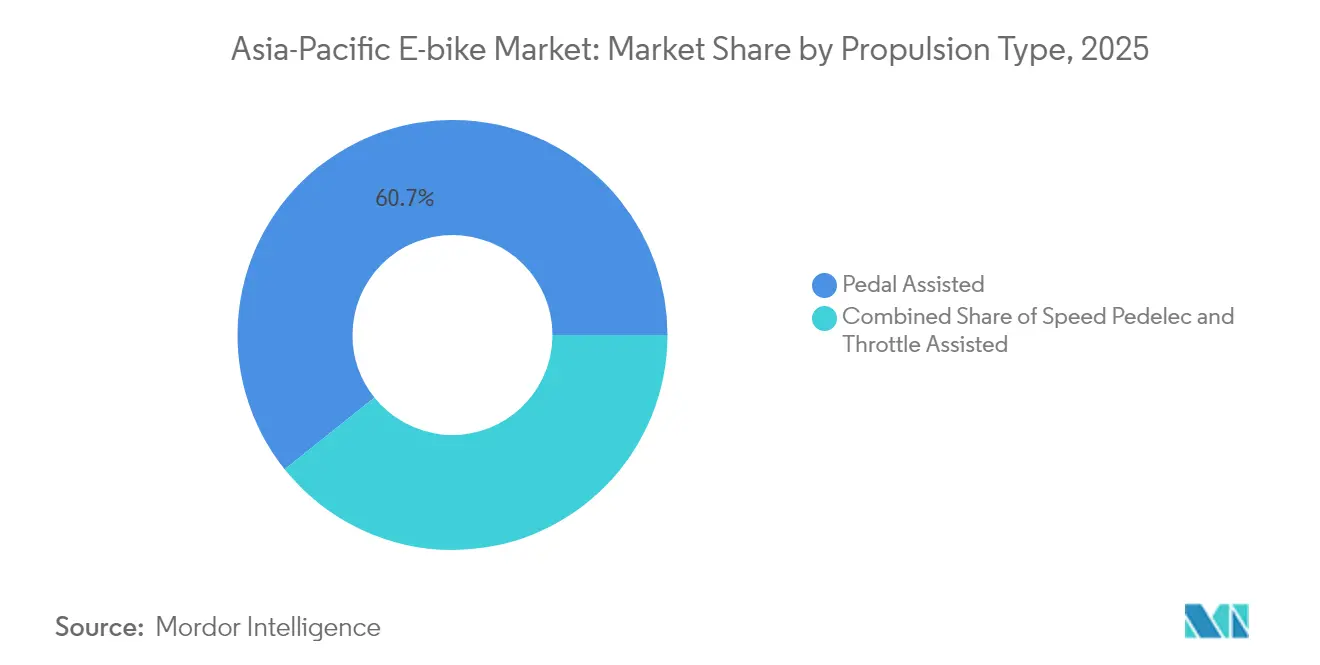
- By propulsion type, pedal-assisted systems led with 60.74% of the Asia-Pacific e-bike market share in 2025, while speed pedelecs are projected to expand at a 5.21% CAGR to 2031.
- By application, city/urban use accounted for 54.22% of the Asia-Pacific e-bike market size in 2025, and trekking/mountain riding is advancing at a 5.12% CAGR through 2031.
- By battery type, lithium-ion captured 72.85% of the Asia-Pacific e-bike market share in 2025; the same chemistry is forecast to grow at a 5.10% CAGR to 2031.
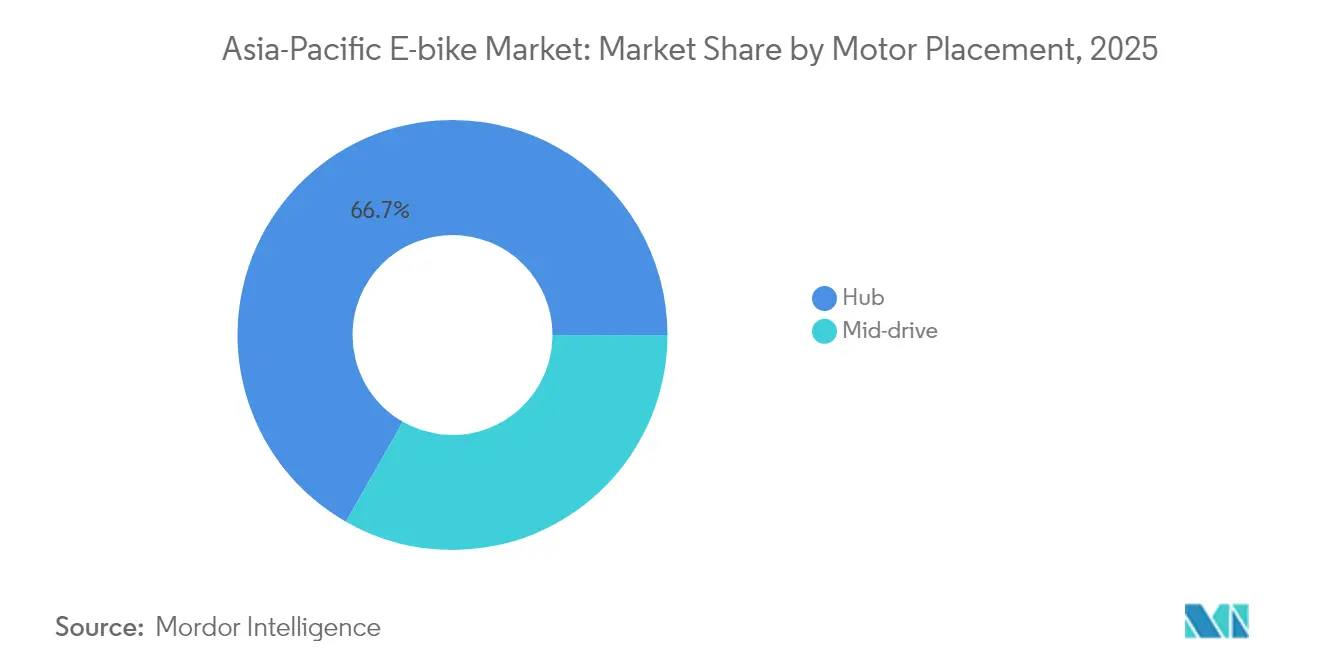
- By motor placement, hub motors commanded 66.74% of the Asia-Pacific e-bike market size in 2025, whereas mid-drive units record the highest projected CAGR at 5.18% through 2031.
- By drive system, chain drives held 62.90% of the Asia-Pacific e-bike market size in 2025; belt drives are set to rise at a 5.09% CAGR to 2031.
- By motor power, sub-250 W units formed 43.05% of the Asia-Pacific e-bike market in 2025, and the 351-500 W band is poised for a 5.08% CAGR to 2031.
- By price band, the USD 600-1,000 range captured 34.12% of the Asia-Pacific e-bike market share in 2025, while the USD 2,500-3,499 tier shows the strongest 5.14% CAGR outlook.
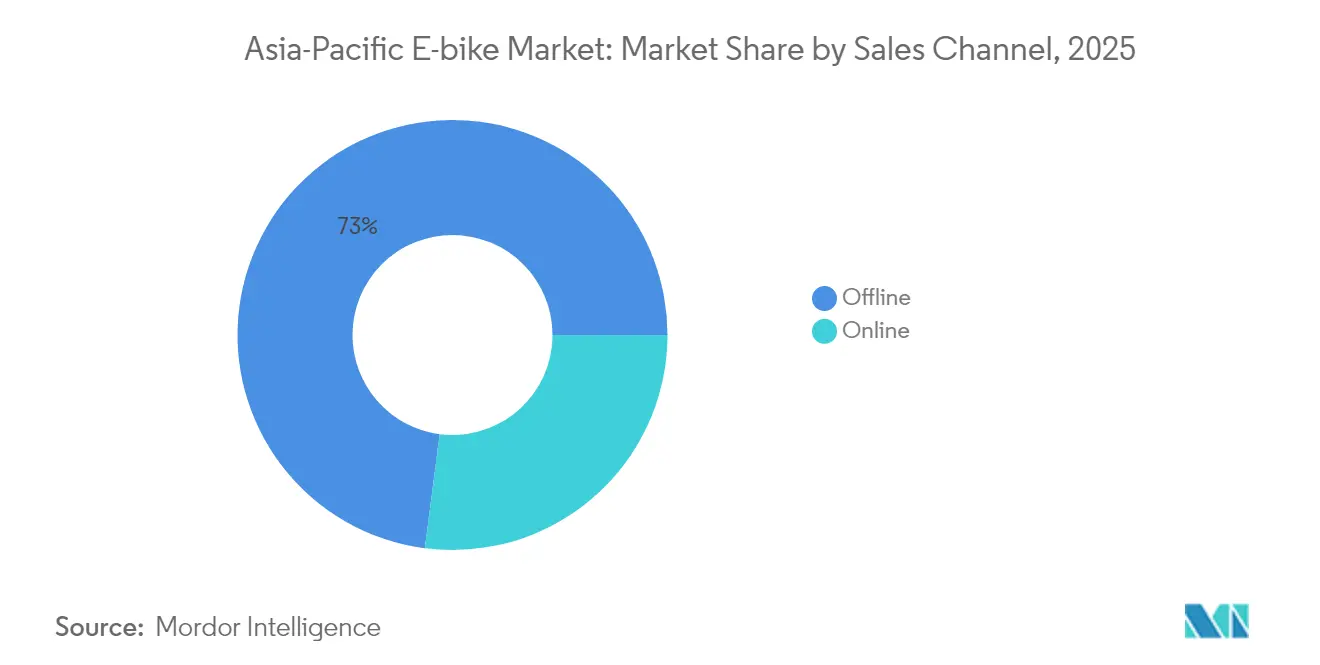
- By sales channel, offline retail contributed 72.95% to the Asia-Pacific e-bike market in 2025; online platforms will accelerate at a 5.17% CAGR to 2031.
- By end use, personal and family riding represented 55.78% of the Asia-Pacific e-bike market share in 2025, whereas commercial delivery fleets led growth at a 5.11% CAGR through 2031.
- By geography, China retained 35.86% of the Asia-Pacific e-bike market share in 2025, and India exhibits the fastest 5.20% CAGR to 2031.
Note: Market size and forecast figures in this report are generated using Mordor Intelligence’s proprietary estimation framework, updated with the latest available data and insights as of 2026.
Asia-Pacific E-bike Market Trends and Insights
Drivers Impact Analysis*
| Driver | (~) % Impact on CAGR Forecast | Geographic Relevance | Impact Timeline |
|---|---|---|---|
| Government Incentives | +1.2% | China, India, Vietnam, Indonesia | Medium term (2-4 years) |
| Urban Congestion | +0.9% | Asia Pacific urban centers, spill-over to secondary cities | Long term (≥ 4 years) |
| LI-Ion Battery Cost | +0.8% | Global, with manufacturing concentrated in China, South Korea | Short term (≤ 2 years) |
| ESG-Driven Corporate Fleet Adoption | +0.7% | Australia, Japan, Singapore, urban China | Medium term (2-4 years) |
| IOT-Enabled Subscription Models | +0.6% | Developed Asia Pacific markets, expanding to emerging economies | Medium term (2-4 years) |
| Tourism-Led Mountain-Route Promotion | +0.4% | Japan, New Zealand, mountain regions across Asia Pacific | Long term (≥ 4 years) |
| Source: Mordor Intelligence | |||


Government Incentives & Subsidies
Policy frameworks across the Asia-Pacific set differentiated growth paths. Vietnam’s pending gasoline motorcycle ban prompted Dat Bike to raise USD 22 million for automated production, underlining how local mandates stimulate investment [1]“Investment News,” Dat Bike, dat. bike . China’s GB38031-2025 battery safety code raises compliance costs yet protects premium brands able to meet stringent testing. Indonesia’s subsidy program persuaded TAILG to localize assembly and open 100 brand stores, highlighting how fiscal tools guide FDI inflows [2]“Overseas Expansion,” Tailg, tailg.com.cn . Meanwhile, the Philippines’ PEZA clearance for Cirtek’s electric motorcycle line shows how fiscal incentives nurture domestic value chains. Governments tilt the Asia-Pacific e-bike market toward firms with robust engineering and supply-chain depth by tying subsidies to safety and local-content rules.
Urban Congestion Driving Micro-Mobility
Rising traffic density pushes commuters toward compact vehicles that sneak through gridlock quickly than cars. Large logistics operators shift last-mile fleets to e-bikes because many Asian downtowns restrict fossil-fuel vans. Jio’s tie-up with a chipset supplier to embed IoT modules illustrates telecom interest in integrating e-bikes into broader smart-city grids. Battery-swap depots for delivery operators, such as the network rolled out in Dubai, shrink downtime and amplify route efficiency. City planners in Jakarta, Bangkok, and Manila reserve curb space for micro-mobility parking, while congestion pricing and low-emission zones make pedal-assist bikes a cost-effective alternative to motorcycles. Together, these factors cement structural tailwinds for the Asia-Pacific e-bike market.
Li-Ion Battery Cost & Density Gains
Improvements in cell chemistry, trim pack prices, and extension of riding range without adding weight are needed. Global lithium carbonate prices eased in 2024, cutting component costs for manufacturers across the Asia-Pacific e-bike industry. Firms like CATL and BYD push sodium-ion R&D to diversify raw-material dependency and reduce fire risk. Yadea’s 2025 sodium-ion launch marks the first commercial rollout, pairing 1,000-cycle life with simplified thermal management. Panasonic’s 18650 cells continue to power higher-end pedelecs, combining 250 Wh/kg energy density with reliable fast-charge capability. Fast-charging and modular swapping shrink fleet downtime, underpinning broader uptake across the Asia-Pacific e-bike market.
ESG-Driven Corporate Fleet Adoption
Decarbonization pledges spur corporations to electrify their delivery and employee mobility fleets. Shared operator Beam hit adjusted EBITDA breakeven during H2 2023 while lifting revenue by one-third, underscoring the commercial viability of enterprise subscription models. Employers fold e-bike benefits into wellness packages to boost staff fitness and retention. Insurers now quote lower premiums for low-emission fleets, cutting enterprises' total cost of ownership. Procurement teams favor suppliers who can verify carbon savings, so manufacturers with full ESG disclosure gain a bidding edge. These institutional patterns carve a dependable demand floor for the Asia-Pacific e-bike market.
Restraints Impact Analysis*
| Restraint | (~) % Impact on CAGR Forecast | Geographic Relevance | Impact Timeline |
|---|---|---|---|
| Safety Incidents and Regulatory Gaps | -0.8% | Global, with acute impact in developed markets | Short term (≤ 2 years) |
| Limited Cycling Infrastructure | -0.6% | Emerging Asia Pacific markets, urban centers with inadequate planning | Long term (≥ 4 years) |
| Grey-Market Import Price Erosion | -0.5% | Markets with weak import controls, price-sensitive segments | Short term (≤ 2 years) |
| Mid-Drive Motor Supply Volatility | -0.4% | Global supply chains, concentrated impact on premium segments | Medium term (2-4 years) |
| Source: Mordor Intelligence | |||
Safety Incidents & Regulatory Gaps
Isolated battery fires trigger negative press and stricter rules. Japan mandates registration, insurance, and standardized lighting for small, motorized bicycles, raising compliance outlays for newcomers. Australia enforces varying power caps by state, adding complexity for distributors. Insurance carriers react by hiking premiums on conversion-kit bikes lacking certified batteries, deterring risk-averse consumers. Well-capitalized brands absorb testing costs and leverage safety credentials to differentiate, but budget suppliers lose share, dampening growth in the Asia-Pacific e-bike market during the near term.
Limited Cycling Infrastructure
Bikeway shortages constrain otherwise favorable economics. Local governments in Manila and Ho Chi Minh City draft master plans, yet funding competes with road widening and public transit projects. Secure parking deficits expose riders to theft, a leading deterrent cited in urban surveys. Charging sockets remain sparse in multitenant housing, leaving renters dependent on removable packs. Where lanes do exist, patchy maintenance and parked cars degrade ride quality. Without rapid infrastructure expansion, latent demand in the Asia-Pacific e-bike market risks slower realization.
*Our forecasts treat driver/restraint impacts as directional, not additive. The impact forecasts reflect baseline growth, mix effects, and variable interactions.
Segment Analysis
By Propulsion Type: Speed Pedelecs Drive Performance Shift
Pedal-assisted models captured 60.74% of the Asia-Pacific e-bike market share in 2025, owing to their fitness appeal and straightforward regulatory acceptance. Speed pedelecs are set for a 5.21% CAGR as regulations evolve to permit higher cut-off speeds on suburban commutes. The category’s mix of torque sensors and multi-level assist provides personalized rides, enticing consumers to upgrade from basic throttle bikes. Greater motor control precision lengthens battery life, enhancing the total cost of ownership.
Commuters seek faster door-to-door times on peri-urban corridors where bus service is limited. Authorities in Sydney and Osaka now pilot dedicated fast lanes, encouraging the purchase of compliant 45 km/h pedelecs. Manufacturers differentiate through regenerative braking and app-based ride profiles. Meanwhile, fleet operators adopt throttle-assisted food delivery variants because riders can quickly accelerate from a standstill in stop-and-go traffic. This propulsion stratification enlarges addressable segments inside the Asia-Pacific e-bike market.


By Application Type: Trekking Segments Capitalize on Tourism Growth
Given sustained metro population density, urban riding will dominate 54.22% of the Asia-Pacific e-bike market size in 2025. Trekking and mountain models will climb at a 5.12% CAGR, propelled by cross-border tourism rebounds. Resorts in Hokkaido bundle electric mountain bike rentals into ski-to-summer packages, while Queenstown operators add guided e-treks to adventure portfolios. Range-extended mid-drive systems handle steep gradients without overheating, widening participation to older and less athletic visitors.
City share fleets integrate cargo racks and child seats, broadening household utility. Municipal incentives, such as free helmet giveaways, nudge safety compliance. Cargo/utility builds gain traction for postal routes and campus maintenance duties. The Asia-Pacific e-bike market reduces dependence on commuter sales cycles and achieves more balanced growth by covering diverse use cases.
By Battery Type: Lithium-Ion Consolidation Faces Sodium-Ion Challenge
Lithium-ion packs represented 72.85% of the Asia-Pacific e-bike market size in 2025 and project a 5.10% CAGR through 2031, due to ongoing cost curves. Nickel-manganese-cobalt blends dominate premium tiers, while lithium-iron-phosphate zeroes in value models. Sodium-ion prototypes reach 160 Wh/kg, edging toward commercial parity. Yadea’s first-to-market sodium motorcycle shows tangible progress and gives OEMs optionality if lithium supply tightens.
Lead-acid remains in cost-sensitive rural China but declines steadily as recycling mandates raise disposal fees. Emerging chemistries focus on solid-state electrolytes by 2028, aiming to slash charge times to 20 minutes. Enhanced battery management systems integrate with cloud platforms, enabling predictive health analytics that extend warranty coverage and bolster customer trust across the Asia-Pacific e-bike market.
By Motor Placement: Mid-Drive Systems Gain Performance Edge
Due to assembly simplicity, Hub motors owned 66.74% of the Asia-Pacific e-bike market size in 2025. Yet mid-drive units post a 5.18% CAGR outlook because their centered weight improves climbing and handling. SEG Automotive’s Kreutzer 48 V platform, weighing just 2.8 kg while outputting 95 Nm, exemplifies compact high-torque engineering.
Cargo bikes reap the most benefit as balanced loads minimize fork stress. Adventure riders praise natural pedal feel, driving word-of-mouth adoption. OEMs hedge sourcing risk by dual-qualifying both placements, ensuring production continuity amid rare-earth uncertainties. The resulting technology mix diversifies consumer choice within the Asia-Pacific e-bike market.
By Drive System: Belt Drives Address Maintenance Concerns
Chain drives supplied 62.90% of the Asia-Pacific e-bike market in 2025 but face incremental share loss to belt systems growing at a 5.09% CAGR. Hutchinson’s Crossdyn thermoplastic belt lasts 20,000 km and runs lubrication-free. Urban commuters prize clean pant legs and silent operation. Fleets enjoy lower workshop downtime, offsetting the initial price premium within three years of service life.
Advances in molded tooth profiles prevent slippage under high torque, enabling compatibility with 500 W mid-drives. Retrofit kits expand upgrade pathways for early adopters. As supply scales, belt costs decline, potentially accelerating transition rates in the Asia-Pacific e-bike market beyond current projections.
By Motor Power: Higher Power Segments Capture Performance Demand
Sub-250 W models formed 43.05% of the Asia-Pacific e-bike market size in 2025 because many jurisdictions classify them as bicycles, avoiding license requirements. Still, the 351-500 W band leads to growth at 5.08% CAGR as riders seek faster acceleration for merging with mixed traffic. Variable-output controllers allow bikes to comply with local caps yet unleash higher wages on public roads.
Delivery services choose 500 W hubs to haul 100 kg payloads without sacrificing range. Recreational users in hilly terrain benefit from torque surpluses and widening route options. As policymakers refine definitions, flexible firmware will let OEMs toggle power limits to suit destination rules, bolstering versatility across the Asia-Pacific e-bike market.
By Price Band: Premium Segments Drive Value Migration
The USD 600-1,000 band retained 34.12% of the Asia-Pacific e-bike market share in 2025, balancing affordability and baseline quality. The USD 2,500-3,499 tier rose at 5.14% CAGR, illustrating growing wallet share for design, connectivity, and long-range packs. Utopia’s carbon-fiber frame and voice-control dash at roughly EUR 3,000 typify the premium allure.
Flexible installment plans and corporate leasing reduce the upfront burden. Premium demand spurs suppliers to offer forged aluminum frames, Magura hydraulic brakes, and color touch displays, features that trickle down as economies of scale improve. This ascending price ladder lifts average selling prices and margin depth throughout the Asia-Pacific e-bike market.
By Sales Channel: Online Growth Accelerates Digital Adoption
Brick-and-mortar outlets delivered 72.95% of the Asia-Pacific e-bike market size in 2025, yet e-commerce will post a 5.17% CAGR as shopper confidence grows. High-resolution 3D configurators let buyers visualize builds before checkout. Direct-to-consumer brands bundle doorstep assembly and mobile servicing. Warehouses deploy an AI route plan to offer 48-hour delivery across major metros.
Hybrid “click-and-collect” models combine web orders with local handover, satisfying test-ride instincts. Online reviews and influencer campaigns lower discovery costs, especially in emerging cities lacking specialist dealers. Digital penetration will thus reshape marketing economics across the Asia-Pacific e-bike market.
By End Use: Commercial Delivery Transforms Urban Logistics
Personal riding accounted for 55.78% of the Asia-Pacific e-bike market share in 2025, but courier fleets will expand at a 5.11% CAGR as e-commerce volumes climb. Food aggregators deploy insulated cargo boxes, while postal agencies convert suburban routes. Service technicians adopt pannier-equipped bikes to navigate dense condos faster than vans. Fleet operators emphasize standardized removable batteries and telematics for uptime tracking.
Municipal agencies' institutional pilots validate safety and productivity, signaling policy support. Bulk procurement contracts secure predictable offtake, giving manufacturers scale visibility and fueling R&D investments that benefit the broader Asia-Pacific e-bike market.
Geography Analysis
China held 35.86% of the Asia-Pacific e-bike market share in 2025, supported by mature supply chains, nationwide charging standards, and export-oriented scale. Yadea surpassed multiple cumulative users across 83 countries and accumulated 677 patents, highlighting Chinese leadership in volume and tech IP. Domestic policy promotes higher-value exports, pushing brands to integrate sodium-ion packs and cloud-connected dashboards.
India is the fastest-growing market, with a 5.20% CAGR to 2031, as urban congestion, subsidy vouchers, and rising environmental awareness converge. Hero MotoCorp plans to produce two lakh annual units of Splendor Electric from 2027 and collaborates with Zero Motorcycles for premium variants . PEZA incentives in the Philippines and Make-in-India rules similarly nurture regional production corridors, broadening supply diversity for the Asia-Pacific e-bike market.
Japan, South Korea, Australia, and New Zealand exemplify regulation-heavy yet premium-leaning demand. Japan enforces tight technical specs but supports tourism treks in Nagano and Hokkaido, driving high-end sales. Australia’s state divergences spawn niche compliance models tuned to differing wattage limits. These markets spearhead safety innovation, which is later diffused to price-sensitive areas. Vietnam, Indonesia, and the Philippines combine rapid urbanization with policy instruments aimed at two-wheeler electrification. That Bike’s expansion shows domestic startups can capture share when the government bans internal-combustion bikes from city cores. Importantly, fiscal measures in these countries prioritize local sourcing, re-shaping supply chains, and intensifying competition within the Asia-Pacific e-bike market.
Competitive Landscape
Competition remains fragmented. Yadea and Aima leverage cost advantages to dominate entry-level volumes, while Giant and Merida capture the premium segment through drivetrain innovation and substantial brand equity. Automotive newcomers, like SEG Automotive, introduce compact mid-motors, enhancing OEM differentiation. This fragmented landscape highlights the diverse strategies employed by key players to secure their market positions.
Emerging opportunities lie in subscription platforms that combine hardware with maintenance, charging, and theft insurance. These platforms provide convenience and create recurring revenue streams for companies. Major industry players are pursuing vertical integration, securing motors, frames, and battery cells to shield their margins from commodity price fluctuations. Yadea’s innovations, like graphene packs and broadband motors, serve as prime examples of intellectual property fortification, showcasing the importance of technological advancements in maintaining a competitive edge.
Simultaneously, Taiwanese brands collaborate with cloud platforms, offering over-the-air diagnostics and creating proprietary ecosystems for riders. These partnerships enhance customer retention and provide seamless user experiences. The pace of consolidation quickens as larger firms acquire smaller assemblers, expanding their dealer networks and strengthening their foothold in the Asia-Pacific e-bike market. This trend underscores the growing importance of scale and distribution networks in achieving long-term success in the region.
Asia-Pacific E-bike Industry Leaders
Aima Technology Group Co. Ltd
Jiangsu Xinri E-Vehicle Co. Ltd
Shenzhen TAILG Technology Group Co., LTD.
Yadea Group Holdings Ltd.
Yamaha Bicycles
- *Disclaimer: Major Players sorted in no particular order

Recent Industry Developments
- September 2025: Dat Bike secured USD 22 million to enhance local automation, aiming to strengthen its position in the market as Hanoi prepares to implement a ban on gasoline motorcycles. This funding is expected to support the company's efforts in scaling production and meeting the growing demand for electric motorcycles in Vietnam.
- February 2025: At the Bharat Mobility Global Expo 2025, Hero MotoCorp introduced its VIDA V2 e-scooter, setting the price at INR 96,000 (USD 1,160). The e-scooter offers a range of 165 km on a single charge and is designed to cater to the growing demand for sustainable urban mobility solutions.
- January 2025: Yadea introduced sodium-ion battery electric two-wheelers for commercial sale, marking a significant advancement in the electric two-wheeler market. This innovation highlights the company's commitment to sustainable and efficient energy solutions.


Asia-Pacific E-bike Market Report Scope
By Propulsion Type
| Pedal Assisted |
| Speed Pedelec |
| Throttle Assisted |
By Application Type
| Cargo/Utility |
| City/Urban |
| Trekking/Mountain |
By Battery Type
| Lead Acid Battery |
| Lithium-ion Battery |
| Others |
By Motor Placement
| Hub (front/rear) |
| Mid-drive |
By Drive Systems
| Chain Drive |
| Belt Drive |
By Motor Power
| Less than 250 W |
| 251 to 350 W |
| 351 to 500 W |
| 501 to 600 W |
| More than 600 W |
By Price Band
| Up to USD 600 |
| USD 600 to 1,000 |
| USD 1,000 to 1,499 |
| USD 1,500 to 2,499 |
| USD 2,500 to 3,499 |
| USD 3,500 to 5,999 |
| Above USD 6,000 |
By Sales Channel
| Online |
| Offline |
By End Use
| Commercial Delivery | Retail & Goods Delivery |
| Food & Beverage Delivery | |
| Service Providers | |
| Personal & Family Use | |
| Institutional | |
| Others |
By Country
| Australia |
| China |
| India |
| Japan |
| New Zealand |
| South Korea |
| Rest of Asia Pacific |
| By Propulsion Type | Pedal Assisted | |
| Speed Pedelec | ||
| Throttle Assisted | ||
| By Application Type | Cargo/Utility | |
| City/Urban | ||
| Trekking/Mountain | ||
| By Battery Type | Lead Acid Battery | |
| Lithium-ion Battery | ||
| Others | ||
| By Motor Placement | Hub (front/rear) | |
| Mid-drive | ||
| By Drive Systems | Chain Drive | |
| Belt Drive | ||
| By Motor Power | Less than 250 W | |
| 251 to 350 W | ||
| 351 to 500 W | ||
| 501 to 600 W | ||
| More than 600 W | ||
| By Price Band | Up to USD 600 | |
| USD 600 to 1,000 | ||
| USD 1,000 to 1,499 | ||
| USD 1,500 to 2,499 | ||
| USD 2,500 to 3,499 | ||
| USD 3,500 to 5,999 | ||
| Above USD 6,000 | ||
| By Sales Channel | Online | |
| Offline | ||
| By End Use | Commercial Delivery | Retail & Goods Delivery |
| Food & Beverage Delivery | ||
| Service Providers | ||
| Personal & Family Use | ||
| Institutional | ||
| Others | ||
| By Country | Australia | |
| China | ||
| India | ||
| Japan | ||
| New Zealand | ||
| South Korea | ||
| Rest of Asia Pacific | ||


Market Definition
- By Application Type - E-bikes considered under this segment include city/urban, trekking, and cargo/utility e-bikes. The common types of e-bikes under these three categories include off-road/hybrid, kids, ladies/gents, cross, MTB, folding, fat tire, and sports e-bike.
- By Battery Type - This segment includes lithium-ion batteries, lead-acid batteries, and other battery types. The other battery type category includes nickel-metal hydroxide (NiMH), silicon, and lithium-polymer batteries.
- By Propulsion Type - E-bikes considered under this segment include pedal-assisted e-bikes, throttle-assisted e-bikes, and speed pedelec. While the speed limit of pedal and throttle-assisted e-bikes is usually 25 km/h, the speed limit of speed pedelec is generally 45 km/h (28 mph).
| Keyword | Definition |
|---|---|
| Pedal Assisted | Pedal-assist or pedelec category refers to the electric bikes that provide limited power assistance through torque-assist system and do not have throttle for varying the speed. The power from the motor gets activated upon pedaling in these bikes and reduces human efforts. |
| Throttle Assisted | Throttle-based e-bikes are equipped with the throttle assistance grip, installed on the handlebar, similarly to motorbikes. The speed can be controlled by twisting the throttle directly without the need to pedal. The throttle response directly provides power to the motor installed in the bicycles and speeds up the vehicle without paddling. |
| Speed Pedelec | Speed pedelec is e-bikes similar to pedal-assist e-bikes as they do not have throttle functionality. However, these e-bikes are integrated with an electric motor which delivers power of approximately 500 W and more. The speed limit of such e-bikes is generally 45 km/h (28 mph) in most of the countries. |
| City/Urban | The city or urban e-bikes are designed with daily commuting standards and functions to be operated within the city and urban areas. The bicycles include various features and specifications such as comfortable seats, sit upright riding posture, tires for easy grip and comfortable ride, etc. |
| Trekking | Trekking and mountain bikes are special types of e-bikes that are designed for special purposes considering the robust and rough usage of the vehicles. These bicycles include a strong frame, and wide tires for better and advanced grip and are also equipped with various gear mechanisms which can be used while riding in different terrains, rough grounded, and tough mountainous roads. |
| Cargo/Utility | The e-cargo or utility e-bikes are designed to carry various types of cargo and packages for shorter distances such as within urban areas. These bikes are usually owned by local businesses and delivery partners to deliver packages and parcels at very low operational costs. |
| Lithium-ion Battery | A Li-ion battery is a rechargeable battery, which uses lithium and carbon as its constituent materials. The Li-Ion batteries have a higher density and lesser weight than sealed lead acid batteries and provide the rider with more range per charge than other types of batteries. |
| Lead Acid Battery | A lead acid battery refers to sealed lead acid battery having a very low energy-to-weight and energy-to-volume ratio. The battery can produce high surge currents, owing to its relatively high power-to-weight ratio as compared to other rechargeable batteries. |
| Other Batteries | This includes electric bikes using nickel–metal hydroxide (NiMH), silicon, and lithium-polymer batteries. |
| Business-to-Business (B2B) | The sales of e-bikes to business customers such as urban fleet and logistics company, rental/sharing operators, last-mile fleet operators, and corporate fleet operators are considered under this category. |
| Business-to-Customers (B2C) | The sales of electric scooters and motorcycles to direct consumers is considered under this category. The consumers acquire these vehicles either directly from manufacturers or from other distributers and dealers through online and offline channel. |
| Unorganized Local OEMs | These players are small local manufacturers and assemblers of e-bikes. Most of these manufacturers import the components from China and Taiwan and assemble them locally. They offer the product at low cost in this price sensitive market which give them advantage over organized manufacturers. |
| Battery-as-a-Service | A business model in which the battery of an EV can be rented from a service provider or swapped with another battery when it runs out of charge |
| Dockless e-Bikes | Electric bikes that have self-locking mechanisms and a GPS tracking facility with an average top speed of around 15mph. These are mainly used by bike-sharing companies such as Bird, Lime, and Spin. |
| Electric Vehicle | A vehicle which uses one or more electric motors for propulsion. Includes cars, scooters, buses, trucks, motorcycles, and boats. This term includes all-electric vehicles and hybrid electric vehicles |
| Plug-in EV | An electric vehicle that can be externally charged and generally includes all-electric vehicles as well as plug-in hybrids. In this report we use the term for all-electric vehicles to differentiate them from plug-in hybrid electric vehicles. |
| Lithium-Sulphur Battery | A rechargeable battery that replaces the liquid or polymer electrolyte found in current lithium-ion batteries with sulfur. They have more capacity than Li-ion batteries. |
| Micromobility | Micromobility is one of the many modes of transport involving very-light-duty vehicles to travel short distances. These means of transportation include bikes, e-scooters, e-bikes, mopeds, and scooters. Such vehicles are used on a sharing basis for covering short distances, usually five miles or less. |
| Low Speed Electric Vehicls (LSEVs) | They are low speed (usually less than 25 kmph) light vehicles that do not have an internal combustion engine, and solely use electric energy for propulsion. |


Research Methodology
Mordor Intelligence follows a four-step methodology in all its reports.
- Step-1: Identify Key Variables: To build a robust forecasting methodology, the variables and factors identified in Step-1 are tested against available historical market numbers. Through an iterative process, the variables required for market forecast are set and the model is built based on these variables.
- Step-2: Build a Market Model: Market-size estimations for the historical and forecast years have been provided in revenue and volume terms. Market revenue is calculated by multiplying the volume demand with volume-weighted average battery pack price (per kWh). Battery pack price estimation and forecast takes into account various factors affecting ASP, such as inflation rates, market demand shifts, production costs, technological developments, and consumer preferences, providing estimations for both historical data and future trends.
- Step-3: Validate and Finalize: In this important step, all market numbers, variables, and analyst calls are validated through an extensive network of primary research experts from the market studied. The respondents are selected across levels and functions to generate a holistic picture of the market studied.
- Step-4: Research Outputs: Syndicated Reports, Custom Consulting Assignments, Databases & Subscription Platforms


