Market Overview
| Study Period | 2020 - 2031 |
|---|---|
| Forecast Data Period | 2026 - 2031 |
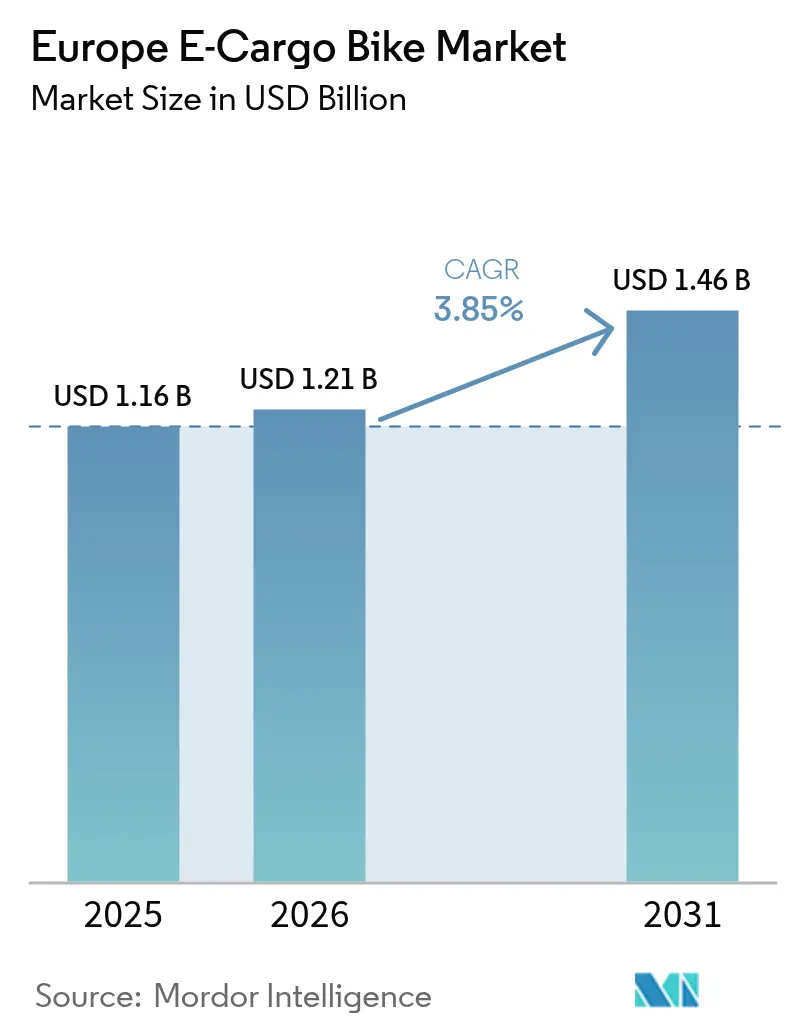
| Base Year Market Size (2025) | USD 1.16 Billion |
| Market Size (2026) | USD 1.21 Billion |
| Market Size (2031) | USD 1.46 Billion |
| Growth Rate (2026 - 2031) | 3.85% CAGR |
| Market Concentration | Medium |
Major Players *Disclaimer: Major Players sorted in no particular order Image © Mordor Intelligence. Reuse requires attribution under CC BY 4.0. | |
Europe E-Cargo Bike Market Analysis by Mordor Intelligence
The Europe e-cargo bike market size in 2026 is estimated at USD 1.21 billion, growing from 2025 value of USD 1.16 billion with 2031 projections showing USD 1.46 billion, growing at 3.85% CAGR over 2026-2031. This outlook captures a maturing demand curve in which supportive regulation, falling lithium-ion battery costs, and urban logistics restructuring continue to nudge adoption forward without the explosive jumps seen in earlier years. City-level zero-emission delivery zones, generous commercial fleet subsidies, and dense micro-fulfillment networks collectively reinforce the business case, while the rapid drop in battery USD/kWh has erased a key cost barrier. Competitive intensity remains moderate: established bicycle brands leverage vertical integration and service networks, yet digital-first entrants add pricing pressure as procurement shifts online. Meanwhile, segment dynamics reveal that pedal-assisted drivetrains, lithium-ion batteries, mid-drive motors, and mid-premium price points define the mainstream commercial specification across Western European hubs.
Key Report Takeaways
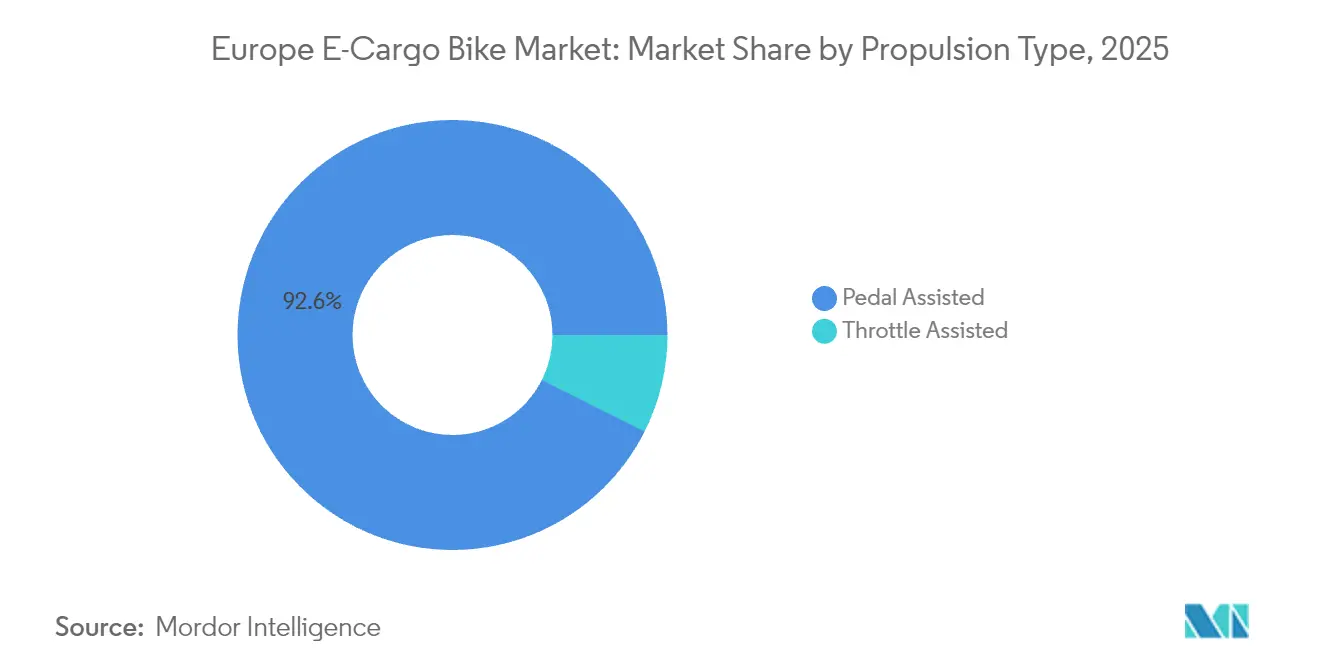
- By propulsion type, pedal-assisted systems commanded 92.58% of the Europe e-cargo bike market share in 2025, while throttle-assisted models are projected to grow at a 4.35% CAGR through 2031.
- By battery type, lithium-ion captured 89.65% share of the Europe e-cargo bike market size in 2025, and is projected to grow with the fastest CAGR of 4.02% by 2031.
- By motor placement, hub systems accounted for 55.72% in 2025, while mid-drive systems are set to expand at a 5.05% CAGR to 2031.
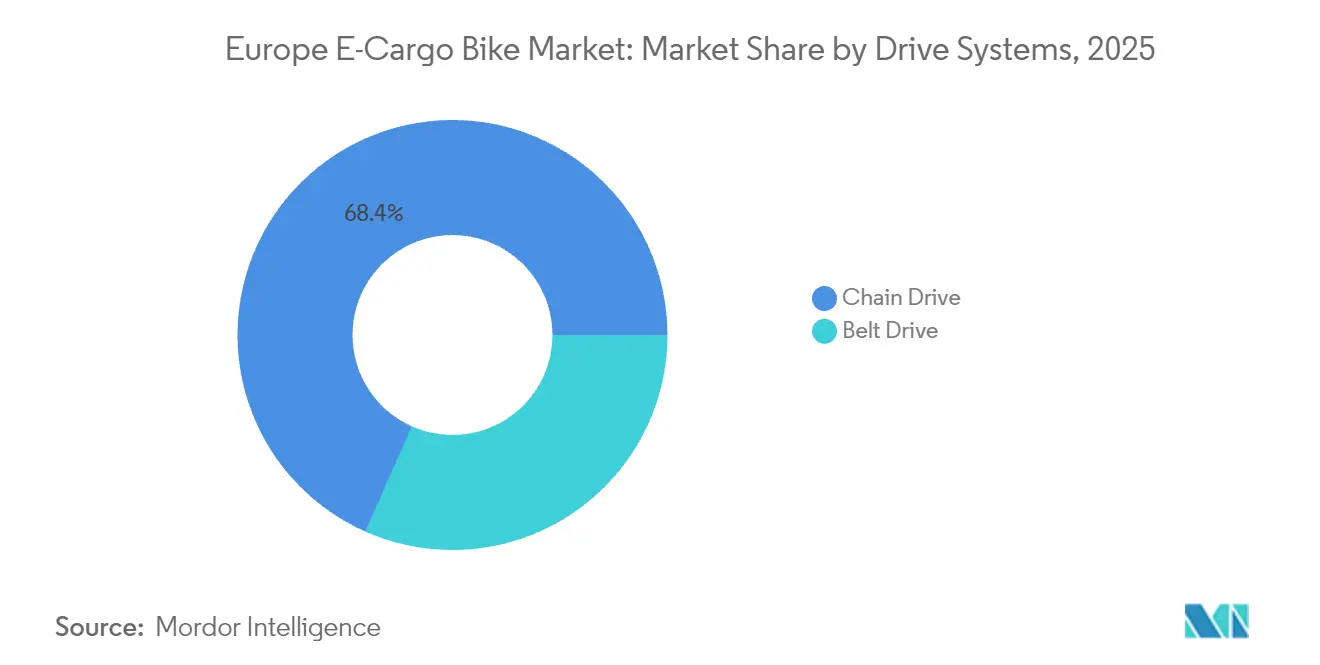
- By drive systems, chain drives captured 68.35% share of the Europe e-cargo bike market size in 2025, while belt drive is projected to grow with the fastest CAGR of 4.69% by 2031.
- By motor power, below-250 W units led with 61.42% share in 2025, while 351-500 W systems will rise at a 5.88% CAGR.
- By price band, the USD 1,500-2,499 dominated with 29.55% share in 2025, while USD 2,500-3,499 segment is on track to post the quickest growth at 5.41% CAGR.
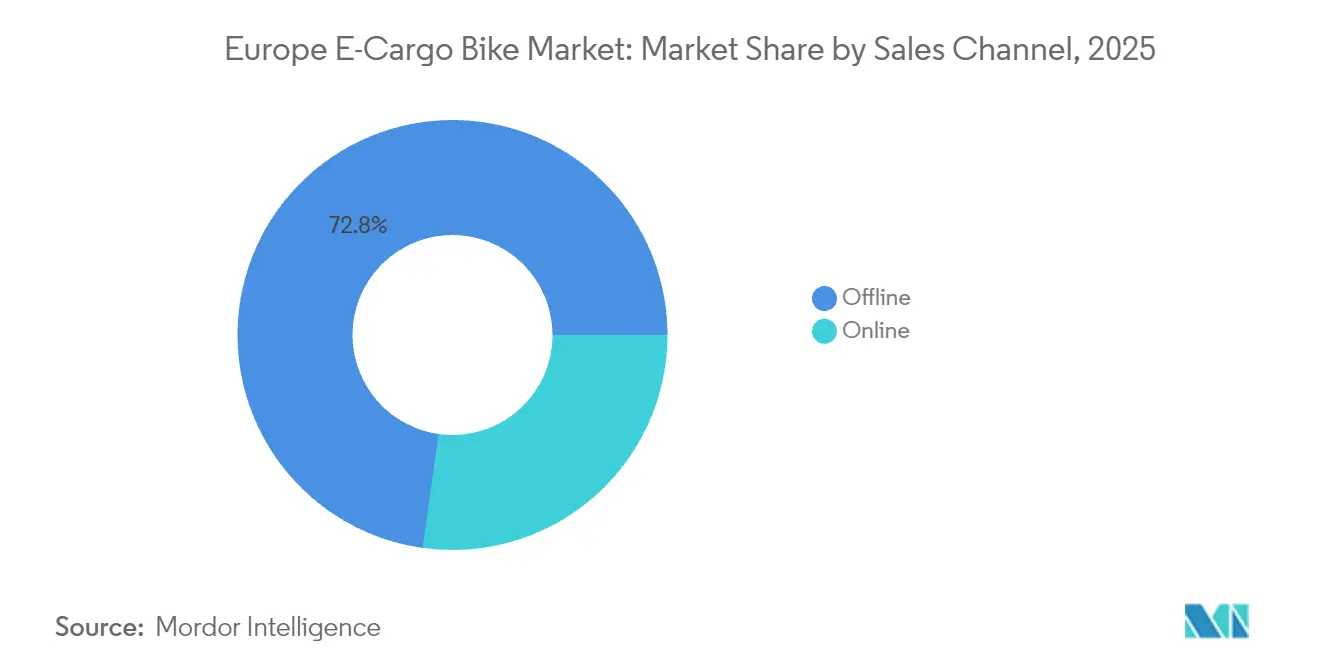
- By sales channel, offline models dominated with 72.78% share in 2025, while online segment is on track to post the quickest growth at 6.86% CAGR.
- By end use, commercial delivery held 54.66% of the Europe e-cargo bike market size in 2025; service providers represent the fastest-growing end-use segment at 6.25% CAGR.
- By geography, Western Europe accounted for 69.48% of regional revenue in 2025, whereas Southern Europe is forecast to lead growth at 4.97% CAGR.
Note: Market size and forecast figures in this report are generated using Mordor Intelligence’s proprietary estimation framework, updated with the latest available data and insights as of 2026.
Europe E-Cargo Bike Market Trends and Insights
Drivers Impact Analysis*
| Driver | (~) % Impact on CAGR Forecast | Geographic Relevance | Impact Timeline |
|---|---|---|---|
| Logistics Zero-Emission Mandates | +1.2% | Western Europe core, expanding to Southern Europe | Medium term (2-4 years) |
| Subsidies for Commercial E-Cargo Fleets | +0.8% | Germany, Netherlands, France; spreading EU-wide | Short term (≤ 2 years) |
| Reducing Battery Cost | +0.7% | Strongest in high-volume markets | Long term (≥ 4 years) |
| Micro-Fulfillment Network Growth | +0.6% | Urban centers across Western and Southern Europe | Medium term (2-4 years) |
| Corporate ESG Procurement Targets | +0.4% | Led by multinational corporations | Long term (≥ 4 years) |
| Insurance Incentives for Low-Speed EVs | +0.3% | Netherlands, Germany; expanding to other markets | Medium term (2-4 years) |
| Source: Mordor Intelligence | |||


Urban-Logistics Zero-Emission Mandates
European municipalities are steadily enlarging zero-emission delivery zones, forcing logistics operators to reassess vehicle economics. Amsterdam’s ban on fossil-fuel vans inside the city core from 2025 has already triggered forward purchases of e-cargo bikes. London’s Ultra Low Emission Zone exposes diesel vans to daily fees that can surpass a threshold that tilts total cost of ownership decisively toward electrically assisted cargo cycles. Regulatory convergence across Germany, France, and the Netherlands compounds these cost signals, prompting pan-European fleets such as Amazon Logistics to standardize on micromobility depots in Berlin, Paris, and Milan. As more cities publish phase-out timelines for internal-combustion vans, operators view the Europe e-cargo bike market as a compliance hedge that preserves route flexibility across jurisdictions.
Subsidies for Commercial E-Cargo Fleets
National and municipal incentive programs now target business buyers rather than consumers. Germany’s BAFA scheme reimburses up to 25% of acquisition cost and can be stacked with local grants that raise subsidy coverage. France’s EUR 55 million (~USD 64 million) bicycle investment fund extends grants to commercial e-cargo fleets [1]“Bicycle Plan 2024-2027,” French Ministry of Ecological Transition, ecologie.gouv.fr. The Netherlands adds significant cargo bike plus tax deductions for small enterprises. These incentives compress payback periods for high-utilization services, explaining why corporate buyers dominate order books in Western Europe.
Rapid Drop in Battery USD/KWH Below EUR 100
Lithium-ion pack prices have reached a significant milestone, eliminating the historical price advantage held by lead-acid batteries. LFP cells dropped significantly, enabling mainstream 800 Wh packs that push real-world range beyond 80 km. Bosch’s PowerTube 800 Wh module delivers 205 Wh/kg energy density while retaining form-factor compatibility with existing Performance Line motors. Lower pack prices free OEM budgets for integrated telematics, further boosting fleet management ROI.
Dense Micro-Fulfilment Network Growth
Third-party logistics and quick-commerce brands now seed micro-depots inside European city centers, shrinking average delivery distance to 4–7 km—an envelope perfectly suited to cargo cycles. EIT InnoEnergy calculates that right-sizing fleets with e-cargo bikes can unlock annual savings across the region. Berlin’s pilot micromobility hub supports daily parcel drops at one-tenth the real-estate footprint of a van-based depot, validating scalability for other capitals. As networks densify, operators gravitate toward mid-drive cargo bikes capable of heavier multistop routes, fueling unit demand even in saturated urban cores.
Restraints Impact Analysis*
| Restraint | (~) % Impact on CAGR Forecast | Geographic Relevance | Impact Timeline |
|---|---|---|---|
| Limited Secure On-Street Charging | -0.5% | Urban centers across Europe, acute in Southern Europe | Medium term (2-4 years) |
| Payload and Range Trade-Offs Versus Vans | -0.4% | Most limiting in suburban/rural delivery routes | Long term (≥ 4 years) |
| Fragmented Component Standards | -0.3% | Europe-wide, affecting cross-border operations | Medium term (2-4 years) |
| Skilled Mechanic Shortage For Mid-Drive | -0.2% | Western Europe primarily, spreading as adoption grows | Short term (≤ 2 years) |
| Source: Mordor Intelligence | |||
Limited Secure On-Street Charging
Most European cities lack purpose-built curbside chargers for commercial e-cargo cycles. Fleet operators therefore tether operations to depots, incurring real-estate and downtime costs when 800 Wh batteries require up to six hours for a full cycle on 4 A chargers. The absence of open standards forces mixed fleets to install proprietary docks from multiple vendors, straining capital budgets. Southern European hubs—Madrid, Rome, Athens—show the largest gaps because shared micromobility policies focus on scooters rather than commercial cargo bikes. Until city councils mandate curbside charging in loading bays, scaling above pilot fleets remains arduous for courier start-ups eyeing the Europe e-cargo bike market.
Payload and Range Trade-Offs Versus Vans
Cargo cycles seldom exceed 200 kg payload or 80 km range, leaving traditional vans indispensable for bulk, long-haul, or suburban routes. Weather variables cut effective range in winter, while rider safety concerns rise in heavy rain or snow. Consequently, logistics planners deploy e-cargo bikes only where stop density and package weight align, capping addressable volume. Although battery and motor power creep upward, physics and regulatory speed caps ensure that vans will remain in mixed fleets, restraining the ceiling on Europe e-cargo bike market penetration.
*Our forecasts treat driver/restraint impacts as directional, not additive. The impact forecasts reflect baseline growth, mix effects, and variable interactions.
Segment Analysis
By Propulsion Type: Pedal-Assisted Dominance Persists Amid Regulatory Clarity
Pedal-assisted drivetrains held 92.58% of the Europe e-cargo bike market share in 2025, reflecting their classification as bicycles under EU Regulation 168/2013, which exempts them from motor-vehicle insurance and licensing. The comfort of regulatory certainty keeps corporate buyers entrenched in this category for mainstream parcel delivery, where average loads hover near 120 kg. The Europe e-cargo bike market size for pedal assist is set to grow steadily as large couriers standardize fleets to minimize training and compliance overhead.
Throttle-assisted alternatives will, however, clock a 4.35% CAGR because heavy grocery, furniture, and municipal waste applications require continuous power unaffected by rider stamina. As Germany, France, and Italy align power-class definitions up to 25 km/h, fleet managers can integrate throttle-assisted units without increasing liability insurance lines. Manufacturers accordingly release dual-mode controllers that let operators toggle between compliance classes, future-proofing assets against evolving city statutes.


By Battery Type: Lithium-Ion Consolidation Accelerates Performance Gains
Lithium-ion technology captured 89.65% share of the Europe e-cargo bike market size in 2025 and continues rising at a 4.02% CAGR as kilowatt-hour costs freefall. Pack lifespans now reach significant full cycles, aligning with corporate fleet replacement timelines. LFP chemistry absorbs most volume due to intrinsic thermal stability and a notable cycle durability, a critical trait for high-turnover courier missions.
Lead-acid persists only in entry-level consumer cargo bikes where purchase price trumps total cost of ownership. Solid-state prototypes attract headlines but remain four years from commercial costing parity. In the interim, OEM focus shifts to smart battery management systems with cell-level monitoring, Bluetooth diagnostics, and geofenced immobilization—capabilities that enhance residual value at fleet resale.
By Motor Placement: Mid-Drive Systems Gain Commercial Traction
Hub motors still hold 55.72% share yet mid-drive units will grow above the market at 5.05% CAGR through 2031. The torque multiplication afforded by integrating with bicycle gearing proves invaluable on gradients common in Lisbon or Lyon. Bosch’s Performance Line CX Cargo motor delivers 85 Nm, enabling 200 kg payload starts on inclines without rider strain .
Higher maintenance complexity once deterred buyers, but expanding service networks and predictive diagnostic apps reduce downtime. Some fleet operators now benchmark hub versus mid-drive total cost of ownership at near parity after year two, tipping the specification mix toward the latter for utility-intensive routes.
By Drive Systems: Belt Drive Gains Momentum in Premium Fleets
Due to universal availability and lower upfront cost, chain drives dominated 68.35% of unit sales in 2025. Yet belt drives will outpace at 4.69% CAGR as food delivery, pharma courier, and childcare transport segments value oil-free drivetrains. Gates Carbon Drive systems significantly outlast traditional chains, offering a lifespan far superior to standard alternatives .
Although belt-compatible frames and rear hubs add a notable amount to the bill of materials, reduced workshop downtime and cleaner brand presentation sway enterprise buyers. As a result, mid-premium SKUs increasingly default to belt options while chains migrate to price-sensitive consumer tiers.
By Motor Power: Mid-Range Categories Capture Commercial Demand
Below-250 W motors dominate with 61.42% share in 2025 due to relaxed regulatory treatment, but fleets moving heavier packages now adopt 351-500 W units, which will rise 5.88% CAGR to 2031. These power classes exploit a loophole in some national rules that still recognize them as pedalecs when speed governors hold at 25 km/h. OEMs fit torque sensors that temper power output during compliance checks yet unleash full wattage under load, offering a pragmatic balance between legality and performance.
Above-600 W systems survive in bespoke municipal or industrial builds where type-approval processes are feasible. However, the absence of pan-EU harmonization restricts these high-power classes to captive geographies, limiting scale economies.
By Price Band: Premium Segments Reflect Commercial Investment Appetite
Units priced USD 1,500-2,499 led revenue at 29.55% in 2025, illustrating the sweet spot where mid-drive motors, 700 Wh batteries, and hydraulic brakes converge. The USD 2,500-3,499 tier will expand 5.41% CAGR, buoyed by procurement teams trading up for integrated telematics, GPS antitheft, and dual-battery rails. Flexible financing from leasing platforms like Deutsche Leasing spreads higher tickets, converting capex to opex.
Below-USD 1,000 cargo bikes remain largely consumer purchases, hampered by steel frames and small batteries that fail commercial duty cycles. The USD 3,500-5,999 and ultra-premium brackets cater to specialized police, emergency medical, and utility configurations with sirens, lockable cargo bays, and high-visibility lighting kits.
By Sales Channel: Digital Transformation Reshapes B2B Procurement
Brick-and-mortar (offline) dealers retained 72.78% of 2025 sales because fleets value pre-delivery inspection, rider training, and on-site warranty repairs. However, dedicated B2B portals and manufacturer-run configurators enable buyers to scope fleet specifications, compare TCO calculators, and schedule demos online. Consequently, online transactions will grow 6.86% CAGR, siphoning standardized SKUs away from physical showrooms.
Dealers adapt by bundling service contracts and stocking demo fleets rather than chasing high-volume one-off sales. Some align with OEM subscription models, converting showroom footprints into local service hubs that fulfill online-generated orders.
By End Use: Service Providers Propel Market Diversification
Commercial delivery accounted for 54.66% of 2025 revenue, mirroring Europe’s parcel boom and food-delivery culture. Yet service-sector deployments—from HVAC repair and meter reading to landscaping—will record a 6.25% CAGR as businesses discover branding and access advantages. Municipalities pilot cargo bikes for street cleaning and park maintenance, embedding stable public-sector demand into the European e-cargo bike market.
Service providers typically field smaller fleets but drive higher annual mileage, stressing component durability and uptime. This usage profile steers procurement toward mid-drive, belt-drive, and large-battery specs, reinforcing premiumization trends across OEM catalogs.
Geography Analysis
Western Europe generated 69.48% of 2025 revenue, underpinned by Germany’s significant cargo-bike sales, supported by BAFA grants. The Netherlands leverages cycling culture and municipal incentives, while France’s dedicated funding and Parisian zero-emission delivery zones accelerate fleet renewals. The United Kingdom saw courier Evri earmark GBP 19 million (~USD 25 million) to treble its cargo-bike pool, signaling momentum despite Brexit-related import frictions. Dense cycling infrastructure, harmonized standards, and supportive insurance frameworks ensure that the Europe e-cargo bike market remains anchored in these mature economies, even though unit growth slows as penetration deepens.
Southern Europe represents the fastest-growing bloc at 4.97% CAGR. Italy pioneers urban logistics pilots in Milan and Turin, pairing low-traffic zones with purchase rebates that cut payback periods. Spain expands low-emission perimeters in Barcelona and Madrid, compelling last-mile operators to re-spec fleets. Portugal and Greece initiate smaller-scale subsidy schemes but face lingering hurdles in secure parking and rider training. Because these markets adopt later, OEMs with mid-drive, all-weather builds stand to gain share as operators confront hillier topographies and hotter climates. Northern Europe exhibits steady albeit weather-tempered uptake. Denmark’s embrace of cycling culture offsets rain and wind constraints, keeping Copenhagen courier fleets near significant electrification. Sweden promotes municipal cargo-bike leasing for park services, while Norway’s electric-vehicle tax exemptions extend to cargo bikes in select cities, reducing VAT payable at point of sale. Finland joins via Helsinki pilots that integrate cargo cycles into multimodal logistics hubs. Eastern Europe, although the smallest contributor, offers catch-up potential as EU cohesion funds underwrite cycling infrastructure in Poland, Czech Republic, and Hungary. Switzerland sits outside EU harmonization yet sustains premium demand, given high purchasing power and willingness to invest in bespoke cargo boxes suitable for alpine conditions.
Competitive Landscape
The Europe e-cargo bike market is moderately concentrated. Pon Holdings’ Urban Arrow, Riese & Müller, and CUBE profit from established dealer and service networks, capturing fleet tenders in Germany and Benelux. Giant Manufacturing and Merida leverage Taiwanese scale to launch cost-competitive models, while Rad Power Bikes exploits direct-to-consumer logistics, cutting lead times to two weeks in metro France.
Strategic maneuvering centers on vertical integration: Bosch supplies motors, batteries, and IoT modules to partnered OEMs, deepening ecosystem lock-in. Component standardization remains elusive, prompting the European Cargo Bike Manufacturers Alliance to propose open CAN bus protocols that reduce lead times for multi-vendor fleet builds. Meanwhile, white-label assemblers in Poland and Portugal supply niche brands targeting municipal tenders, broadening low-volume diversity without threatening incumbents’ scale.
Partnerships between OEMs and logistics platforms multiply. Riese & Müller inked a memorandum with DHL Parcel for Load4 mid-drive bikes by 2026, bundled with predictive maintenance via the brand’s RX Connect telematics. Urban Arrow co-developed refrigerated boxes with CoolRail to serve last-mile grocery and pharmacy orders. Insurance providers like Allianz Germany pilot per-minute premiums that integrate brake-sensor data, rewarding safe fleet operators with rebates. This ecosystem interplay suggests service contracting, rather than hardware margins alone, will define profitability trajectories.
Europe E-Cargo Bike Industry Leaders
Accell Group
Pon Holdings B.V. (incl. Urban Arrow)
Riese & Müller GmbH
Rad Power Bikes Inc.
Giant Manufacturing Co. Ltd.
- *Disclaimer: Major Players sorted in no particular order

Recent Industry Developments
- June 2025: Cycle launched the 20FIFTY LTX, raising payload capacity to 120 kg and optimizing hardware for steeper gradients.
- March 2025: Gazelle introduced the Cabby C380 longtail, securing an iF Design Award prior to commercial release.
- March 2025: Tern unveiled an upgraded GSD cargo e-bike meeting DIN 79040 standards, powered by a Bosch Cargo Line mid-drive with 85 Nm torque.
- December 2024: Car.los debuted the V1 folding electric cargo bike featuring a collapsible basket and stepless transmission.


Europe E-Cargo Bike Market Report Scope
Pedal Assisted, Speed Pedelec, Throttle Assisted are covered as segments by Propulsion Type. Lead Acid Battery, Lithium-ion Battery, Others are covered as segments by Battery Type. Austria, Belgium, France, Germany, Italy, Luxembourg, Netherlands, Poland, Spain, Switzerland, UK, Rest-of-Europe are covered as segments by Country.By Propulsion Type
| Pedal Assisted |
| Throttle Assisted |
By Battery Type
| Lead Acid Battery |
| Lithium-ion Battery |
| Others |
By Motor Placement
| Hub (Front/Rear) |
| Mid-drive |
By Drive Systems
| Chain Drive |
| Belt Drive |
By Motor Power
| Below 250 W |
| 251-350 W |
| 351-500 W |
| 501-600 W |
| Above 600 W |
By Price Band
| Up to USD 1,000 |
| USD 1,000-1,499 |
| USD 1,500-2,499 |
| USD 2,500-3,499 |
| USD 3,500-5,999 |
| Above USD 6,000 |
By Sales Channel
| Online |
| Offline |
By End Use
| Commercial Delivery | Retail and Goods Delivery |
| Food and Beverage Delivery | |
| Service Providers | |
| Others |
By Geography
| Western Europe | Germany |
| France | |
| United Kingdom | |
| Netherlands | |
| Belgium | |
| Luxembourg | |
| Southern Europe | Italy |
| Spain | |
| Portugal | |
| Greece | |
| Northern Europe | Denmark |
| Sweden | |
| Norway | |
| Finland | |
| Eastern Europe | Poland |
| Czech Republic | |
| Hungary | |
| Slovakia | |
| Switzerland | |
| Rest of Europe |
| By Propulsion Type | Pedal Assisted | |
| Throttle Assisted | ||
| By Battery Type | Lead Acid Battery | |
| Lithium-ion Battery | ||
| Others | ||
| By Motor Placement | Hub (Front/Rear) | |
| Mid-drive | ||
| By Drive Systems | Chain Drive | |
| Belt Drive | ||
| By Motor Power | Below 250 W | |
| 251-350 W | ||
| 351-500 W | ||
| 501-600 W | ||
| Above 600 W | ||
| By Price Band | Up to USD 1,000 | |
| USD 1,000-1,499 | ||
| USD 1,500-2,499 | ||
| USD 2,500-3,499 | ||
| USD 3,500-5,999 | ||
| Above USD 6,000 | ||
| By Sales Channel | Online | |
| Offline | ||
| By End Use | Commercial Delivery | Retail and Goods Delivery |
| Food and Beverage Delivery | ||
| Service Providers | ||
| Others | ||
| By Geography | Western Europe | Germany |
| France | ||
| United Kingdom | ||
| Netherlands | ||
| Belgium | ||
| Luxembourg | ||
| Southern Europe | Italy | |
| Spain | ||
| Portugal | ||
| Greece | ||
| Northern Europe | Denmark | |
| Sweden | ||
| Norway | ||
| Finland | ||
| Eastern Europe | Poland | |
| Czech Republic | ||
| Hungary | ||
| Slovakia | ||
| Switzerland | ||
| Rest of Europe | ||


Market Definition
- By Application Type - Cargo e-bikes are considered under the scope of this segment. The e-cargo or utility e-bikes are designed to carry various types of cargo and packages for shorter distances such as within urban areas
- By Battery Type - This segment includes lithium-ion batteries, lead-acid batteries, and other battery types. The other battery type category includes nickel-metal hydroxide (NiMH), silicon, and lithium-polymer batteries.
- By Propulsion Type - E-bikes considered under this segment include pedal-assisted e-bikes, throttle-assisted e-bikes, and speed pedelec. While the speed limit of pedal and throttle-assisted e-bikes is usually 25 km/h, the speed limit of speed pedelec is generally 45 km/h (28 mph).
| Keyword | Definition |
|---|---|
| Pedal Assisted | Pedal-assist or pedelec category refers to the electric bikes that provide limited power assistance through torque-assist system and do not have throttle for varying the speed. The power from the motor gets activated upon pedaling in these bikes and reduces human efforts. |
| Throttle Assisted | Throttle-based e-bikes are equipped with the throttle assistance grip, installed on the handlebar, similarly to motorbikes. The speed can be controlled by twisting the throttle directly without the need to pedal. The throttle response directly provides power to the motor installed in the bicycles and speeds up the vehicle without paddling. |
| Speed Pedelec | Speed pedelec is e-bikes similar to pedal-assist e-bikes as they do not have throttle functionality. However, these e-bikes are integrated with an electric motor which delivers power of approximately 500 W and more. The speed limit of such e-bikes is generally 45 km/h (28 mph) in most of the countries. |
| City/Urban | The city or urban e-bikes are designed with daily commuting standards and functions to be operated within the city and urban areas. The bicycles include various features and specifications such as comfortable seats, sit upright riding posture, tires for easy grip and comfortable ride, etc. |
| Trekking | Trekking and mountain bikes are special types of e-bikes that are designed for special purposes considering the robust and rough usage of the vehicles. These bicycles include a strong frame, and wide tires for better and advanced grip and are also equipped with various gear mechanisms which can be used while riding in different terrains, rough grounded, and tough mountainous roads. |
| Cargo/Utility | The e-cargo or utility e-bikes are designed to carry various types of cargo and packages for shorter distances such as within urban areas. These bikes are usually owned by local businesses and delivery partners to deliver packages and parcels at very low operational costs. |
| Lithium-ion Battery | A Li-ion battery is a rechargeable battery, which uses lithium and carbon as its constituent materials. The Li-Ion batteries have a higher density and lesser weight than sealed lead acid batteries and provide the rider with more range per charge than other types of batteries. |
| Lead Acid Battery | A lead acid battery refers to sealed lead acid battery having a very low energy-to-weight and energy-to-volume ratio. The battery can produce high surge currents, owing to its relatively high power-to-weight ratio as compared to other rechargeable batteries. |
| Other Batteries | This includes electric bikes using nickel–metal hydroxide (NiMH), silicon, and lithium-polymer batteries. |
| Business-to-Business (B2B) | The sales of e-bikes to business customers such as urban fleet and logistics company, rental/sharing operators, last-mile fleet operators, and corporate fleet operators are considered under this category. |
| Business-to-Customers (B2C) | The sales of electric scooters and motorcycles to direct consumers is considered under this category. The consumers acquire these vehicles either directly from manufacturers or from other distributers and dealers through online and offline channel. |
| Unorganized Local OEMs | These players are small local manufacturers and assemblers of e-bikes. Most of these manufacturers import the components from China and Taiwan and assemble them locally. They offer the product at low cost in this price sensitive market which give them advantage over organized manufacturers. |
| Battery-as-a-Service | A business model in which the battery of an EV can be rented from a service provider or swapped with another battery when it runs out of charge |
| Dockless e-Bikes | Electric bikes that have self-locking mechanisms and a GPS tracking facility with an average top speed of around 15mph. These are mainly used by bike-sharing companies such as Bird, Lime, and Spin. |
| Electric Vehicle | A vehicle which uses one or more electric motors for propulsion. Includes cars, scooters, buses, trucks, motorcycles, and boats. This term includes all-electric vehicles and hybrid electric vehicles |
| Plug-in EV | An electric vehicle that can be externally charged and generally includes all-electric vehicles as well as plug-in hybrids. In this report we use the term for all-electric vehicles to differentiate them from plug-in hybrid electric vehicles. |
| Lithium-Sulphur Battery | A rechargeable battery that replaces the liquid or polymer electrolyte found in current lithium-ion batteries with sulfur. They have more capacity than Li-ion batteries. |
| Micromobility | Micromobility is one of the many modes of transport involving very-light-duty vehicles to travel short distances. These means of transportation include bikes, e-scooters, e-bikes, mopeds, and scooters. Such vehicles are used on a sharing basis for covering short distances, usually five miles or less. |
| Low Speed Electric Vehicls (LSEVs) | They are low speed (usually less than 25 kmph) light vehicles that do not have an internal combustion engine, and solely use electric energy for propulsion. |


Research Methodology
Mordor Intelligence follows a four-step methodology in all its reports.
- Step-1: Identify Key Variables: To build a robust forecasting methodology, the variables and factors identified in Step-1 are tested against available historical market numbers. Through an iterative process, the variables required for market forecast are set and the model is built based on these variables.
- Step-2: Build a Market Model: Market-size estimations for the historical and forecast years have been provided in revenue and volume terms. Market revenue is calculated by multiplying the volume demand with volume-weighted average battery pack price (per kWh). Battery pack price estimation and forecast takes into account various factors affecting ASP, such as inflation rates, market demand shifts, production costs, technological developments, and consumer preferences, providing estimations for both historical data and future trends.
- Step-3: Validate and Finalize: In this important step, all market numbers, variables, and analyst calls are validated through an extensive network of primary research experts from the market studied. The respondents are selected across levels and functions to generate a holistic picture of the market studied.
- Step-4: Research Outputs: Syndicated Reports, Custom Consulting Assignments, Databases & Subscription Platforms


