Market Overview
| Study Period | 2018 - 2031 |
|---|---|
| Forecast Data Period | 2026 - 2031 |
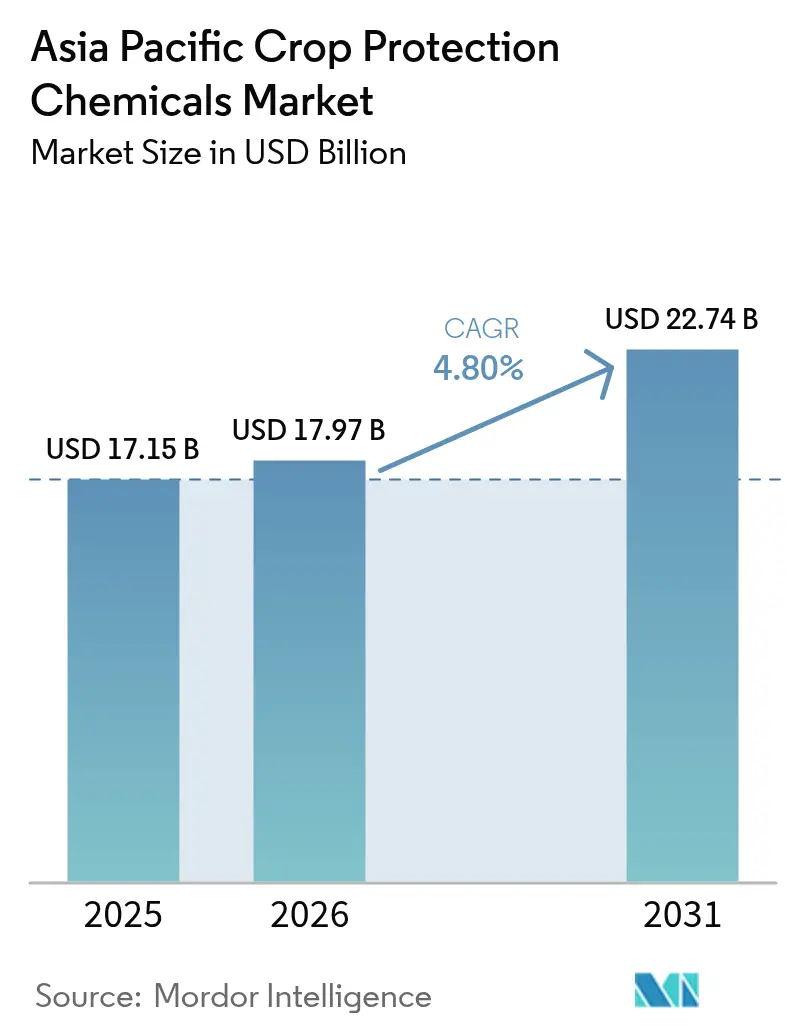
| Base Year Market Size (2025) | USD 17.15 Billion |
| Market Size (2026) | USD 17.97 Billion |
| Market Size (2031) | USD 22.74 Billion |
| Growth Rate (2026 - 2031) | 4.80% CAGR |
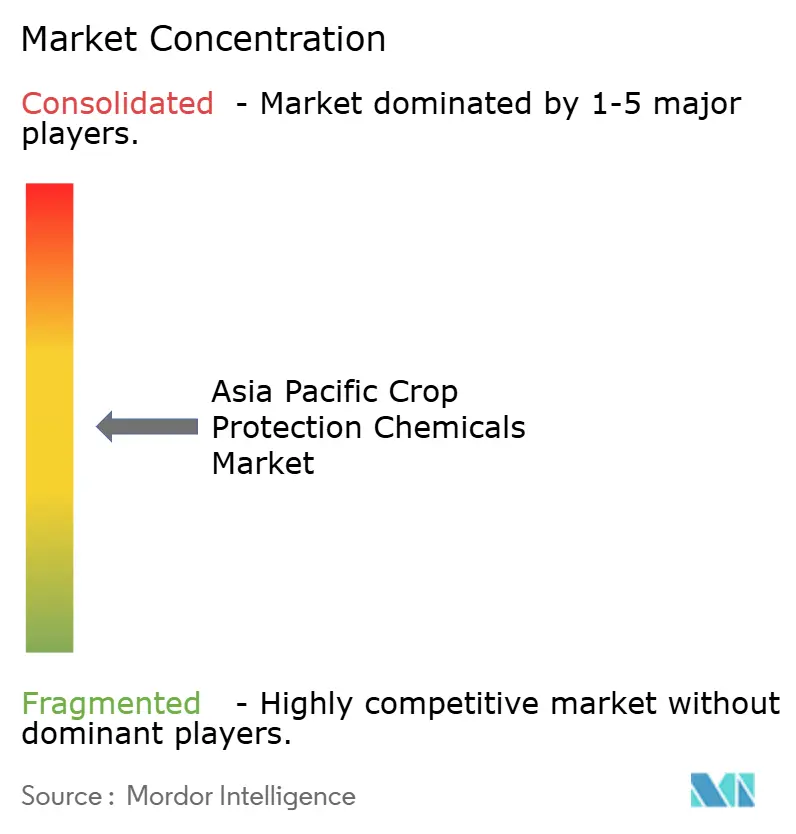
| Market Concentration | Medium |
Major Players *Disclaimer: Major Players sorted in no particular order Image © Mordor Intelligence. Reuse requires attribution under CC BY 4.0. | |
Asia Pacific Crop Protection Chemicals Market Analysis by Mordor Intelligence
Asia-Pacific crop protection chemicals market size in 2026 is estimated at USD 17.97 billion, growing from 2025 value of USD 17.15 billion with 2031 projections showing USD 22.74 billion, growing at 4.8% CAGR over 2026-2031. Short-term growth is driven by farmers seeking to stabilize yields amid increasing pest pressures resulting from climate change. Medium-term growth is supported by the rising adoption of precision farming technologies, which optimize the use of chemical inputs. Consolidation among active ingredient suppliers is streamlining distribution channels, enhancing access in secondary markets. Government subsidies for digital agriculture programs across the region are increasing demand for high-efficacy formulations that are compatible with GPS-guided application systems. The increasing focus on sustainable farming practices is also encouraging the development of environmentally friendly crop protection solutions. Advancements in biotechnology are enabling the creation of more targeted and effective pest control products. Manufacturers offering patented nano-formulations integrated with AI-enabled advisory platforms are well-positioned to benefit from these structural changes and achieve revenue growth.
Key Report Takeaways
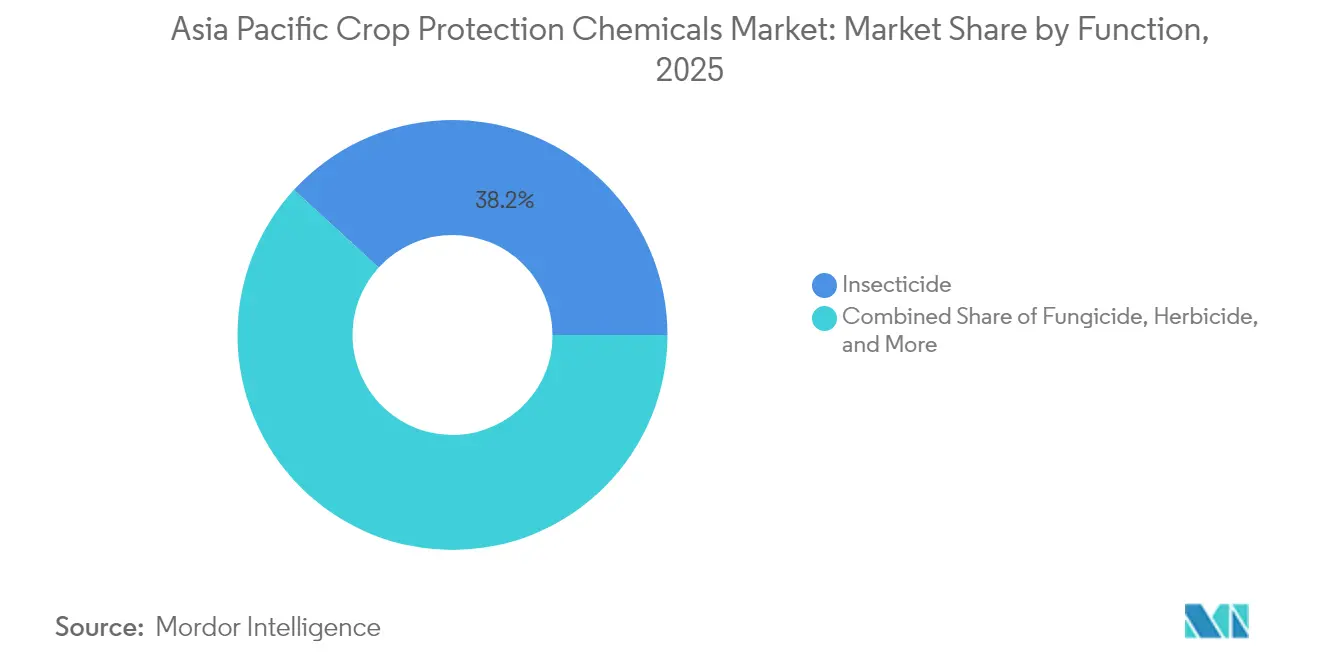
- By function, insecticides held 38.20% of the Asia Pacific crop protection chemicals market share in 2025; herbicides are projected to advance at a 5.95% CAGR through 2031.
- By application mode, foliar treatments accounted for 47.10% of the Asia Pacific crop protection chemicals market size in 2025, while soil treatment applications are anticipated to expand at a 5.48% CAGR through 2031.
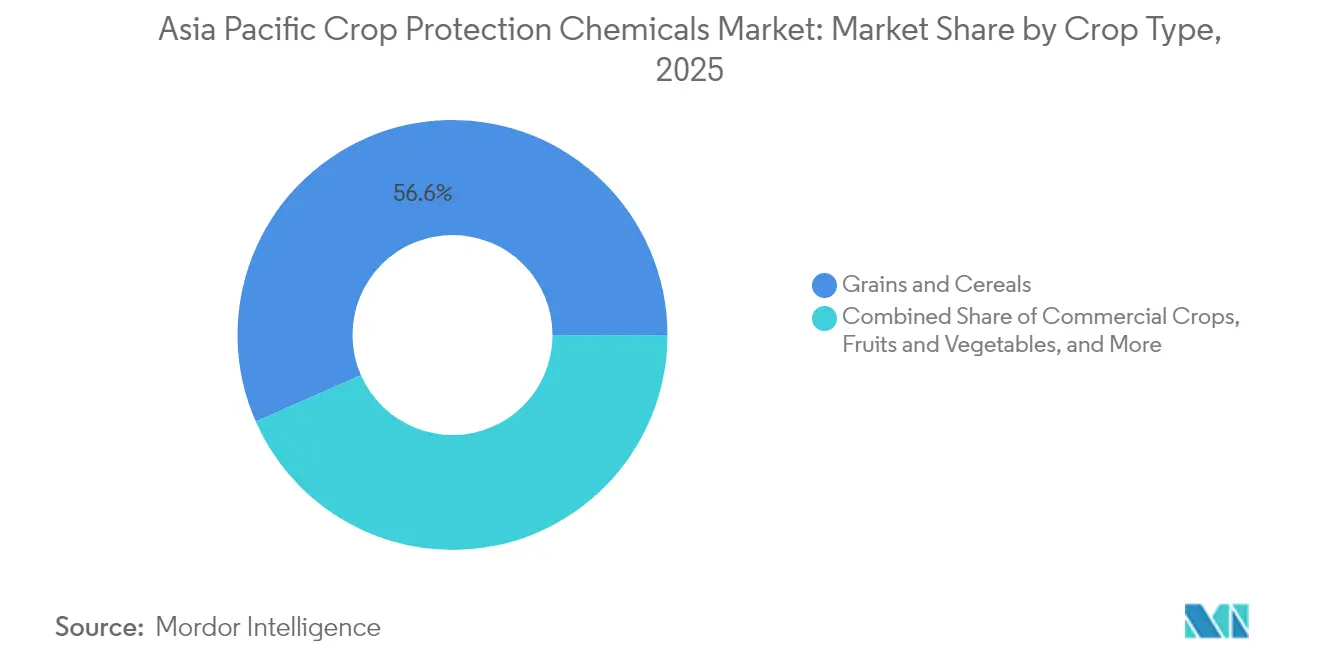
- By crop type, grains and cereals accounted for 56.60% of the market size in 2025; fruits and vegetables are forecast to grow at a 4.92% CAGR during 2026-2031.
- By country, China commanded a 31.00% share in 2025, whereas Thailand records the fastest trajectory at a 6.72% CAGR toward 2031.
- The Asia-Pacific crop protection chemicals market demonstrates a moderate competitive intensity, with the top five players Syngenta Group, BASF SE, Bayer AG, UPL Limited, and FMC Corporation collectively holding more than 50% of the market share.
Note: Market size and forecast figures in this report are generated using Mordor Intelligence’s proprietary estimation framework, updated with the latest available data and insights as of 2026.
Asia Pacific Crop Protection Chemicals Market Trends and Insights
Drivers Impact Analysis*
| Driver | (~) % Impact on CAGR Forecast | Geographic Relevance | Impact Timeline |
|---|---|---|---|
| Climate-driven surge in pests and disease pressure | +1.1% | China, India, and tropical Southeast Asia | Medium term (2-4 years) |
| Surge of patented nano-formulations with higher field efficacy | +0.8% | China, India, and Australia | Long term (≥ 4 years) |
| Regenerative and no-till farming boosting seed-treatment chemicals | +0.6% | Australia, Japan, and China | Medium term (2-4 years) |
| Yield boost imperatives for low-margin row crops | +0.9% | China, India, Thailand, and Vietnam | Short term (≤ 2 years) |
| AI-enabled disease forecasting tools accelerating crop protection chemicals uptake | +0.5% | Japan, Australia, and urban China | Long term (≥ 4 years) |
| Carbon credit programs rewarding crop-loss avoidance | +0.3% | Australia, Japan, and pilot Southeast Asia | Long term (≥ 4 years) |
| Source: Mordor Intelligence | |||


Climate-Driven Surge in Pests and Disease Pressure
Rising temperatures and irregular rainfall patterns are leading to multiple insect generations within a single season, thereby increasing the need for prophylactic spraying across rice, wheat, and horticulture fields [1]Source: Australian Government Department of Agriculture, “Climate Impact on Agricultural Pest Management,” agriculture.gov.au. Farmers in humid coastal regions have reported a 15% increase in application volumes compared to 2023, driving demand for broad-spectrum insecticides and fungicides. National plant protection agencies have enhanced border surveillance to limit the migration of pests across borders, indirectly boosting sales of compliance-ready formulations. The growing awareness among farmers about the economic benefits of preventive measures further supports this trend. Advancements in formulation technologies are enabling the development of more effective and sustainable crop protection solutions. Consequently, the Asia-Pacific crop protection chemicals market is experiencing growth as farmers transition from reactive to preventive programs, which generally involve higher-value mixtures per hectare.
Surge of Patented Nano-Formulations with Higher Field Efficacy
Corporate filings indicate a 45% increase in nano-formulation patent activity in 2024, driven by suppliers aiming to achieve smaller dose rates without compromising yield. Nano-encapsulation enhances cuticle penetration and reduces photodegradation, allowing for controlled release under field conditions. This technology also improves the efficiency of active ingredients, reducing overall chemical usage and environmental impact. Chinese procurement tenders now feature nano-formulated herbicides for government demonstration farms, reflecting institutional acceptance that is likely to spread rapidly to provincial markets. These products align with residue reduction targets, facilitating smoother regulatory approval and enabling manufacturers to secure premium pricing in the Asia Pacific crop protection chemicals market.
Regenerative and No-Till Farming Boosting Seed-Treatment Chemicals
No-till acreage is projected to expand by 25% region-wide in 2024, with Australia leading the adoption due to the benefits of soil moisture conservation [2]Source: International Association of Plant Protection Sciences, “Sustainable Agriculture Practices Report 2024,” iapps.org. This practice has gained traction as it helps improve soil health and reduces erosion, making it a sustainable choice for growers. Seed treatments align with this system by delivering pesticides directly to young plants, reducing runoff and protecting beneficial microfauna. Chemical suppliers are now combining micronutrients with systemic insecticides in single coating applications, generating cross-category revenue opportunities. As carbon accounting frameworks incentivize reduced tractor usage, growers increasingly perceive treated seed as a cost-effective solution for achieving both environmental and financial benefits. The integration of treated seeds into farming practices also supports long-term productivity by enhancing crop resilience and reducing input costs.
AI-Enabled Disease Forecasting Tools Accelerating Crop Protection Chemicals Uptake
Japan's national digital agriculture platform provides geo-referenced alerts that display spore flight risks at the village level[3]Source: Ministry of Agriculture, Forestry and Fisheries Japan, “Digital Agriculture Initiative 2024,” maff.go.jp. These early warnings enable targeted spraying instead of widespread applications. Overall, chemical demand continues to increase as improved application timing enhances the effectiveness of these products. Vendors co-license software alongside their active ingredient portfolios, ensuring recurring revenue streams while distinguishing themselves from generic competitors. Data-linked stewardship supports compliance with ISO 14001 audit standards, offering an added environmental compliance advantage. The platform also facilitates better resource allocation by reducing unnecessary chemical usage. This approach contributes to sustainable farming practices while maintaining crop protection efficiency.
Restraints Impact Analysis*
| Restraint | (~) % Impact on CAGR Forecast | Geographic Relevance | Impact Timeline |
|---|---|---|---|
| Increasing multi-state residue MRL failures in export tests | -0.7% | Thailand, Vietnam, and Philippines | Short term (≤ 2 years) |
| Rising ban on crop protection chemicals | -0.9% | Australia, Japan, and EU-aligned importers | Medium term (2-4 years) |
| Volatility in raw-material prices | -0.5% | China, and India manufacturing hubs | Short term (≤ 2 years) |
| Rise of regenerative agriculture contracts limiting chemical inputs | -0.4% | Australia, Japan, and premium export markets | Long term (≥ 4 years) |
| Source: Mordor Intelligence | |||
Increasing Multi-State Residue MRL Failures in Export Tests
The ASEAN Food Safety Network reported a 35% increase in violations during 2024 audits, particularly in shipments of fresh mangoes and longans destined for the European market [4]Source: ASEAN Food Safety Network, “Agricultural Export Compliance Report 2024,” asean.org. Exporters have responded by implementing extended pre-harvest intervals and increasing investments in additional laboratory analyses. These measures have resulted in shipment delays and higher compliance costs. Concerns over rejection have led growers to reduce spray doses, sometimes to levels below those required for effective pest and disease control. This under-application poses risks to crop yields and negatively impacts volume growth in the Asia Pacific crop protection chemicals market. The increased scrutiny has prompted exporters to explore alternative markets with less stringent regulations. This shift necessitates significant adjustments in supply chain logistics and marketing strategies, further complicating operational challenges.
Rising Ban on Crop Protection Chemicals
In 2024, Australia banned 12 active ingredients, with similar actions observed in Japan and New Zealand. These phaseouts necessitate a rapid transition to newer molecules, which involve higher initial costs and require farmers to undergo additional training. The registration costs for alternative products have increased due to stricter regulatory requirements for comprehensive environmental documentation. Mid-sized domestic formulators face challenges in managing these expenses, leading to an uneven competitive landscape. The shift to newer molecules often disrupts supply chains, creating delays and logistical challenges. Farmers and formulators alike must adapt quickly to these changes to remain compliant and competitive in the evolving regulatory environment.
*Our forecasts treat driver/restraint impacts as directional, not additive. The impact forecasts reflect baseline growth, mix effects, and variable interactions.
Segment Analysis
By Function: Insecticides Anchor Revenue While Herbicides Pace Growth
Insecticides accounted for 38.20% of the Asia-Pacific crop protection chemicals market share in 2025, driven by persistent pest outbreaks caused by warmer climates and extended multivoltine life cycles. Rice planthopper infestations in the Mekong Delta and stem borer pressures in northern India led to the implementation of aggressive prophylactic programs, resulting in the increased adoption of premium insecticides. Manufacturers offering diverse modes of action benefit from repeat sales as growers rotate chemistries to manage resistance. The segment also benefits from nano-encapsulated pyrethroids, which enhance leaf adhesion and prolong residual efficacy, thereby improving the cost-effectiveness of each application.
Herbicides are projected to achieve the fastest CAGR of 5.95% through 2031, driven by rural labor shortages and the expansion of no-till farming, which relies on chemical weed control before planting. While glyphosate remains a key product, the emergence of herbicide-tolerant weeds is prompting farmers to adopt tank mixes containing inhibitors of protoporphyrinogen oxidase (PPO) and acetolactate synthase (ALS). Packaged adjuvant systems simplify mixing processes at the field level, facilitating adoption among smallholder farmers. Consequently, the Asia-Pacific crop protection chemicals market linked to herbicide demand is projected to grow steadily as farmers invest in upgraded sprayer infrastructure and prioritize time efficiency during narrow planting periods.


By Application Mode: Foliar Remains Dominant as Soil Treatment Accelerates
Foliar spraying is projected to account for 47.10% of the Asia-Pacific crop protection chemicals market size in 2025, driven by its versatility and widespread familiarity among farmers. The use of aerial drones, particularly in Japan and China, enhances foliar coverage on steep or fragmented land parcels. The visible knockdown effects of foliar spraying boost user confidence, often leading to additional applications within the same growth cycle, provided weather conditions are favorable. Sensor-guided booms help minimize overlap, reducing waste and aligning with sustainability practices. This method is particularly effective for crops with dense canopies, ensuring even distribution of chemicals. Its adaptability to various crop types and terrains further strengthens its market position.
Soil treatment currently represents mid-teen revenue levels but is projected to grow at a 5.48% CAGR, supported by the increasing adoption of regenerative farming practices that prioritize root-zone protection and microbiome balance. Systemic insecticides applied as granules during planting reduce the need for above-ground spray applications later in the season. In high-value horticulture, pre-plant fumigation effectively controls nematodes and soil-borne pathogens, thereby extending the productive lifespan of fields. Vendors focusing on controlled-release pellets are well-positioned to gain market share as growers shift toward chemistries with longer residual effects. The growing demand for sustainable farming solutions and innovations in soil treatment technologies are key driver of this segment's growth. Enhanced soil health not only improves crop yields but also reduces dependency on repeated chemical applications.
By Crop Type: Grains and Cereals Dominate, Fruits and Vegetables Sprint
Grains and cereals, primarily rice and wheat, accounted for 56.60% of the Asia-Pacific crop protection chemicals market share in 2025. Government food security initiatives and minimum support price mechanisms support this dominance. Extension agents frequently promote integrated pest management strategies, combining prophylactic seed treatments with targeted foliar applications, driving demand for multiple products across large cultivated areas. Procurement programs ensure credit availability for crop protection expenditures, even during periods of declining commodity prices, thereby maintaining baseline consumption levels.
The fruits and vegetables segment is projected to grow at a CAGR of 4.92%, the fastest within the market, as producers aim to capitalize on export premiums requiring visually flawless produce. High humidity in tropical regions fosters fungal outbreaks, necessitating frequent spray applications. The adoption of predictive disease models enables orchard managers to optimize application timing, reducing residues while meeting the quality standards demanded by Japanese and European markets. Consequently, the Asia-Pacific crop protection chemicals market is witnessing increased per-acre spending in this segment, which offsets stagnating volumes in the mature cereal acreage category.
Geography Analysis
China maintains its leadership position with a 31.00% share of the Asia Pacific crop protection chemicals market, driven by its extensive arable land, localized manufacturing capabilities, and government subsidies for precision spraying equipment. Domestic companies have enhanced the purity of active ingredients, meeting updated residue thresholds without relying on imports. Demonstration farms along the Yangtze River basin highlight nano-formulated herbicides that align with the sustainability goals outlined in the five-year plan, encouraging provincial buyers to adopt premium products.
Thailand is projected to be the fastest-growing country with a 6.72% CAGR through 2031. Export-focused fruit industries are investing significantly in residue-compliant fungicides and bio-adhesive surfactants designed to endure monsoon conditions. Regional free trade agreements simplify the registration process, enabling multinational companies to introduce products with consistent labeling across Thailand, Vietnam, and the Philippines with minimal modifications, thereby reducing time to market.
Australia and Japan represent mature markets, yet they remain key centers for innovation. In Australia, carbon credit incentives promote precision application technologies, boosting sales of variable-rate controllers paired with low-dose formulations. In Japan, advancements in digital agronomy platforms integrate pest forecasting into farm management systems, driving demand for compatible crop protection chemicals. Both countries play a pivotal role in shaping regulatory standards, which often influence compliance requirements across less developed markets in the Asia Pacific region.
Competitive Landscape
The competitive intensity in the Asia-Pacific crop protection chemicals market is moderate, with the five major players, Syngenta Group, BASF SE, Bayer AG, UPL Limited, and FMC Corporation collectively holding more than 50% of the revenue share in 2024. Syngenta Group benefits from a broad product portfolio and extensive channel penetration. BASF SE and Bayer AG maintain their market positions through consistent investment in research and development, which supports a strong product pipeline. The expiration of patents on several major fungicides has prompted the development of aggressive lifecycle management strategies, including prepackaged mixtures that help preserve existing revenue streams while offering added convenience to growers.
Regional companies in India and China supply cost-competitive generic products but are increasingly investing in compliance upgrades to meet international standards. UPL Limited has allocated USD 50 million in 2024 to establish sustainable formulation centers that focus on producing lower-volatility delivery systems. This initiative aims to differentiate UPL from competitors focused solely on pricing and to secure a position in premium export supply chains.
Digital agriculture companies are becoming acquisition targets for chemical manufacturers seeking to integrate advisory services with the sale of active ingredients. Bayer’s AI forecasting tool, approved by Japan’s regulatory authorities in 2024, exemplifies the shift toward software-as-a-service models bundled with chemical subscriptions. As farmers increasingly prefer holistic solutions, the Asia-Pacific crop protection chemicals market is gravitating toward companies that combine chemistry, data, and application hardware into a unified value proposition.
Asia Pacific Crop Protection Chemicals Industry Leaders
Syngenta Group
BASF SE
Bayer AG
UPL Limited
FMC Corporation
- *Disclaimer: Major Players sorted in no particular order

Recent Industry Developments
- August 2025: UPL Limited has introduced Brucia, a post-emergent herbicide specifically developed for maize crops in India. Brucia offers a reliable, safe, and efficient solution for Indian maize farmers to tackle persistent and resistant weed challenges. Brucia (Technical: Tolpyralate 40% (W/V) SC) provides rapid control over a variety of broadleaf and grassy weeds when applied at a low dose of 50 mL per acre during the 2- to 4-leaf weed stage.
- June 2025: FMC Corporation has received regulatory approval in South Korea for its breakthrough herbicide technology, featuring the Dodhylex active ingredient, which is specifically targeted at rice growers. This approval marks a significant milestone in FMC's commercialization process, enabling the introduction of formulated products. It offers South Korean rice growers access to the first new mode-of-action herbicide developed in over 30 years.
- August 2024: Syngenta India has launched two crop protection products, Miravis Duo and Reflect Top, designed to enhance crop protection and ensure high-quality yields for farmers across India. Miravis Duo, containing the active ingredients Difenoconazole (125 g/L) and Pydiflumetofen (75 g/L), utilizes ADEPIDYN technology and is approved for use in crops such as tomatoes, chilies, groundnuts, and grapes. Reflect Top, with active ingredients Isopyrazam (11.5% w/w) and Difenoconazole (11.5% w/w SC), incorporates Double Binding Technology and is specifically designed for rice, a key staple crop in India.


Asia Pacific Crop Protection Chemicals Market Report Scope
Fungicide, Herbicide, Insecticide, Molluscicide, Nematicide are covered as segments by Function. Chemigation, Foliar, Fumigation, Seed Treatment, Soil Treatment are covered as segments by Application Mode. Commercial Crops, Fruits & Vegetables, Grains & Cereals, Pulses & Oilseeds, Turf & Ornamental are covered as segments by Crop Type. Australia, China, India, Indonesia, Japan, Myanmar, Pakistan, Philippines, Thailand, Vietnam are covered as segments by Country.By Function
| Fungicide |
| Herbicide |
| Insecticide |
| Molluscicide |
| Nematicide |
By Application Mode
| Chemigation |
| Foliar |
| Fumigation |
| Seed Treatment |
| Soil Treatment |
By Crop Type
| Commercial Crops |
| Fruits and Vegetables |
| Grains and Cereals |
| Pulses and Oilseeds |
| Turf and Ornamental |
By Country
| Australia |
| China |
| India |
| Indonesia |
| Japan |
| Myanmar |
| Pakistan |
| Philippines |
| Thailand |
| Vietnam |
| Rest of Asia-Pacific |
| By Function | Fungicide |
| Herbicide | |
| Insecticide | |
| Molluscicide | |
| Nematicide | |
| By Application Mode | Chemigation |
| Foliar | |
| Fumigation | |
| Seed Treatment | |
| Soil Treatment | |
| By Crop Type | Commercial Crops |
| Fruits and Vegetables | |
| Grains and Cereals | |
| Pulses and Oilseeds | |
| Turf and Ornamental | |
| By Country | Australia |
| China | |
| India | |
| Indonesia | |
| Japan | |
| Myanmar | |
| Pakistan | |
| Philippines | |
| Thailand | |
| Vietnam | |
| Rest of Asia-Pacific |


Market Definition
- Function - Crop Protection Chemicals are apllied to control or prevent pests, including insects, fungi, weeds, nematodes, and mollusks, from damaging the crop and to protect the crop yield.
- Application Mode - Foliar, Seed Treatment, Soil Treatment, Chemigation, and Fumigation are the different type of application modes through which crop protection chemicals are applied to the crops.
- Crop Type - This represents the consumption of crop protection chemicals by Cereals, Pulses, Oilseeds, Fruits, Vegetables, Turf, and Ornamental crops.
| Keyword | Definition |
|---|---|
| IWM | Integrated weed management (IWM) is an approach to incorporate multiple weed control techniques throughout the growing season to give producers the best opportunity to control problematic weeds. |
| Host | Hosts are the plants that form relationships with beneficial microorganisms and help them colonize. |
| Pathogen | A disease-causing organism. |
| Herbigation | Herbigation is an effective method of applying herbicides through irrigation systems. |
| Maximum residue levels (MRL) | Maximum Residue Limit (MRL) is the maximum allowed limit of pesticide residue in food or feed obtained from plants and animals. |
| IoT | The Internet of Things (IoT) is a network of interconnected devices that connect and exchange data with other IoT devices and the cloud. |
| Herbicide-tolerant varieties (HTVs) | Herbicide-tolerant varieties are plant species that have been genetically engineered to be resistant to herbicides used on crops. |
| Chemigation | Chemigation is a method of applying pesticides to crops through an irrigation system. |
| Crop Protection | Crop protection is a method of protecting crop yields from different pests, including insects, weeds, plant diseases, and others that cause damage to agricultural crops. |
| Seed Treatment | Seed treatment helps to disinfect seeds or seedlings from seed-borne or soil-borne pests. Crop protection chemicals, such as fungicides, insecticides, or nematicides, are commonly used for seed treatment. |
| Fumigation | Fumigation is the application of crop protection chemicals in gaseous form to control pests. |
| Bait | A bait is a food or other material used to lure a pest and kill it through various methods, including poisoning. |
| Contact Fungicide | Contact pesticides prevent crop contamination and combat fungal pathogens. They act on pests (fungi) only when they come in contact with the pests. |
| Systemic Fungicide | A systemic fungicide is a compound taken up by a plant and then translocated within the plant, thus protecting the plant from attack by pathogens. |
| Mass Drug Administration (MDA) | Mass drug administration is the strategy to control or eliminate many neglected tropical diseases. |
| Mollusks | Mollusks are pests that feed on crops, causing crop damage and yield loss. Mollusks include octopi, squid, snails, and slugs. |
| Pre-emergence Herbicide | Preemergence herbicides are a form of chemical weed control that prevents germinated weed seedlings from becoming established. |
| Post-emergence Herbicide | Postemergence herbicides are applied to the agricultural field to control weeds after emergence (germination) of seeds or seedlings. |
| Active Ingredients | Active ingredients are the chemicals in pesticide products that kill, control, or repel pests. |
| United States Department of Agriculture (USDA) | The Department of Agriculture provides leadership on food, agriculture, natural resources, and related issues. |
| Weed Science Society of America (WSSA) | The WSSA, a non-profit professional society, promotes research, education, and extension outreach activities related to weeds. |
| Suspension concentrate | Suspension concentrate (SC) is one of the formulations of crop protection chemicals with solid active ingredients dispersed in water. |
| Wettable powder | A wettable powder (WP) is a powder formulation that forms a suspension when mixed with water prior to spraying. |
| Emulsifiable concentrate | Emulsifiable concentrate (EC) is a concentrated liquid formulation of pesticide that needs to be diluted with water to create a spray solution. |
| Plant-parasitic nematodes | Parasitic Nematodes feed on the roots of crops, causing damage to the roots. These damages allow for easy plant infestation by soil-borne pathogens, which results in crop or yield loss. |
| Australian Weeds Strategy (AWS) | The Australian Weeds Strategy, owned by the Environment and Invasives Committee, provides national guidance on weed management. |
| Weed Science Society of Japan (WSSJ) | WSSJ aims to contribute to the prevention of weed damage and the utilization of weed value by providing the chance for research presentation and information exchange. |


Research Methodology
Mordor Intelligence follows a four-step methodology in all our reports.
- Step-1: Identify Key Variables: In order to build a robust forecasting methodology, the variables and factors identified in Step-1 are tested against available historical market numbers. Through an iterative process, the variables required for market forecast are set and the model is built on the basis of these variables.
- Step-2: Build a Market Model: Market-size estimations for the forecast years are in nominal terms. Inflation is not a part of the pricing, and the average selling price (ASP) is kept constant throughout the forecast period.
- Step-3: Validate and Finalize: In this important step, all market numbers, variables and analyst calls are validated through an extensive network of primary research experts from the market studied. The respondents are selected across levels and functions to generate a holistic picture of the market studied.
- Step-4: Research Outputs: Syndicated Reports, Custom Consulting Assignments, Databases & Subscription Platforms


