Articulated Robot Market Size and Share
Market Overview
| Study Period | 2020 - 2031 |
|---|---|
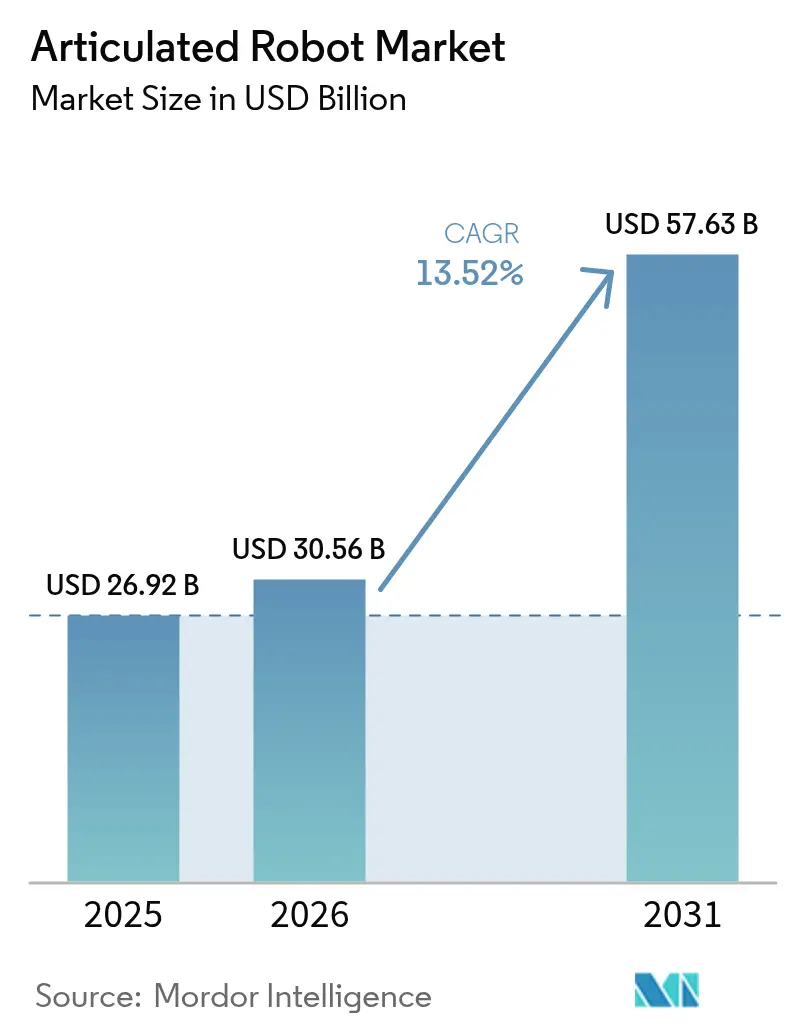
| Market Size (2026) | USD 30.56 Billion |
| Market Size (2031) | USD 57.63 Billion |
| Growth Rate (2026 - 2031) | 13.52% CAGR |
| Fastest Growing Market | South America |
| Largest Market | Asia Pacific |
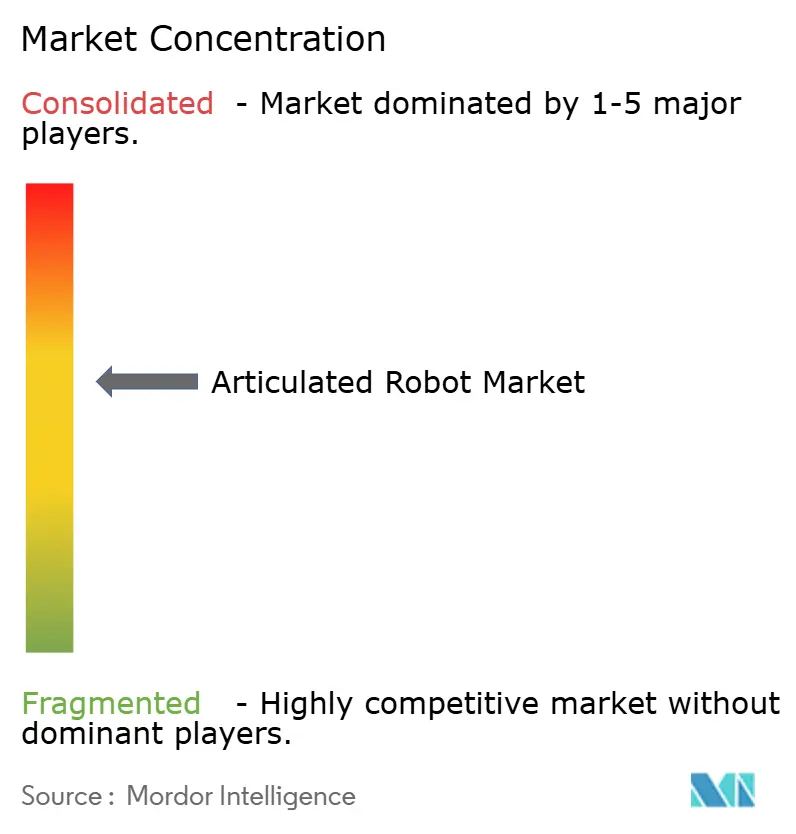
| Market Concentration | Medium |
Major Players *Disclaimer: Major Players sorted in no particular order Image © Mordor Intelligence. Reuse requires attribution under CC BY 4.0. | |
Articulated Robot Market Analysis by Mordor Intelligence
Articulated Robot Market size in 2026 is estimated at USD 30.56 billion, growing from 2025 value of USD 26.92 billion with 2031 projections showing USD 57.63 billion, growing at 13.52% CAGR over 2026-2031. Surging demand for smart manufacturing solutions, sovereign production policies, and AI-enabled collaborative systems underpin this expansion. Intensifying capital expenditure in electric-vehicle production, sustained warehouse automation roll-outs by e-commerce majors, and growing precision-oriented food applications further reinforce momentum. Meanwhile, component makers are responding to semiconductor and servo-motor bottlenecks with vertical-integration strategies, and energy-efficient robotic designs are gaining traction as users chase lower operating costs. Competitive strategies are bifurcating: incumbents such as ABB pursue structural spin-offs to sharpen focus, while start-ups leverage cloud-connected platforms to shorten deployment times.
Key Report Takeaways
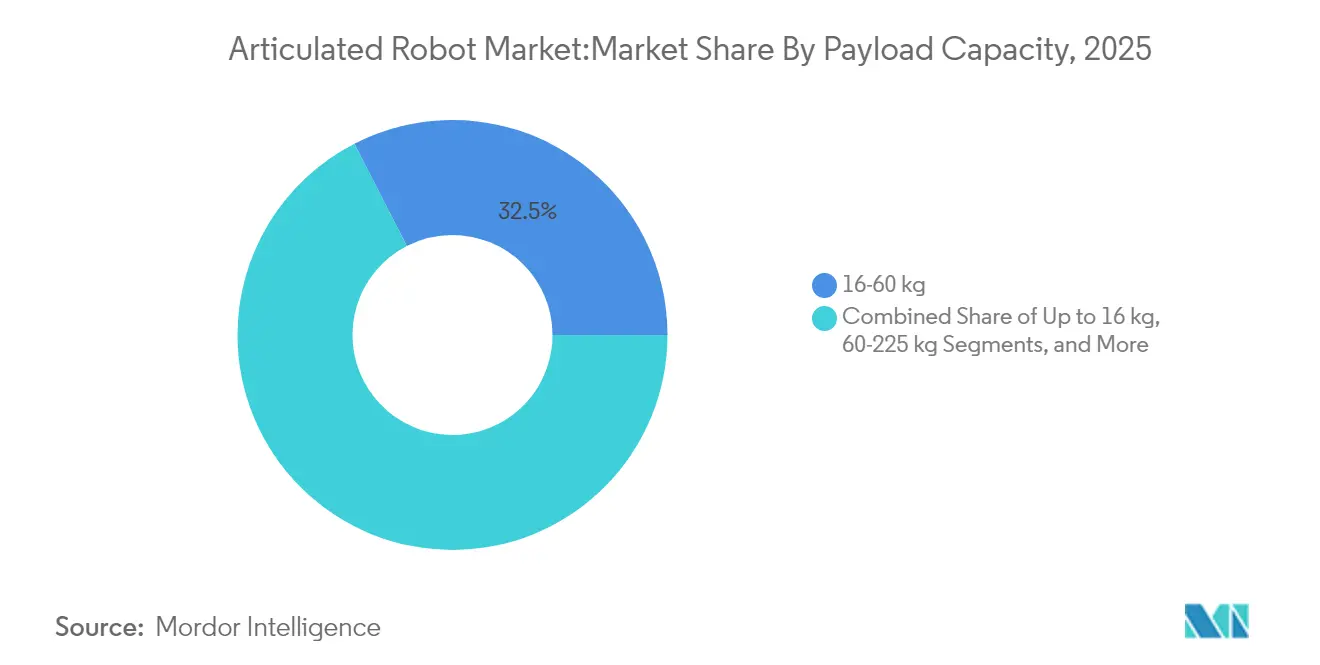
- By payload capacity, the 16–60 kg segment led with 32.54% of articulated robot market share in 2025, whereas robots up to 16 kg are projected to post the fastest 15.42% CAGR through 2031.
- By axis type, 6-axis systems controlled 51.35% revenue in 2025, yet 7-axis and above configurations are forecast to expand at a 15.98% CAGR during 2026–2031.
- By application, material handling commanded 28.96% of articulated robot market size in 2025, while packaging and palletizing should accelerate at a 15.18% CAGR to 2031.
- By end-user industry, food and beverages accounted for 24.78% share of the articulated robot market size in 2025; automotive is expected to grow the fastest at 15.71% CAGR through 2031.
- By geography, Asia-Pacific held 42.05% of 2025 revenue, whereas South America is poised to record the highest 14.86% CAGR to 2031.
Note: Market size and forecast figures in this report are generated using Mordor Intelligence’s proprietary estimation framework, updated with the latest available data and insights as of 2026.
Market Trends and Insights
Drivers Impact Analysis of Articulated Robot Market*
| Driver | (~) % Impact on CAGR Forecast | Geographic Relevance | Impact Timeline |
|---|---|---|---|
| Shift toward Industry 4.0-led automation | +2.8% | Global (APAC, Europe lead) | Medium term (2-4 years) |
| Rising labor cost and skilled-worker shortage | +3.2% | North America, EU, APAC hubs | Short term (≤ 2 years) |
| Government incentives for smart manufacturing | +1.9% | Primarily APAC | Long term (≥ 4 years) |
| Automotive e-mobility cap-ex boom | +2.1% | Global EV clusters | Medium term (2-4 years) |
| AI-enabled adaptive articulated cobots | +1.7% | North America and EU early adoption, APAC scale deployment | Long term (≥ 4 years) |
| Fulfilment-center automation by e-commerce majors | +1.5% | Global (North America, Europe lead) | Short term (≤ 2 years) |
| Source: Mordor Intelligence | |||
Shift toward Industry 4.0-led automation
Manufacturers are linking articulated robots with AI analytics and IoT sensors to create closed-loop production ecosystems that self-optimise quality, uptime, and energy consumption. Foxconn’s lights-off sites cut headcount by 150,000 yet sustained output by embedding predictive-maintenance algorithms in robotic workcells. Xiaomi’s 24/7 smartphone facility demonstrates the scalability of such dark-factory models. These deployments shift automation economics from manpower substitution to product-mix agility, enabling rapid re-tooling for customised lots and variant introductions.
Rising labor cost and skilled-worker shortage
Robot operating costs of USD 1.60–2.00 per hour now undercut human wages exceeding USD 5.50 in many regions, tilting ROI calculations decisively toward automation. General Motors and John Deere trimmed welding labor expenses by 50% and defects by 25% after adopting robotic welding cells. Warehouse operators such as GXO Logistics have turned to Apollo humanoids to bridge head-count gaps while improving safety metrics. Ageing demographics in Europe and East Asia anchor this driver for the long term.
Government incentives for smart manufacturing
Subsidies and tax abatements for Industry 4.0 upgrades in China, South Korea and India are catalysing articulated robot market adoption. Singapore’s Enterprise Development Grants reimburse up to 50% of automation project costs, while Japan’s subsidies cover system-integration expenses, smoothing the path for SMEs. Brazil’s Finame credit line supports local robotics purchases, underpinning South America’s rapid growth trajectory. These programmes typically target multi-year horizons, enhancing investment visibility for vendors and users.
Automotive e-mobility cap-ex boom
EV assemblers require highly flexible robots for battery module handling and lightweight material joining. Hyundai Motor Group’s USD 21 billion US programme includes Boston Dynamics collaboration to scale next-generation articulated systems. [1]Steve Crown, “Hyundai Motor Group commits to U.S. growth with USD 21 billion investment,” Hyundai Motor Group, hyundaimotorgroup.com ABB’s Auburn Hills facility upgrade focuses on EV-specific paint and sealing cells, signalling supplier alignment to this cap-ex wave. As global EV output rises, demand for robots with high repeatability and battery-safe cleanliness standards is set to intensify.
Restraints Impact Analysis of Articulated Robot Market*
| Restraint | (~) % Impact on CAGR Forecast | Geographic Relevance | Impact Timeline |
|---|---|---|---|
| High upfront acquisition and integration cost | -2.1% | Global, hits SMEs hardest | Short term (≤ 2 years) |
| Scarcity of system-integration talent | -1.8% | North America and EU, expanding to APAC | Medium term (2-4 years) |
| Cyber-security risk in connected robot controllers | -1.3% | Global, with heightened concern in critical infrastructure | Long term (≥ 4 years) |
| Servo-motor and semiconductor supply bottlenecks | -1.9% | Global, APAC concentration | Short term (≤ 2 years) |
| Source: Mordor Intelligence | |||
High upfront acquisition and integration cost
Total cost of an articulated robot cell can double once integration, safety equipment, and training are included, discouraging smaller enterprises. Latin American SMEs cite limited access to integrators and finance as key barriers to adoption. Robots-as-a-Service models mitigate this restraint by converting cap-ex into opex; Formic reported 200,000 contracted production hours at 99.8% uptime, highlighting investor appetite for pay-per-use automation.
Servo-motor and semiconductor supply bottlenecks
Chip-set lead times and rare-earth magnet shortages continue to disrupt robot deliveries. Despite easing constraints, analysts expect full normalization only by early 2025. Potential Chinese restrictions on titanium and heavy rare-earth exports pose downside risk, pressuring Western OEMs to diversify supply chains or pursue vertical integration.
*Our forecasts treat driver/restraint impacts as directional, not additive. The impact forecasts reflect baseline growth, mix effects, and variable interactions.
Articulated Robot Market Segment Analysis
By Payload Capacity:
Lightweight Precision Drives GrowthThe ≤ 16 kg class is projected to outpace all others at a 15.42% CAGR on the back of electronics, pharma, and collaborative deployments, whereas the 16–60 kg segment retained 32.54% of articulated robot market share in 2025. Users favour lighter platforms for speed, energy thrift, and human-adjacent safety. Freedom Fresh Australia’s macadamia line runs 0.39-second cycles with a lightweight SCARA unit, underscoring productivity gains in food packing. Energy-efficiency pressures are driving material innovations: carbon-fibre arms from Cognibotics cut consumption by 90% while maintaining rigidity.
Demand for 60–225 kg and > 225 kg robots remains stable in automotive body-shop and foundry tasks, yet growth decelerates as OEMs sweat installed assets rather than expand footprint. High-payload arms increasingly integrate shape-memory alloy grippers that slash pneumatic energy use by 90%. Over 2026-2031, the articulated robot market size for heavy-duty classes is forecast to expand at single-digit rates, supported by EV battery pack lifting and wind-turbine component handling.


By Axis Type:
Advanced Configurations Gain MomentumSix-axis models captured 51.35% of revenue in 2025, anchoring the articulated robot market as the de-facto workhorse for welding, painting and precision assembly. Cost points now span under USD 5,000 for light units to beyond USD 500,000 for clean-room variants. Modular controllers are shrinking installation footprints, a boon for SMEs with space constraints.
Seven-axis and hyper-dexterous formats are the fastest-rising niche, charting a 15.98% CAGR. Yamaha’s YA series elbows rotate around confined fixtures, enabling shorter takt times in dense production cells. Parallel-topology robots studied by MDPI promise higher stiffness-to-weight ratios for pick-and-place cycles. As automotive interiors grow more complex and consumer electronics trend toward miniaturisation, demand for extra axes to navigate tight envelopes will intensify.
By Application:
Packaging Automation AcceleratesMaterial handling remained the largest application in 2025, accounting for 28.96% of the articulated robot market size amid rising warehouse mechanisation. Yet, packaging and palletising cells are tipped to surge at a 15.18% CAGR as omni-channel retailers seek faster fulfilment. Cognibotics’ HKM1800 executes over 2,000 cycles per hour for e-commerce parcel sorting, highlighting throughput advantages.
Welding and soldering lines stay relevant for EV chassis and battery busbar joins. Inspection stations increasingly use AI-vision to detect micro-defects: automated pharma pack lines now scan 7,200 vials per hour versus 2,000 manually. Specialty deployments include nuclear-plant thickness checks where robots function in 80 °C, 95% humidity environments.

By End-user Industry:
Food Sector Leads AdoptionFood and beverages seized 24.78% of the articulated robot market share in 2025 on the back of safety, hygiene, and labour-scarcity priorities. Tasteful Selections’ potato bagging line uses FANUC delta robots and soft grippers to cut waste and lost-time injuries. Heineken’s bottle-picking robot improved operator ergonomics while sustaining belt speeds.
Automotive lines are poised for the fastest 15.71% CAGR as EV modules demand high-precision adhesive dispensing and torque-controlled fastening. Electronics assemblers harness cobots for connector placements, gaining 25% line-speed lifts with Marelli’s implementation. Medical-device plants, metals shops, and logistics operators round out demand, together underpinning articulated robot industry diversification.
Geography Analysis
APAC Articulated Robot Market
Asia-Pacific retained its dominance with 42.05% revenue in 2025, propelled by China’s scale and Japan’s innovation ecosystems. Regional governments fund lighthouse projects that accelerate SME uptake, stabilising articulated robot market size gains even as domestic wage growth tempers cost advantages. Japan’s Robot Tax Credit and Korea’s AI Voucher Scheme keep pipeline activity robust.
South America Articulated Robot Market
South America is forecast to grow the fastest at 14.86% CAGR through 2031, underwritten by foreign direct investments in automotive electrification and agri-automation. Brazil’s SOLIX field robot shows how AI vision extends articulated design into open-field crop management. Case IH’s USD 20 million Sorocaba upgrade embeds AI to command 90% harvester functions, demonstrating regional appetite for advanced robotics.
North America and EMEA Articulated Robot Market
North America posted 12% year-on-year installation growth in 2024—totaling 44,303 units—supported by federal reshoring incentives and EV supply-chain projects. Europe faces energy-price headwinds yet invests in local capacity; Yaskawa’s EUR 31.5 million Slovenian hub will localise 80% of EMEA robot deliveries by 2027. The Middle East and Africa remain nascent but attract pilots in construction and petrochemical maintenance, laying the groundwork for long-run articulated robot market adoption.


Competitive Landscape
The articulated robot market features a moderately concentrated field where the top five incumbents—ABB, FANUC, Yaskawa, KUKA, and Kawasaki—control an estimated 55–60% of shipments. ABB’s decision to spin off its USD 2.3 billion robotics arm in 2026 aims to sharpen capital allocation and talent attraction. [3]Peter Campbell, “ABB Q1 profit beats forecasts as company announces robotics spin-off,” Reuters, reuters.com FANUC continues to widen its delta-robot range for high-hygiene sectors, while Yaskawa scales European assembly to compress lead times.
Chinese OEMs now account for 52% of global installations, leveraging domestic demand and vertically integrated supply chains to undercut pricing. Start-ups such as RoboForce target niche gaps with 1 mm-accuracy arms guided by spatial AI, attracting USD 10 million in seed funding. Formic’s pay-per-output service model appeals to risk-averse SMEs, signalling a business-model pivot from product to uptime value.
Technology raceways focus on AI-driven adaptability and energy efficiency. Patent filings for obstacle-recognition algorithms are rising, with AI Inc. securing a US patent for comprehensive 3-D workspace mapping. Energy-saving grippers and carbon-fibre arms demonstrate how vendors combine hardware and software innovation to trim total cost of ownership, converging toward ‘net-zero factory’ aspirations.
Articulated Robot Industry Leaders
ABB Ltd.
FANUC Corporation
Yaskawa Electric Corp.
KUKA AG
Kawasaki Heavy Industries Ltd.
- *Disclaimer: Major Players sorted in no particular order
Articulated Robot Market Companies Covered in this Report
- ABB Ltd.
- FANUC Corporation
- Yaskawa Electric Corp.
- KUKA AG
- Kawasaki Heavy Industries Ltd.
- Mitsubishi Electric Corp.
- Nachi-Fujikoshi Corp.
- DENSO Corp.
- Seiko Epson Corp.
- Stäubli International AG
- Hyundai Robotics Co., Ltd.
- Comau SpA
- Omron Adept Technology Inc.
- Universal Robots A/S
- Dürr AG (Paint Robots)
- Estun Automation Co., Ltd.
- SIASUN Robot & Automation Co.
- JAKA Robotics Ltd.
- Techman Robot Inc.
- Precise Automation Inc.
- CMA Robotics SpA
- Güdel Group AG
- IAI Corporation
- Aubo Robotics Inc.
- Robot Industrial Association (RIA)

Recent Industry Developments in Articulated Robot Market
- April 2025: Yaskawa invested EUR 31.5 million in a Slovenian distribution and assembly centre slated to handle 80% of EMEA orders by 2027.
- April 2025: ABB confirmed a Q2 2026 spin-off of its robotics division after the unit generated USD 2.3 billion revenue in 2024.
- March 2025: Hyundai Motor Group announced a USD 21 billion US investment plan, including Boston Dynamics robotics collaboration.
- January 2025: Formic surpassed 200,000 production hours on its Robots-as-a-Service platform, noting 180% demand growth and 99.8% uptime.
- January 2025: RoboForce secured USD 10 million in seed funding to commercialise AI-powered articulated robots with 1 mm accuracy.


Articulated Robot Market Report Scope and Research Methodology
Market Definition and Coverage
Our study defines the articulated robot market as all newly manufactured, multi-axis robotic arms with three to seven rotary joints that maneuver around obstacles to weld, palletize, paint, pick, and assemble. We capture only OEM revenues from unit shipments and their factory-installed controllers worldwide for 2019 to 2030, expressed in constant 2024 dollars.
Scope exclusion: Dedicated SCARA, delta, and gantry robots, rentals, refurbishment services, and spare-part sales sit outside scope.
Segments Covered in This Report
- By Payload Capacity
- Up to 16 kg
- 16 – 60 kg
- 60 – 225 kg
- Above 225 kg
- By Axis Type
- 4-Axis
- 5-Axis
- 6-Axis
- 7-Axis and Above
- By Application
- Material Handling
- Welding and Soldering
- Assembly
- Painting and Dispensing
- Packaging and Palletizing
- Inspection and Quality Assurance
- Others
- By End-user Industry
- Automotive
- Electrical and Electronics
- Metals and Machinery
- Pharmaceutical and Medical Devices
- Food and Beverages
- E-commerce and Logistics
- Other End-User Industries
- By Geography
- North America
- United States
- Canada
- Mexico
- South America
- Brazil
- Argentina
- Chile
- Rest of South America
- Europe
- Germany
- United Kingdom
- France
- Italy
- Spain
- Russia
- Rest of Europe
- Asia-Pacific
- China
- India
- Japan
- South Korea
- Singapore
- Malaysia
- Australia
- Rest of Asia-Pacific
- Middle East and Africa
- Middle East
- United Arab Emirates
- Saudi Arabia
- Turkey
- Rest of Middle East
- Africa
- South Africa
- Nigeria
- Egypt
- Rest of Africa
- Middle East
- North America
Data Sources, Market Sizing, and Validation
Primary Research
Mordor analysts interviewed factory automation engineers, systems integrators, and sourcing heads across Asia, Europe, and North America. These conversations clarified payload mix changes, discount practices, and integration lead times, then validated our preliminary model outputs.
Desk Research
We began by mapping historic installations and average selling prices from tier one public sources such as the International Federation of Robotics, UN Comtrade HS 847950 customs data, national statistics portals in China, Germany, and the United States, and Japan Robot Association briefs. Company 10-Ks, prospectuses, and investor day decks revealed production capacities and backlog shifts, while Questel patent analytics flagged lighter weight joint designs likely to pressure prices. Paid platforms like D & B Hoovers and Dow Jones Factiva helped us align company revenues by region. This list is illustrative; many additional open datasets and filings informed the desk phase.
Market-Sizing & Forecasting
A top down demand pool built on annual installation counts and trade data is multiplied by region specific average selling prices. Results are cross checked through selective bottom up roll ups, supplier shipment samples, and channel ASP times volume snapshots, and adjusted where gaps appear. Key variables include automotive production runs, semiconductor fab expansions, labor cost differentials, IFR utilization ratios, energy prices, and capex plans gathered in primary calls. Forecasts employ multivariate regression blended with scenario analysis to reflect currency swings and macro capex cycles. Unresolved gaps in bottom up checks are bridged with weighted averages from comparable payload classes.
Data Validation & Update Cycle
Outputs undergo variance checks against IFR benchmarks, spreadsheet audit trail anomaly flags, and senior analyst peer review. Reports refresh annually, with interim updates when events like major EV plant launches alter demand.
How Mordor Intelligence's Articulated Robot Market Size Compares to Other Published Estimates
Published estimates diverge because publishers shift scope, price assumptions, or refresh cadence. Our disciplined selection of new build global units, region specific ASPs, and yearly model updates offers a clearer baseline.
Benchmark comparison
| Market Size | Anonymized source | Primary gap driver |
|---|---|---|
| USD 26.92 B (2025) | Mordor Intelligence | |
| USD 28.30 B (2024) | Regional Consultancy A | Includes refurbished units and secondary installations |
| USD 3.35 B (2024) | Trade Journal B | Covers only North America; omits >225 kg payload class |
| USD 20.59 B (2025) | Global Consultancy C | Uses single ASP across payloads; limited primary checks |
By anchoring scope to new build shipments and triangulating prices through both desk and primary sources, Mordor delivers a balanced, transparent baseline that decision makers can replicate and trust.


Key Questions Answered in the Report
What is the current articulated robot market size and growth outlook?
The Articulated Robot Market was valued at USD 30.56 billion in 2026 and is projected to reach USD 57.63 billion by 2031, translating to a 13.52% CAGR.
Which region will grow the fastest through 2031?
South America is expected to post the highest 14.86% CAGR, driven by foreign investments in automotive electrification and agricultural robotics.
Why are lightweight articulated robots gaining popularity?
≤ 16 kg robots deliver higher speeds, lower energy consumption and safer human collaboration, spurring a 15.42% CAGR for this payload class.
What industries lead articulated robot adoption today?
Food and beverages hold 24.78% of 2025 revenue, leveraging robots for packaging, palletising and processing tasks.
How are supply-chain constraints affecting the articulated robot industry?
Semiconductor and rare-earth shortages are extending lead times and elevating costs, prompting OEMs to diversify suppliers and pursue vertical integration strategies.
What business models help SMEs overcome high upfront robot costs?
Robots-as-a-Service converts large cap-ex into predictable operating fees, offering uptime-guaranteed solutions that reduce adoption barriers.
Page last updated on:


