
Market Overview
| Study Period | 2020 - 2031 |
|---|---|
| Forecast Data Period | 2026 - 2031 |
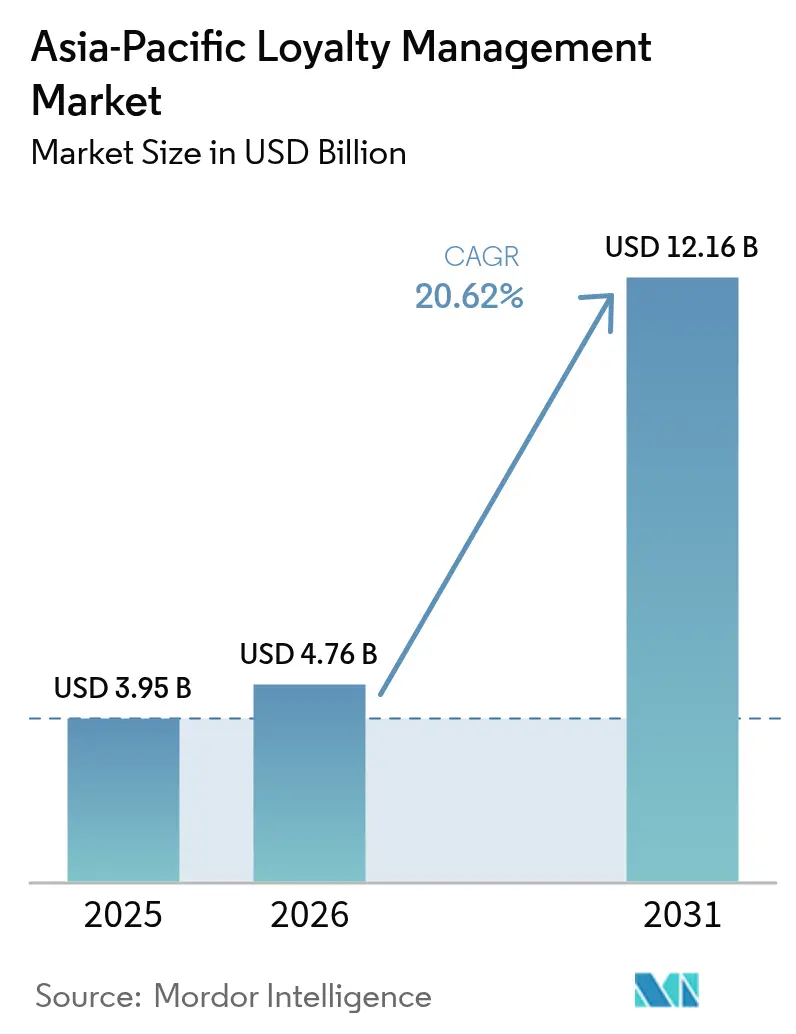
| Base Year Market Size (2025) | USD 3.95 Billion |
| Market Size (2026) | USD 4.76 Billion |
| Market Size (2031) | USD 12.16 Billion |
| Growth Rate (2026 - 2031) | 20.62 % |
| Market Concentration | Medium |
Major Players *Disclaimer: Major Players sorted in no particular order Image © Mordor Intelligence. Reuse requires attribution under CC BY 4.0. | |
Asia-Pacific Loyalty Management Market Analysis by Mordor Intelligence
The Asia-Pacific loyalty management market size is expected to grow from USD 3.95 billion in 2025 to USD 4.76 billion in 2026 and is forecast to reach USD 12.16 billion by 2031 at 20.62% CAGR over 2026-2031. Sustained double-digit growth springs from rapid digital payments adoption, cloud-native platform roll-outs, and government investment in real-time payment rails that make rewards issuance and redemption instantaneous. Financial-services incumbents intensify spending on AI-driven loyalty engines to arrest customer attrition, while retailers experiment with coalition models that share acquisition costs and unlock cross-brand insights. Interoperable QR codes and super-app ecosystems compress the distance between purchase and reward, vaulting mobile-first programs ahead of plastic card predecessors. Simultaneously, data-privacy legislation pushes vendors toward privacy-by-design architectures that embed consent orchestration from the ground up. Venture funding remains buoyant as private-equity investors back tokenized rewards and generative-AI orchestration layers that promise hyper-personalized value exchanges.
Key Report Takeaways
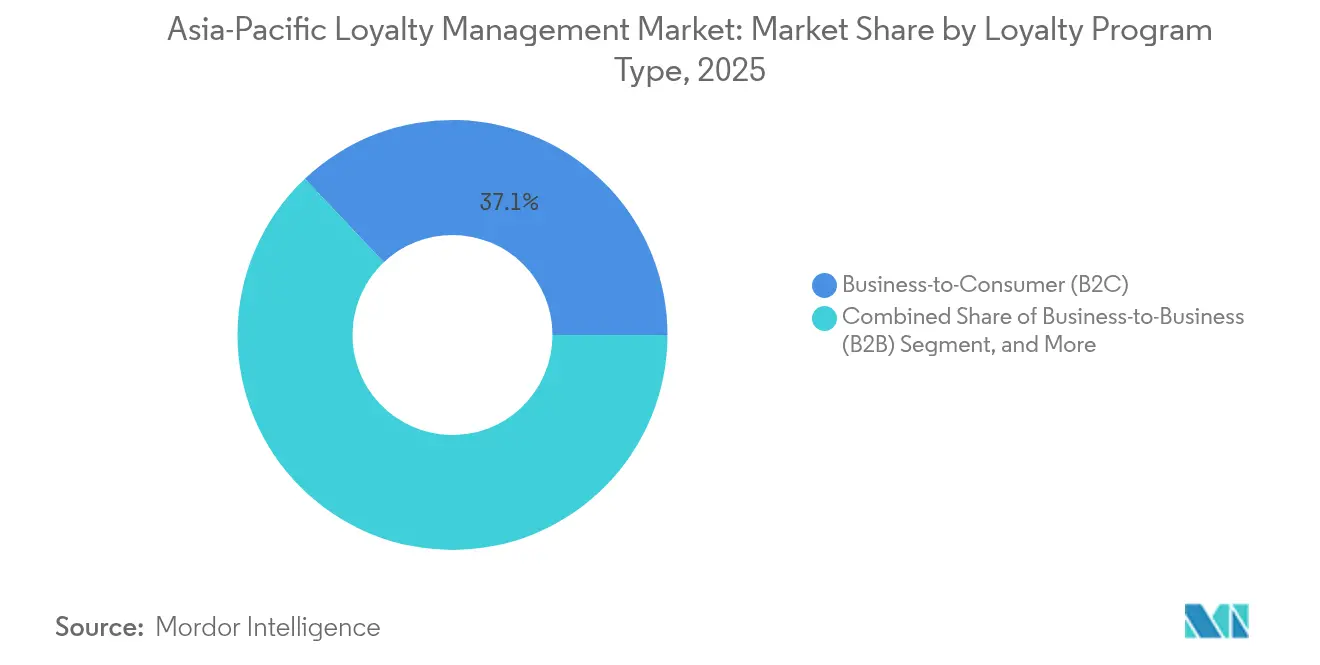
- By loyalty program type, business-to-consumer schemes held 37.05% of the Asia-Pacific loyalty management market share in 2025, while coalition and multipartner programs are expected to grow at a 21.13% CAGR through 2031.
- By component, software captured a 56.82% share of the Asia-Pacific loyalty management market size in 2025, while services are projected to advance at a 21.45% CAGR through 2031.
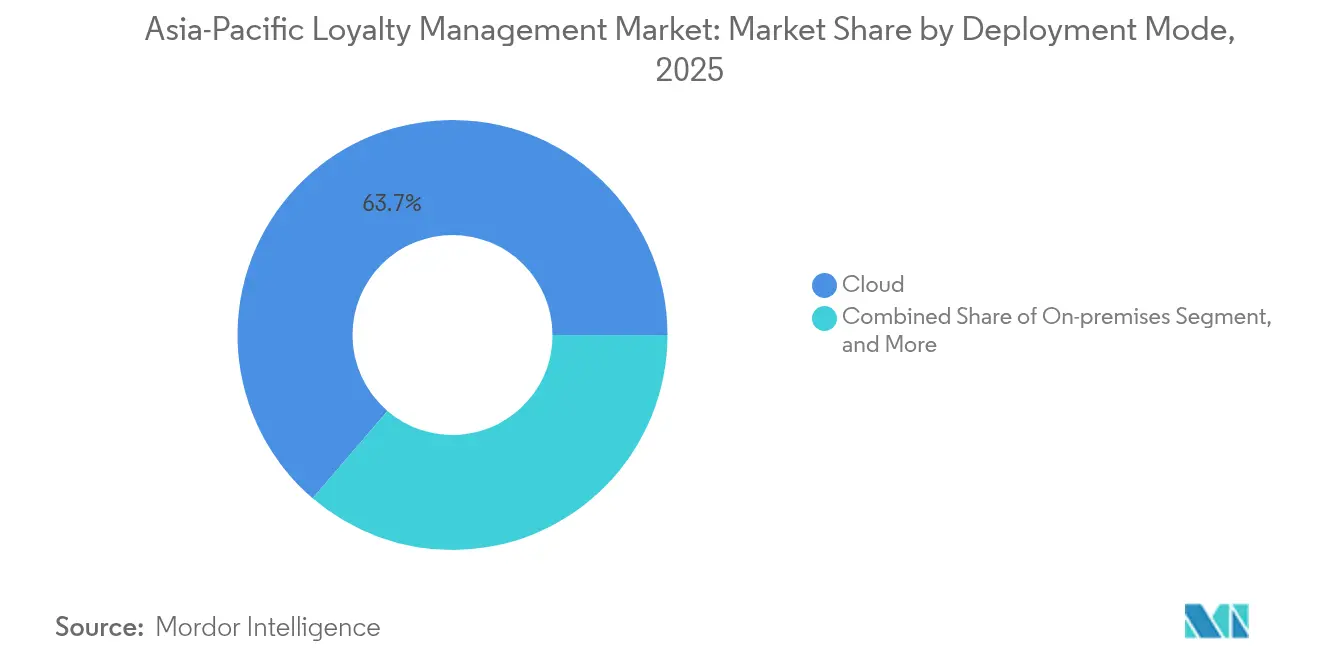
- By deployment mode, cloud led with a 63.73% revenue share in 2025 in the Asia-Pacific loyalty management market and is forecast to post a 21.68% CAGR through 2031.
- By end-user vertical, BFSI commanded 29.52% share of the Asia-Pacific loyalty management market size in 2025, while healthcare and pharmaceuticals record the fastest projected 21.06% CAGR through 2031.
Note: Market size and forecast figures in this report are generated using Mordor Intelligence’s proprietary estimation framework, updated with the latest available data and insights as of 2026.
Asia-Pacific Loyalty Management Market Trends and Insights
Drivers Impact Analysis*
| Driver | (~) % Impact on CAGR Forecast | Geographic Relevance | Impact Timeline |
|---|---|---|---|
| Proliferation of e-commerce and digital payments | +4.2% | Asia-Pacific-wide, strongest in China, India, Southeast Asia | Medium term (2-4 years) |
| Rapid smartphone penetration and mobile wallets | +3.8% | India, Indonesia, Philippines, Vietnam core markets | Short term (≤ 2 years) |
| Intensifying retail-bank competition for retention | +3.1% | Singapore, Australia, Japan, South Korea | Long term (≥ 4 years) |
| Advances in cloud-based loyalty tech platforms | +2.9% | Global, early adoption in Singapore, Australia | Medium term (2-4 years) |
| Interoperable QR / real-time payment rails (Govt-led) | +2.7% | Thailand, India, Malaysia, Singapore | Short term (≤ 2 years) |
| Loyalty-as-a-Service lowering SME entry barriers | +2.4% | Asia-Pacific emerging markets, SME-dense regions | Long term (≥ 4 years) |
| Source: Mordor Intelligence | |||
Proliferation of E-commerce and Digital Payments
Digital marketplaces multiply reward-eligible touchpoints, turning each checkout into a data-rich loyalty moment. Alipay Tap! surpassed 100 million users in 2024, demonstrating how super-apps can seamlessly integrate earn-and-burn loops into everyday payments.[1]Alipay, “Tap! Program Reaches 100 Million Users,” alipay.com India’s Unified Payments Interface enables instant point-to-point transfers between banks and merchants, reducing settlement cycles from days to seconds.[2]National Payments Corporation of India, “UPI Monthly Statistics 2025,” npci.org.in Coalition programs thrive because shared payment rails eliminate technical friction, allowing shoppers to redeem across verticals without additional logins. These real-time connections feed machine-learning models that refine offers with each swipe, boosting cart-conversion rates as personalization accuracy improves. Cloud-native loyalty engines dominate since only microservice architectures can orchestrate the high-velocity data streams generated by omnichannel checkouts.
Rapid Smartphone Penetration and Mobile Wallets
More than 82% of adults in Indonesia and 79% in the Philippines are expected to own a smartphone by 2026, providing merchants with a direct line to shoppers who were previously cash-only.[3]GSMA, “The Mobile Economy Asia Pacific 2025,” gsma.com OVO’s integration with Superbank shows how mobile wallets can layer card-free loyalty on top of savings and credit products, turning payments data into predictive churn alerts. In Malaysia, buy-now-pay-later apps reward early repayments with extra points, illustrating how embedded finance expands the scope of engagement beyond traditional retail coupons. Mobile-first strategies, especially for small merchants, benefit from white-label wallet SDKs, which enable them to launch QR-based rewards without building proprietary apps. As handset penetration surpasses legacy card infrastructure in rural areas, loyalty-as-a-service vendors capture a first-mover advantage by provisioning turnkey mobile journeys in weeks rather than months.
Intensifying Retail-Bank Competition for Retention
Asia-Pacific banks face compressing net-interest margins and treat loyalty as a defensive moat. DBS Bank operates over 800 AI models that transform transaction histories into targeted product recommendations, increasing cross-sell rates among millennial segments.[4]DBS Bank, “AI@DBS Use Case Library,” dbs.com Lifestyle coalitions between banks, airlines, and gyms deepen customer lock-in by rewarding everyday spending with travel perks and wellness upgrades. White-label platform providers profit as mid-tier lenders license ready-made engines instead of building in-house stacks. Regulatory hurdles surrounding the safeguarding of depositor data elevate entry barriers, giving incumbents with compliance credentials a head start. Over the long term, open-banking mandates are expected to nudge rivals into interconnected ecosystems where loyalty data and payment data co-mingle to boost share of wallet.
Advances in Cloud-Based Loyalty Tech Platforms
Shift to micro-services dismantles monolithic legacy systems, trimming time-to-market for new reward rules from weeks to hours. SAP Emarsys reports that Asia-Pacific retailers deploying cloud loyalty flows saw 37% faster campaign iteration during 2024. Auto-scaling clusters accommodate festival shopping spikes without the capital outlay of on-premise servers, and built-in geo-replication satisfies data-localization clauses in Singapore and India. Coalition operators depend on cloud hubs to run shared ledgers that reconcile points in real time across dozens of brands. Vendors offering region-specific data-residency zones win business from global apparel chains that must keep Indian customer records inside national borders. Reliance on hyperscalers does raise concentration risk, prompting procurement teams to demand multi-cloud failover strategies and stricter service-level clauses.
Restraints Impact Analysis*
| Restraint | (~) % Impact on CAGR Forecast | Geographic Relevance | Impact Timeline |
|---|---|---|---|
| Data-privacy regulations and trust concerns | -2.8% | China, India, Singapore, Australia, Vietnam | Medium term (2-4 years) |
| Fragmented regulatory landscape across Asia-Pacific | -2.1% | Southeast Asia, cross-border operations | Long term (≥ 4 years) |
| Legacy POS / IT integration complexity | -1.9% | Japan, South Korea, Australia enterprise markets | Medium term (2-4 years) |
| Surge in loyalty-currency fraud via real-time wallets | -1.6% | India, Indonesia, Thailand, Philippines | Short term (≤ 2 years) |
| Source: Mordor Intelligence | |||
Data-Privacy Regulations and Trust Concerns
China’s Personal Information Protection Law and Vietnam’s 2024 Data Decree require explicit consent for cross-border transfers, driving program operators to spin up local storage cluster. Compliance costs swell as privacy impact assessments become mandatory each time loyalty data flows between subsidiaries. Smaller vendors find legal retainers and certification audits onerous, surrendering deals to bigger rivals with established governance frameworks. Consumers grow wary after several high-profile breaches in Australia’s financial sector, trimming data-sharing opt-in rates for new app installs. In response, platforms bake consent receipts directly into wallet checkouts and publish transparent data-usage dashboards, turning privacy posture into a competitive differentiator rather than a simple checkbox.
Fragmented Regulatory Landscape Across Asia-Pacific
Where Singapore’s Payment Services Act defines e-money float limits, Thailand lacks equivalent clarity, forcing multi-country coalitions to maintain separate operating entities. Dentons notes that Australia’s wholesale CBDC sandbox, Project Acacia, could realign settlement models, yet leaves unanswered how tokenized points fit under existing consumer-credit rules. Compliance teams juggle divergent KYC thresholds, marketing-message opt-out windows, and tax reporting formats, adding layers of complexity with each geographic expansion. Economies of scale erode when every new market requires fresh legal reviews and localized terms of service. Regulatory sandboxes in Hong Kong and Malaysia offer experimentation leeway, yet permanent frameworks remain years away, elongating payback periods for cross-border investments.
*Our forecasts treat driver/restraint impacts as directional, not additive. The impact forecasts reflect baseline growth, mix effects, and variable interactions.
Segment Analysis
By Loyalty Program Type: Coalition Models Drive Cross-Platform Integration
The Asia-Pacific loyalty management market size for business-to-consumer programs stood at USD 1.46 billion in 2025, translating into 37.05% category share. Coalition and multipartner schemes are forecast to expand at a 21.13% CAGR through 2031 as consumers seek point portability and merchants aim to dilute acquisition costs. The Asia-Pacific loyalty management market share for coalition models is expected to climb steadily because standardized QR payment rails lower technical friction at checkout, allowing shoppers to redeem across supermarkets, fuel stations, and cinemas in one tap. Smaller retailers treat coalition participation as an affordable substitute for proprietary programs, leveraging shared customer-data lakes to refine inventory decisions and promotional calendars.
Second-order effects emerge as pharmaceutical wholesalers launch B2B coalitions that reward clinics for formulary adherence, illustrating how coalition architectures stretch beyond traditional consumer contexts. Employee-loyalty sub-segments see renewed interest among manufacturers that embed performance-based rewards into supply-chain dashboards, creating a virtuous loop between operational KPIs and workforce motivation. Business-to-business programs also adopt blockchain-anchored smart contracts to automate payout triggers once distributors hit quarterly sales thresholds. The interplay of these models signals a future where coalition logic underpins both customer and partner engagement strategies across the Asia-Pacific loyalty management market.



By Component: Services Growth Outpaces Software Platforms
Software platforms generated USD 2.24 billion in 2025, representing 56.82% of total revenue, yet services are on a faster 21.45% CAGR trajectory to 2031. Implementation consulting, regulatory compliance advisory, and managed operations top enterprise procurement checklists as organizations struggle to staff in-house loyalty teams. The Asia-Pacific loyalty management market size allocation toward services will widen further once new privacy laws trigger demand for data-protection audits and consent-workflow redesigns. Vendors specializing in regional compliance nuances win retainer contracts because they translate legal text into technical controls that pass regulator scrutiny.
Managed-service models gain ground among mid-market chains that lack the bandwidth to monitor campaign performance daily. Service partners take over A/B testing, reward-ledger reconciliation, and customer-support queues, charging outcome-based fees pegged to incremental revenue lift. As cloud platforms mature, software margins thin out, shifting negotiating power toward value-added consultancy. This component mix evolution aligns with a broader industry pivot from technology delivery to business-outcome accountability within the Asia-Pacific loyalty management industry.
By Deployment Mode: Cloud Dominance Accelerates
Cloud deployments captured 63.73% revenue in 2025 and are projected to grow at a 21.68% CAGR, cementing their position as the backbone of the Asia-Pacific loyalty management market. Low upfront capital, elastic scaling, and built-in patch management make cloud the default choice for enterprises rolling out region-wide programs. The Asia-Pacific loyalty management market size attributed to cloud is poised to top USD 8.17 billion by 2031. On-premise implementations persist only in defense, government, and certain financial institutions where statutory data-sovereignty clauses override cost calculus. Hybrid architectures emerge when conglomerates segment workloads by sensitivity, keeping personally identifiable information on-shore while offloading analytics to hyperscale clusters.
Cloud dominance fosters a flourishing marketplace of third-party micro-services, from gamification widgets to AI-driven offer engines, that plug into loyalty hubs via REST APIs. Enterprises appreciate how micro-service orchestration permits modular upgrades, letting them toggle new features without disrupting core ledgers. Latency concerns recede as CDN nodes proliferate across Tier-2 cities, ensuring real-time reward accrual even during flash sales. Still, reliance on stable connectivity makes fall-back offline modes vital in geographies prone to network outages, nudging providers to offer edge-caching options.
By End-User Vertical: Healthcare Emerges as Growth Leader
Banks, insurers, and fintechs together commanded 29.52% revenue share in 2025 due to entrenched reward-card ecosystems and high wallet transaction volumes. Yet healthcare and pharmaceuticals are forecast to be the fastest-growing vertical at a 21.06% CAGR as hospitals digitize patient journeys and drugmakers incentivize physician adherence to therapy protocols. The Asia-Pacific loyalty management market share generated by healthcare is expected to double by 2031, propelled by telemedicine, wearable-linked wellness points, and chronic-care adherence programs. Aging populations in Japan and Australia spur insurers to bundle preventive-health incentives with coverage renewals, pushing program complexity beyond simple point systems.
Consumer-goods manufacturers embrace data-rich collaborative campaigns that reward cross-brand basket combinations, turning supermarket scanners into loyalty enrollment touchpoints. Telecom operators extend points ecosystems to device-financing programs and streaming bundles, reinforcing stickiness in markets where prepaid churn remains high. Travel and hospitality rebound fuels renewed airline-hotel partnerships that layer flexible currencies atop dynamic-pricing engines, giving travelers more redemption optionality during peak seasons.
Geography Analysis
China and India collectively contribute more than 57.68% of Asia-Pacific loyalty management market revenue, powered by massive consumer bases and flourishing mobile-payment ecosystems. China’s super-app dominance lets users accrue points, pay bills, and trade vouchers within a single interface, condensing the purchase-to-reward cycle into seconds. India’s UPI rails deliver similar immediacy; the latest Reserve Bank of India data show monthly transaction counts surpassing 12 billion in 2025, creating fertile ground for real-time rewards attached to peer-to-merchant transfers. Both nations illustrate how payment infrastructure directly shapes loyalty innovation trajectories.
Singapore and Australia punch above their population weight in per-capita loyalty spending, acting as living labs for biometric authentication and bank-wallet interoperability pilots. Regulatory clarity in these markets accelerates vendor experimentation, and successful prototypes often cascade to larger economies once proof-points mature. Japan and South Korea display near-universal loyalty card enrollment yet battle growth plateaus because of demographic stagnation and market saturation. Their operators pivot toward experiential perks and gamified fitness challenges to rekindle engagement among younger cohorts.
Southeast Asian markets, Indonesia, Thailand, Vietnam, and the Philippines, score the highest forward CAGR as smartphone adoption and e-commerce GMV outstrip regional averages. Governments champion interoperable QR networks that reduce merchant fees and level the playing field for neighborhood stores. Regional tourism corridors offer coalition opportunities; for instance, Singapore-Malaysia rail commuters can soon redeem points earned in Kuala Lumpur coffee chains at Singapore bookstores once payment networks link. The Rest of Asia-Pacific cluster, including emerging economies like Bangladesh and Cambodia, lags today but offers long-run upside once 4G coverage, digital-ID systems, and consumer-credit penetration reach critical mass.
Regulatory Landscape
Loyalty program operators in Asia-Pacific manage overlapping controls across personal data, payments, and consumer marketing, with cross-border data transfer and localization mandates creating most of the operational friction. China remains a key compliance reference point under its Personal Information Protection Law, and outbound transfer governance tightened further with the Measures for the Certification of Outbound Personal Information Transfer taking effect in January 2026, reinforcing the need for consent orchestration, transfer assessments, and approved transfer mechanisms for multi-country loyalty data flows.
Across the region, fragmentation persists where payment and stored-value frameworks are not uniform, complicating coalition expansion and wallet-linked rewards. Australia continues to enforce privacy obligations through the Office of the Australian Information Commissioner (OAIC) and consumer protection oversight by the Australian Competition and Consumer Commission (ACCC), while Vietnam requires strict data rules that shape cross-border program architectures. India is moving toward a more consent-centric compliance posture under its Digital Personal Data Protection Act (DPDPA), which is prompting loyalty operators and vendors to redesign enrollment, preference management, and data-sharing transparency to sustain compliant omnichannel earn-and-burn experiences.
Value Chain Analysis
The loyalty management value chain in Asia-Pacific begins with data and transaction signal generation across POS systems, e-commerce checkouts, mobile wallets, and bank rails, then routes into loyalty platforms that manage identity, consent, ledgers, rules, and analytics. SaaS platform vendors and cloud infrastructure providers support core processing, while system integrators and managed service partners handle deployment, migration from legacy stacks, and ongoing campaign operations. Enterprise buyers in BFSI, retail, travel, telecom, and healthcare typically connect loyalty engines to CDPs/CRMs, marketing automation, and fraud controls, then distribute offers through super-apps, wallet UIs, and partner channels.
Partner ecosystem and distribution layers are increasingly shaped by cross-industry alliances and cloud-native implementations. Mastercard linking payment cards to the K Dollar Program (November 2024) is an example of how payment-linked accrual can reduce manual receipt scanning, while airlines have continued modernizing loyalty infrastructure via IBS Software deployments, including the Emirates Skywards go-live on cloud-native iLoyal (September 2025) and STARFLYERs cloud upgrade (July 2025). Telecom-led coalitions also function as demand channels, such as Dragonpass partnering with the WanderJoy Travel Alliance (October 2025) to deliver cross-border telco rewards through operators including Singtel, AIS, and KDDI. On the supply side, platform releases such as Comviva MobiLytix Rewards 5.0 (March 2025) reflect the move toward AI-led, API-first SaaS stacks hosted on hyperscalers to accelerate partner onboarding and real-time personalization.
Competitive Landscape
Competitive intensity remains moderate as legacy enterprise software giants square off against nimble cloud-native disruptors. Capillary Technologies raised USD 95 million in February 2024 to bolster AI experimentation and has since pursued inorganic expansion, acquiring Kognitiv in May 2025 to import advanced analytics and deepen its North American client roster. Enterprise suites defend incumbency with holistic feature sets, native compliance modules, and deep system-integration pedigrees that appeal to regulated verticals such as banking. Disruptors undercut on speed and cost, offering modular APIs and outcome-based pricing attractive to SMEs and digital-first brands.
Blockchain tokenization surfaces as a white-space battleground. Mastercard’s pilots demonstrate how programmable rewards can limit fraud and seamlessly translate into multiple partner currencies. Traditional vendors race to embed ledger connectors to avoid dis-intermediation. Meanwhile, marketing-cloud majors tighten cross-sell motions between email automation, CDP layers, and loyalty engines, positioning themselves as end-to-end engagement suites. Consolidation is expected to continue as scale economics favor platforms that can amortize R&D across diverse client bases and compliance jurisdictions.
Strategic alliances also reshape the field. DBS partnered with e-commerce giants to pipe transactional insights into its lifestyle rewards hub, proving the value of cross-industry data pooling. Telecom carriers court hospitality chains to craft mobile-centric travel passes redeemable for roaming data. Vendors able to orchestrate such tri-party ecosystems secure competitive moats anchored in network effects rather than feature checklists.
Asia-Pacific Loyalty Management Industry Leaders
Aimia Inc.
Comarch SA
Edenred SA
Epsilon Data Management LLC
Maritz Holdings Inc.
- *Disclaimer: Major Players sorted in no particular order


Market Opportunities and Future Outlook
One major opportunity sits at the intersection of real-time payments, interoperable QR, and coalition loyalty, where merchants want instant earn-and-burn at checkout without forcing separate apps or logins. This shows up in payment-driven engagement loops, such as Alipay Tap! surpassing 100 million users in 2024 and Indias UPI scaling monthly transaction counts beyond 12 billion in 2025, both of which support immediate, wallet-embedded reward journeys. Vendors that provide API-first connectors into these payment flows, along with reconciled multi-partner ledgers, have whitespace to simplify coalition onboarding for SMEs and cross-vertical partnerships across retail, travel, and telecom.
A second opportunity is privacy-by-design loyalty infrastructure and services that operationalize consent, data residency, and cross-border transfer controls while preserving personalization. With China tightening outbound transfer governance through the January 2026 certification measures, Vietnam enforcing strict data rules, and India emphasizing a consent-centric model under the DPDPA, program owners are allocating more spend to consent orchestration, local data zones, and auditable data-sharing workflows. That dynamic increases demand for vendors and service partners that can deliver compliant cloud and hybrid reference architectures, fraud-resistant reward ledgers for real-time wallets, and managed operations that convert regulatory requirements into deployable controls across multi-country programs.
Recent Industry Developments
- April 2026: Edenred reaffirmed its Amplify25-28 plan priorities, emphasizing data and AI-driven solutions across its engagement and benefits offers. The update highlights continued product investment in analytics-led personalization and operational tooling that can be localized across Asia-Pacific markets where Edenred operates, supporting more automated campaign execution and partner-funded reward economics.
- July 2025: Dragonpass formed a strategic partnership with the WanderJoy Travel Alliance, involving mobile operators including Singtel, AIS, and KDDI, to deliver cross-border telco-led travel rewards. The alliance structure expands distribution for loyalty benefits through carrier channels and strengthens multi-partner redemption use cases that depend on standardized integrations across countries.
- July 2024: Comarch became a technology partner of Bridge Alliance, a telecom operator alliance spanning multiple Asia-Pacific markets. The partnership positions Comarch to integrate loyalty and engagement capabilities into operator ecosystems, enabling larger-scale, multi-market deployments through a single alliance channel.


Research Methodology Framework and Report Scope
Market Definition and Coverage
This market covers loyalty management platforms and services used by organizations in APAC to design, run, and measure loyalty programs, including points, tiers, offers, and partner earning and redemption, across digital and offline touchpoints.
Scope exclusions: The sizing excludes general advertising spend, payment processing fees, and broad CRM suites when they are not directly sold or used as loyalty management.
Segmentation Overview
- By Loyalty Program Type
- Business-to-Consumer (B2C)
- Business-to-Business (B2B)
- Coalition / Multipartner
- Employee / Channel Loyalty
- By Component
- Software
- Services
- By Deployment Mode
- Cloud
- On-premises
- Hybrid
- By End-user Vertical
- BFSI
- Consumer Goods and Retail
- Travel and Hospitality
- IT and Telecom
- Healthcare and Pharmaceuticals
- Other End-user Verticals
- By Country
- China
- India
- Japan
- South Korea
- Australia
- Singapore
- Indonesia
- Thailand
- Vietnam
- Philippines
- Rest of Asia-Pacific
Data Sources, Market Sizing, and Validation
Desk Research
Desk work starts by aligning definitions and building a clean APAC demand story that can be traced to public signals. We rely on national statistics offices for services output, central bank releases for inflation and FX series, telecom regulators for connectivity indicators, and customs portals for high-level ICT trade signals where relevant. To keep it grounded, we also review standards and policy references around data privacy and consent, along with peer reviewed journals that cover loyalty mechanics and consumer behavior.
On the industry side, we add company filings, annual reports, investor presentations, and credible press coverage to understand product positioning and typical pricing models. Patent databases and company financials, along with an intelligence subscription, are used selectively to confirm product focus and track ownership changes that can distort historical comparisons. This list is not exhaustive, and many other public documents were used for collection, cross checks, and clarification.
Primary Interviews and Surveys
Primary inputs come from interviews and structured surveys with loyalty program operators, solution providers, channel partners, and end users across retail, BFSI, travel, and telecom. Since the work is regional, we balance input across larger APAC economies and faster growing Southeast Asian markets, and we revisit discussions when assumptions shift, for example cloud migration pace or redemption funding practices.
Distribution of primary research fieldwork respondents
| Company type | Respondent position |
|---|---|
| Top tier: 27% | CXOs: 15% |
| Mid tier: 51% | Functional/Unit leaders: 41% |
| Smaller Players: 22% | Managers: 44% |
Market-Sizing & Forecasting
Sizing is built using a top-down demand pool reconstruction, where adoption and spend intensity are applied to measurable program footprints in APAC and then rolled forward by country. After the headline totals are formed, we corroborate them with selective bottom-up checks using sampled vendor revenues, channel feedback, and typical price per member or price per program benchmarks, which are then adjusted when coverage gaps appear.
Key inputs are selected because they are practical to validate: loyalty membership base growth, active member rates, digital payments penetration (which affects earn and redeem frequency), cloud deployment mix, industry vertical expansion in retail and BFSI, and the shift toward coalition and partner networks. Where country data is thin, proxy indicators such as card issuance, e-commerce share, and mobile app usage are used, and the assumptions are pressure tested in interviews.
For forecasting, scenario analysis is used, since the trajectory depends on macro conditions and regulation as much as on technology. Growth paths are anchored on inflation and FX outlooks, program activity recovery in travel, and the expected pace of automation in offer targeting and redemption processing, as shared by market participants.
Data Validation & Update Cycle
Validation is done through multiple checks so the numbers do not rely on a single input. We compare outputs against independent signals like enterprise software spending trends, reported digital commerce growth, and country level adoption patterns, and then investigate variances that fall outside expected ranges. When a large mismatch is seen, follow ups are triggered with respondents to confirm whether the cause is pricing, scope, or timing.
Before sign off, the model goes through stepwise analyst reviews, including a final pass for arithmetic integrity, currency conversion timing, and outlier country growth. The report is refreshed annually, and interim updates are made when major events occur, such as policy changes on data use or a meaningful shift in cloud pricing.
Mordor Intelligence's APAC Loyalty Management Market Sizing Compared With Other Published Estimates
Published market values for APAC loyalty management can look far apart, even when the topic name sounds the same. The differences usually come from what is counted as loyalty management, how regional coverage is handled, and whether the model is anchored on program activity versus broad marketing technology budgets.
The table helps show where the spread comes from, because some sources blend loyalty management with wider loyalty programs value or include adjacent CRM and campaign tooling. Timing also matters, since currency conversion choices and inflation assumptions can move a regional USD total, especially when growth is fast and country mix shifts.
Benchmark comparison
| Source | Market Size | Gaps in Research Methodology |
|---|---|---|
| Mordor Intelligence | USD 3.95 B (2025) | |
| Industry Research Outlet A | USD 3.51 B (2026) | Uses 2026 as the estimate year and applies a narrower component split that can undercount services tied to program operations and partner earning and redemption, which reduces the captured spend pool. |
| Regional Consultancy B | USD 3.77 B (2025) | Extends the definition toward a broader loyalty stack and applies a longer dated forecast window, which can pull in adjacent engagement tools and inflate the modeled trajectory versus a tighter platform and services view. |
The table shows the biggest gaps come from year selection and what is treated as in-scope spend, and in Mordor Intelligence's model the value is tied to loyalty management platform and service revenues linked to operating programs across APAC rather than the full consumer rewards value or unrelated marketing software. With these choices made explicit, the final number stays traceable to clear activity drivers and can be repeated when new country data or pricing signals are updated.


Key Questions Answered in the Report
What is the 2026 valuation of the Asia-Pacific loyalty management market?
The market stands at USD 4.76 billion in 2026 and is projected to hit USD 12.16 billion by 2031.
Which loyalty-program type is expanding fastest in Asia-Pacific?
Coalition and multipartner programs lead with a 21.13% CAGR forecast through 2031.
Why are healthcare organizations adopting loyalty platforms?
Patient-engagement digitization and pharmaceutical channel incentives push healthcare to the highest 21.06% CAGR among verticals.
How dominant is cloud deployment across loyalty platforms?
Cloud models already hold 63.73% revenue share and will continue to outpace on-premise setups through 2031.
What key regulation influences loyalty data transfers in Asia-Pacific?
China’s Personal Information Protection Law and similar statutes in Vietnam and India impose strict consent and localization rules affecting cross-border programs.
Page last updated on:


 Your data is secure and never sold or shared.


