
Antisense And RNAi Therapeutics Market Size and Share
Market Overview
| Study Period | 2020 - 2031 |
|---|---|
| Market Size (2026) | USD 5.66 Billion |
| Market Size (2031) | USD 13.08 Billion |
| Growth Rate (2026 - 2031) | 18.22 % |
| Fastest Growing Market | Asia-Pacific |
| Largest Market | North America |
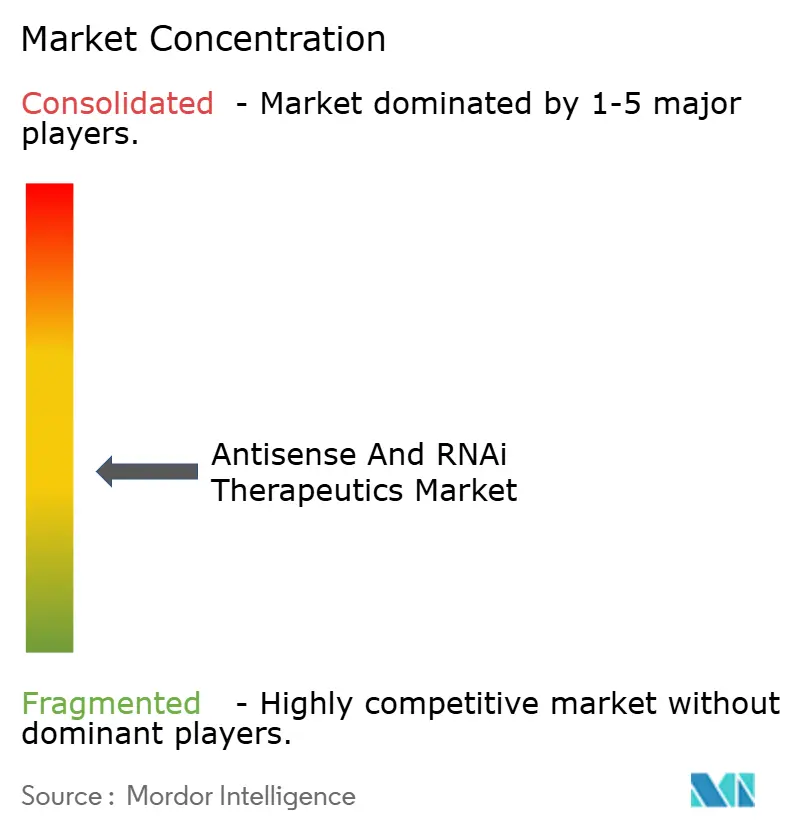
| Market Concentration | Medium |
Major Players *Disclaimer: Major Players sorted in no particular order Image © Mordor Intelligence. Reuse requires attribution under CC BY 4.0. | |
Antisense And RNAi Therapeutics Market Analysis by Mordor Intelligence
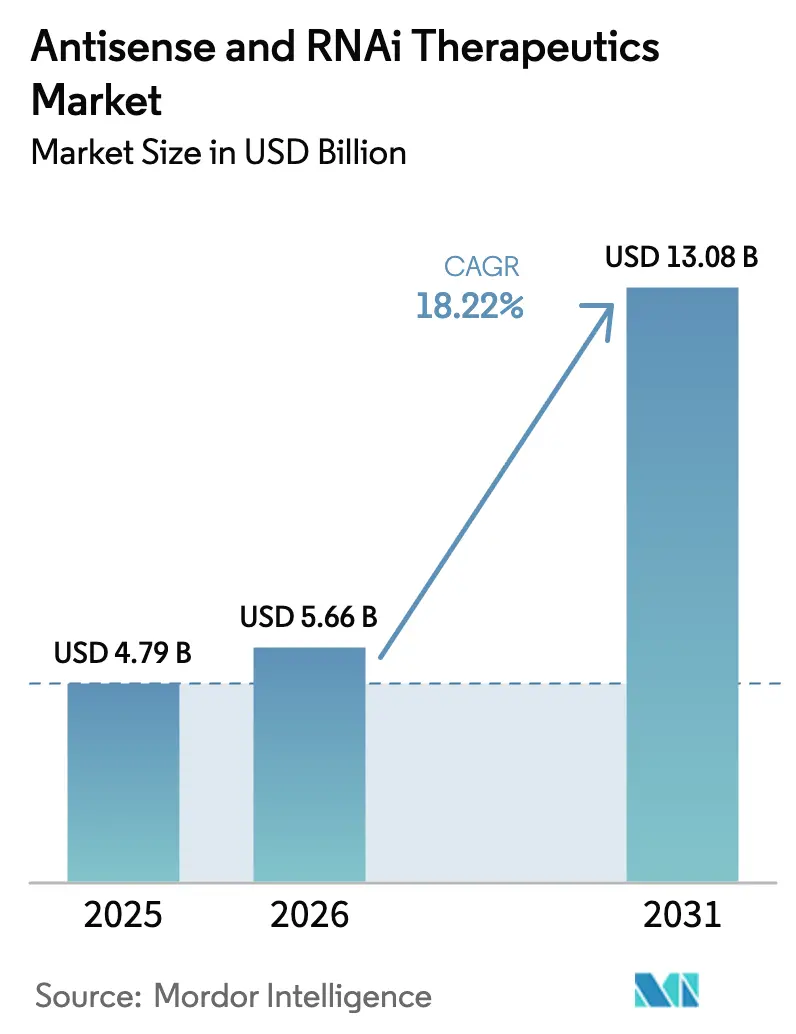
Antisense & RNAi Therapeutics market size in 2026 is estimated at USD 5.66 billion, growing from 2025 value of USD 4.79 billion with 2031 projections showing USD 13.08 billion, growing at 18.22% CAGR over 2026-2031. Growing clinical proof around RNA-based precision medicine, steady regulatory support, and scalable manufacturing know-how are moving these modalities from niche research tools into front-line treatment options that compete with both traditional small molecules and biologics. Rising demand for disease-modifying therapies in genetic, neurologic, and cardiometabolic disorders is reinforcing investment flows, while technology breakthroughs such as GalNAc conjugates and next-generation lipid nanoparticles are driving down dose requirements, lowering immunogenicity, and broadening tissue reach [1]. The Antisense & RNAi Therapeutics market is also shaped by widening orphan-drug and fast-track incentives that compress timelines to approval, the maturation of large-scale oligonucleotide production capacity, and growing payer acceptance of outcomes-based reimbursement models[2]. Competition is simultaneously intensifying, with established leaders defending intellectual property in delivery and chemistry while newcomers pursue extra-hepatic targeting and combination regimens.
Key Report Takeaways
- By molecule type, siRNA held 64.92% of Antisense & RNAi Therapeutics market share in 2025, whereas antisense oligonucleotides are projected to expand at a 20.33% CAGR through 2031.
- By route of administration, intravenous delivery accounted for 47.12% of the Antisense & RNAi Therapeutics market size in 2025, while intrathecal delivery is advancing at a 19.86% CAGR to 2031.
- By therapeutic area, rare genetic disorders captured 38.21% revenue share of the Antisense & RNAi Therapeutics market in 2025 and cardiometabolic applications are pacing the field with a 20.08% CAGR to 2031.
- By geography, North America commanded 42.58% of the Antisense & RNAi Therapeutics market size in 2025, whereas Asia-Pacific is set to grow the fastest at a 20.19% CAGR through 2031.
Note: Market size and forecast figures in this report are generated using Mordor Intelligence’s proprietary estimation framework, updated with the latest available data and insights as of 2026.
Market Trends and Insights
Drivers Impact Analysis of Antisense And RNAi Therapeutics Market*
| Driver | (~) % Impact on CAGR Forecast | Geographic Relevance | Impact Timeline |
|---|---|---|---|
| Rise in prevalence of genetic disorders | +3.2% | Global, with concentration in North America & Europe | Long term (≥ 4 years) |
| Better therapeutic outcomes for rare diseases | +2.8% | North America & EU regulatory frameworks | Medium term (2-4 years) |
| Surge in R&D funding & robust pipeline | +4.1% | Global, led by North America venture capital | Short term (≤ 2 years) |
| Orphan-drug & fast-track regulatory incentives | +2.5% | North America & EU primary, expanding to APAC | Medium term (2-4 years) |
| Breakthrough GalNAc & LNP delivery platforms | +3.7% | Global technology adoption | Short term (≤ 2 years) |
| Extra-hepatic antibody-siRNA conjugates open new disease areas | +2.2% | North America & Europe early adoption | Long term (≥ 4 years) |
| Source: Mordor Intelligence | |||
Rise in Prevalence of Genetic Disorders
Continuously improving genome sequencing is identifying treatable mutations in more than 7,000 rare diseases, giving therapeutic developers clear molecular targets and predictable patient pools [3]. The resulting clinical demand reshapes R&D portfolios toward programs that were once deemed commercially unattractive. Combined with an annual economic burden that surpasses USD 800 billion in developed markets, the unmet-need narrative has secured sustained capital inflows and policy attention. Accelerated review pathways now regularly shorten development cycles to eight or nine years, and payer willingness to reward curative potential has tempered concerns about premium launch prices. Patient-advocacy pressure further amplifies adoption by encouraging earlier diagnosis and streamlined coverage decisions.
Better Therapeutic Outcomes for Rare Diseases
Head-to-head trial readouts published in 2024 showed antisense oligonucleotides delivering 40-60% functional gains in spinal muscular atrophy compared with 15-25% on standard regimens. These magnitude-of-effect differences are reshaping prescribing guidelines and catalyzing the shift from symptomatic to disease-modifying strategies. Payers increasingly accept cost-per-QALY thresholds well above USD 150,000 when clinical durability and life-quality improvements are evident. Meeting these benchmarks generates confident launch trajectories and fosters constructive risk-sharing frameworks between innovators and insurers.
Surge in R&D Funding and Robust Pipeline
Venture, strategic, and public capital allocations reached USD 8.2 billion in 2024, a 45% year-over-year jump that underscores investor conviction in platform scalability. Funds are underwriting multi-asset pipelines that diversify program risk and position companies to run simultaneous mid-stage trials. Meanwhile, big-pharma alliances inject global development and commercialization muscle, creating blended models that unite RNA chemistry depth with late-stage execution capacity. More than 200 active clinical projects now span rare, neurodegenerative, and mainstream chronic indications, and roughly 40% tackle previously undruggable protein targets.
Orphan-Drug and Fast-Track Regulatory Incentives
Twelve RNA therapeutics secured FDA breakthrough designation in 2024, double the prior year, reflecting regulator confidence in safety and efficacy standards. Orphan-drug status guarantees seven-year exclusivity that underwrites investment risk, while rolling-review protocols compress pre-approval timelines. Parallel scientific advice programs in Europe align studies across jurisdictions, smoothing multinational submissions. Taken together, these tools build competitive moats and reinforce first-mover advantages for companies that rapidly translate pipeline success into market availability.
Restraints Impact Analysis of Antisense And RNAi Therapeutics Market*
| Restraint | (~) % Impact on CAGR Forecast | Geographic Relevance | Impact Timeline |
|---|---|---|---|
| High treatment cost & reimbursement pressure | -2.8% | Global, acute in cost-sensitive markets | Medium term (2-4 years) |
| Delivery-related off-target / immune effects | -1.9% | Global regulatory concern | Short term (≤ 2 years) |
| Oligonucleotide API capacity bottlenecks & IP litigation | -1.5% | Global supply chain impact | Short term (≤ 2 years) |
| Short shelf-life and stability issues | -1.2% | Global distribution challenge | Long term (≥ 4 years) |
| Source: Mordor Intelligence | |||
High Treatment Cost and Reimbursement Pressure
Annual therapy prices that exceed USD 300,000 trigger heightened health-technology assessments, especially where budgets are inflexible. Payers impose evidence-development clauses and claw-back terms to align reimbursement with real-world performance. Manufacturers respond with indication-based pricing, longer installment payment options, and risk-sharing contracts. The resource intensity of these negotiations can stretch smaller firms, potentially slowing launches in less affluent regions.
Delivery-Related Off-Target and Immune Effects
Even with optimized chemistry, 15-20% of patients still exhibit innate immune activation tied to Toll-like receptor signaling. Off-target silencing, though rarer, alarms regulators when chronic exposure is required. Developers now front-load design-for-safety work, integrate high-throughput off-target screens, and embed immune-monitoring cohorts into mid-stage trials, steps that raise R&D costs and prolong timelines.
*Our forecasts treat driver/restraint impacts as directional, not additive. The impact forecasts reflect baseline growth, mix effects, and variable interactions.
Antisense And RNAi Therapeutics Market Segment Analysis
By Molecule Type:
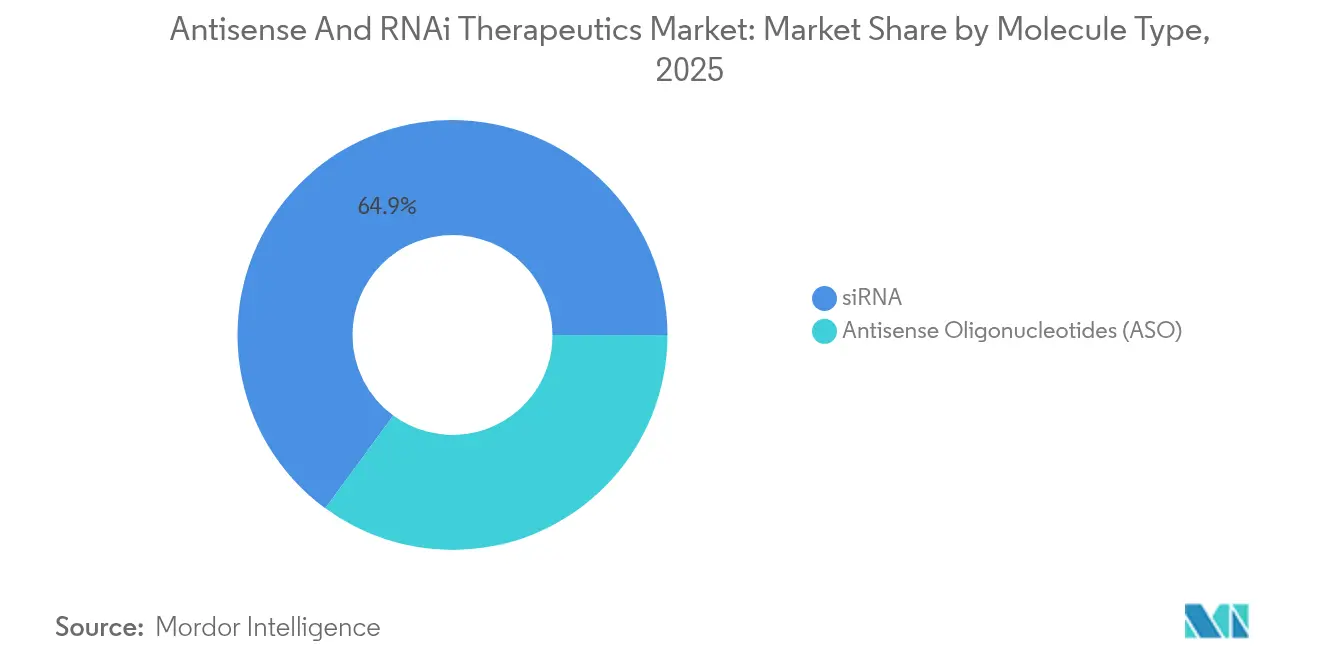
siRNA Dominance Faces ASO ChallengesiRNA held 64.92% Antisense & RNAi Therapeutics market share in 2025 due to proven hepatic knockdown efficacy, scale-ready GalNAc chemistry, and comfortable physician familiarity. Meanwhile, antisense oligonucleotides are projected to post a 20.33% CAGR, leveraging simpler synthesis, lower immunogenicity, and hard-won wins in neurological arenas where siRNA struggled to cross the blood-brain barrier. The Antisense & RNAi Therapeutics market size leadership presently rests with siRNA programs anchored in metabolic and rare liver diseases, yet platform versatility is shifting.
Clinical stakeholders now recognize that antisense programs can modulate splicing, up-regulate deficient protein production, or knock down toxic gain-of-function transcripts. FDA application trends already favor antisense in brain and muscle conditions, while siRNA still dominates liver, eye, and select oncology programs. Manufacturing economics are also tilting: antisense requires fewer purification steps, trimming per-gram costs at commercial scale. If extra-hepatic delivery for siRNA lags, antisense programs could capture incremental share in neuromuscular and cardiac pipelines.

By Route of Administration:
Intravenous Leadership Shifts Toward Intrathecal GrowthIntravenous delivery accounted for 47.12% of the Antisense & RNAi Therapeutics market size in 2025, reflecting universal hospital infusion capacity and decades-long safety familiarity. Yet intrathecal administration is poised for a 19.86% CAGR as RNA technology finally meets blood-brain-barrier challenges head-on. Single-bolus spinal injections can sustain drug exposure for months, slashing systemic dose demands and enabling treatment of central nervous system disorders previously labeled untreatable.
The Antisense & RNAi Therapeutics market is thus likely to witness declining IV share as specialized infusion suites give way to neurology centers equipped for lumbar puncture procedures. Broader adoption of subcutaneous self-injection is also materializing, benefiting chronic cardiometabolic and liver indications where homecare is viable. Regulatory momentum is supportive, with agencies issuing targeted guidances on administration-specific biodistribution and safety endpoints.
By Therapeutic Area:
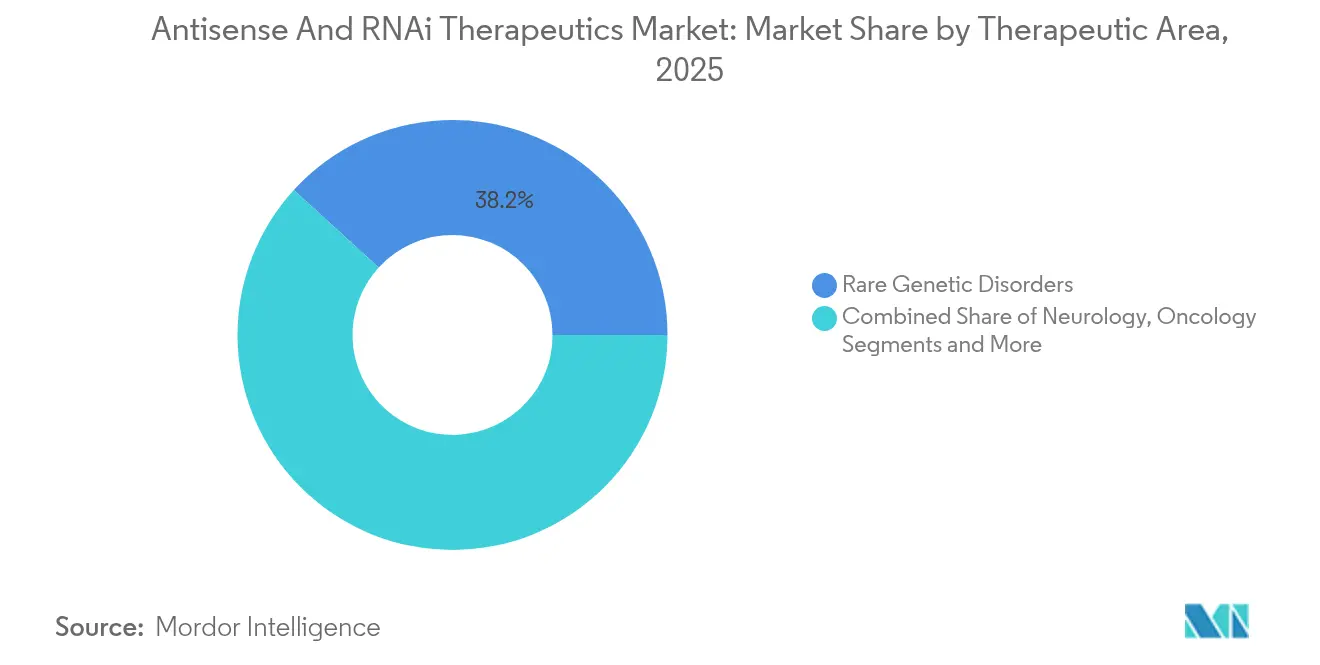
Rare Diseases Foundation Enables Broader ExpansionRare genetic disorders commanded 38.21% revenue share of the Antisense & RNAi Therapeutics market in 2025 thanks to clear mechanistic rationales, orphan-drug exclusivity, and concentrated patient-advocacy networks. Cardiometabolic programs are projected to rise fastest at 20.08% CAGR to 2031, translating platform maturity into larger, chronic-care populations. The Antisense & RNAi Therapeutics market size for cardiometabolic RNA candidates is expected to widen as payers weigh lifetime disease costs against once-quarterly or semi-annual dosing schedules.
Neurology remains the crucible for delivery innovation; positive readouts in amyotrophic lateral sclerosis and Huntington’s disease have quieted skepticism around intrathecal RNA durability. Oncology efforts integrate antibody conjugates to hone tumor selectivity while preserving healthy tissue. Together, these expansions de-risk revenue streams over the forecast horizon and insulate developers from single-indication setbacks, a resilience valued by investors.
Geography Analysis
North America Antisense and RNAi Therapeutics Market
North America held 42.58% share of the Antisense & RNAi Therapeutics market in 2025, buoyed by deep capital pools, seasoned regulatory practice, and dense clusters of oligonucleotide manufacturing. FDA breakthrough awards and orphan-drug incentives catalyze swift program progression, but payers continue to scrutinize six-digit annual therapy costs, nudging companies toward outcomes-linked contracts. Academic-industry alliances accelerate first-in-human trials, yet public opinion remains watchful regarding gene-silencing safety.
Europe Antisense and RNAi Therapeutics Market
Europe follows with a balanced stance, blending robust science with cost-effectiveness mandates. Centralized EMA approvals cut duplication, but country-by-country reimbursement dossiers add market-entry friction. Germany, France, and the United Kingdom anchor high-adoption nodes, each cultivating specialist centers that pilot first-wave launches. Brexit’s separate regulatory path forces dual submissions, though mutual reliance schemes soften logistic complexity.
APAC Antisense and RNAi Therapeutics Market
Asia-Pacific is the breakout story, paced by a 20.19% CAGR and pro-innovation reforms in Japan, South Korea, and China. Japan’s Sakigake pathway streamlines access for globally developed assets, while China’s Healthy China 2030 plan earmarks funds for homegrown RNA platforms. The region’s rapidly scaling contract-development and manufacturing organizations lower production costs and create strategic hedges against Western supply constraints, positioning Asia-Pacific as both demand center and export hub.

Regulatory Landscape
Regulatory oversight for antisense and RNAi therapeutics remains active across major markets. In the United States, the FDA finalized Clinical Pharmacology Considerations for the Development of Oligonucleotide Therapeutics in July 2024 and followed with a draft guidance on Nonclinical Safety Assessment of Oligonucleotide-Based Therapeutics in November 2024. Together, these materials reinforce the need for robust biodistribution, immunostimulation monitoring, and exposure-response characterization for chronic regimens.
In Europe, the EMA issued guidance on the development and manufacture of oligonucleotides in July 2024, with additional emphasis on quality attributes and manufacturing controls to support scale-up and commercial supply. Globally, harmonization efforts continue through the ICH S13 Expert Working Group on non-clinical safety evaluation of oligonucleotide-based therapeutics, with regulatory consultation discussions noted in June 2026. One practical friction point remains impurity control for double-stranded RNA, where no universal numeric threshold exists between the FDA and EMA. This gap pushes sponsors toward risk-based, data-driven characterization strategies that can shape analytical method development and release specifications.
Competitive Landscape
The Antisense & RNAi Therapeutics market currently demonstrates moderate concentration. Alnylam Pharmaceuticals and Ionis Pharmaceuticals converted early IP dominance into approved portfolios and global distribution alliances, yet their combined sales fall below the 80% threshold indicative of oligopoly control. Pharmaceutical majors such as Novartis, AstraZeneca, Pfizer, and Sanofi have entered via acquisitions and licensing, magnifying commercialization bandwidth. At the same time, venture-backed disruptors, including Arrowhead, Avidity, Dyne, and Intellia, exploit white-space in extra-hepatic delivery and gene-editing convergence.
Strategically, leaders are locking down critical raw-material supply, integrating end-to-end manufacturing, and diversifying pipelines to cushion single-asset risk. Mid-tier firms often punch above their weight by perfecting a single chemistry tweak or delivery vector, then out-licensing to larger peers. Patent disputes, particularly around GalNAc conjugation and lipid nanoparticle composition, create high barriers for late entrants, reinforcing the imperative to secure cross-licensing early.
Looking forward, competition will hinge less on platform novelty and more on demonstrating disease-specific superiority—longer dosing intervals, deeper knockdown, and fuller functional recovery. Companies capable of pairing RNA approaches with small-molecule or gene-editing regimens could set new standards in complex disease management, redrawing competitive lines in favor of integrated modality portfolios.
Antisense And RNAi Therapeutics Industry Leaders
-
Alnylam Pharmaceuticals, Inc.
-
Biogen Inc.
-
Ionis Pharmaceuticals (Akcea Therapeutics, Inc.)
-
Sarepta Therapeutics, Inc.
-
Novartis AG
- *Disclaimer: Major Players sorted in no particular order
Antisense And RNAi Therapeutics Market Companies Covered in this Report
- Alnylam Pharmaceuticals
- Ionis Pharmaceuticals
- Novartis
- Biogen
- Sarepta Therapeutics
- Arrowhead Pharmaceuticals
- Silence Therapeutics
- AstraZeneca
- Pfizer
- Sanofi
- Dicerna (Novo Nordisk)
- Intellia Therapeutics
- Avidity Biosciences
- Dyne Therapeutics
- OliX Pharmaceuticals
- Sirnaomics
- Arbutus Biopharma
- Benitec Biopharma
- Isarna Therapeutics
- Gene Signal International
Market Opportunities and Future Outlook
RNA-based precision medicines are expanding beyond ultra-rare monogenic targets into broader neurology and cardiometabolic populations, while the rare-disease engine continues to anchor demand in the category. The AMVUTTRA (vutrisiran) FDA approval for ATTR-CM on March 20, 2025 highlights physician comfort with RNAi in chronic, specialty-managed settings and supports broader diagnosis pathways and specialist-center networks.
GalNAc-siRNA conjugates also support subcutaneous dosing, reducing reliance on complex cold-chain and infusion logistics as access priorities become more prominent. In ultra-rare conditions, the FDA issued a draft Plausible Mechanism Framework in February 2026 to accelerate individualized therapies for ultra-rare diseases using mechanistic rationale, which antisense and RNA-based platforms can leverage when the mechanism is well supported. Oligonucleotide CDMOs are increasingly adopting vertically integrated models that combine raw material synthesis and GMP manufacturing to strengthen scalability and quality control. Asia-Pacific manufacturing expansion further supports global supply resilience, while Canada, Europe, and the United States continue to scale specialized delivery and center-network deployment.
Recent Industry Developments in Antisense And RNAi Therapeutics Market
- June 2026: Ionis Pharmaceuticals entered a license agreement with Recordati for exclusive rights to zilganersen for Alexander disease outside the U.S.; upfront payment reported at $30 million. The deal expands access for an antisense asset and supports global commercialization beyond the United States.
- June 2026: Alnylam Pharmaceuticals formed a strategic AI collaboration with Inceptive Nucleics to accelerate RNAi therapeutics discovery using generative AI, valued up to $2 billion. The collaboration accelerates discovery timelines and strengthens RNAi platform competitiveness.
- June 2026: Alnylam Pharmaceuticals - Formed a strategic AI collaboration with Inceptive Nucleics, Inc., valued at up to $2 billion, to accelerate the discovery of RNAi therapeutics using generative AI models. The arrangement broadens Alnylams AI powered research capabilities and reinforces its leadership in RNAi based drug discovery.
Antisense And RNAi Therapeutics Market Report Scope and Research Methodology
Market Definition and Coverage
For this study, the market covers revenues from approved and marketed antisense oligonucleotide and siRNA based therapeutics, counted at the ex-manufacturer level and summed across major regions in USD.
Scope exclusions: We exclude discovery tools, research reagents, and routine lab RNAi kits that are not sold as therapeutic drugs.
Segments Covered in This Report
- By Molecule Type
- siRNA
- Antisense Oligonucleotides (ASO)
- By Route of Administration
- Intravenous
- Sub-cutaneous
- Intrathecal
- Others
- By Therapeutic Area
- Rare Genetic Disorders
- Neurology
- Oncology
- Cardiometabolic
- Infectious Diseases
- Ocular Diseases
- Others
- By Geography
- North America
- United States
- Canada
- Mexico
- Europe
- Germany
- United Kingdom
- France
- Italy
- Spain
- Rest of Europe
- Asia-Pacific
- China
- Japan
- India
- Australia
- South Korea
- Rest of Asia-Pacific
- Middle East and Africa
- GCC
- South Africa
- Rest of Middle East and Africa
- South America
- Brazil
- Argentina
- Rest of South America
- North America
Data Sources, Market Sizing, and Validation
Desk Research
Desk work starts with mapping the approved product universe and active clinical programs, then tying each to patient populations and treatment pathways in the main indications. To keep the model grounded, we lean on public sources such as US FDA drug labels and approvals database, clinical trial registries such as ClinicalTrials.gov, World Health Organization health statistics, and disease specific epidemiology in peer reviewed journals.
We also review country level pricing and reimbursement notes when available in public payer documents, along with annual reports and investor presentations that discuss therapy revenue drivers and launches. For cross checks, we use paid subscriptions focused on company financials and intelligence, and patent database access to understand delivery chemistry trends and timing. The desk sources listed above are illustrative, and many other public documents and datasets were also reviewed for data collection and validation.
Primary Interviews and Surveys
Primary work is used to pressure test assumptions that usually swing the totals, including how quickly eligible patients are diagnosed, how prescribing shifts after label expansions, and how payers respond to therapy durability and safety. We speak with a mix of drug developers, CDMOs, specialty distributors, clinicians, and subject matter experts across APAC, EMEA, and the Americas so gaps from desk research can be filled with practical inputs. Feedback is then used to confirm the adoption curve, adjust pricing corridors, and sanity check indication level uptake before finalizing the model.
Distribution of primary research fieldwork respondents
| Company type | Respondent position | Region |
|---|---|---|
| Top tier: 33% | CXOs: 13% | APAC: 37% |
| Mid tier: 50% | Functional/Unit leaders: 35% | EMEA: 36% |
| Smaller Players: 17% | Managers: 52% | Americas: 27% |
Market-Sizing & Forecasting
Sizing is built from a demand pool view where epidemiology and treated population logic are used to reconstruct likely therapy volumes by indication, then translated into value using representative net price ranges. Once the indication level totals are built, they are rolled up by region and reconciled with a top-down view anchored on publicly visible therapy revenues and launch timing.
To keep the model realistic, we track a few inputs closely, such as diagnosed and eligible patient counts in target diseases, dosing frequency and average annual therapy cost, route of administration mix (intravenous, subcutaneous, and intrathecal), persistence and discontinuation patterns, and the pace of label expansions in neurology, rare genetic disorders, cardiometabolic disease, and oncology. Where bottom-up detail is thin for smaller geographies, gap handling is done using proxy adoption rates from similar health systems, followed by price normalization and a second pass with experts.
Forecasts are generated using scenario analysis, where base, faster access, and slower access cases are built from launch calendars, expected competition, and payer tightening assumptions. The final curve is selected after expert consensus is checked against observed approval cadence and the practical limits of diagnosis and infusion capacity.
Data Validation & Update Cycle
Validation is done through stepwise cross checks that compare model outputs with independent signals, such as reported product revenues, patient assistance enrollment indicators, and broad rare disease treatment rates. When a number looks out of line, the driver is traced back to a specific input, and then the assumption is rechecked with follow-up outreach or refreshed desk evidence.
Before sign-off, the dataset and calculations go through multi step analyst review so unit logic, currency timing, and regional roll ups are consistent. Reports are refreshed annually, and interim updates are triggered when material events occur, such as major approvals, safety actions, or meaningful pricing changes. Right before delivery, an analyst performs a fresh pass so the final view reflects the latest public disclosures.
Mordor Intelligence's Antisense and Rnai Therapeutics Market Estimate Compared With Other Published Estimates
Published market values for this space can look far apart because firms pick different starting years, handle pricing and rebates differently, and make their own calls on how to count pipeline and adjacent RNA products. Geography coverage and whether hospital administered therapies are captured at list price or net price also tends to create visible spreads.
The main gap comes from whether early stage RNA programs and non-therapeutic RNA applications are blended into the total, where Mordor Intelligence counts only marketed antisense and siRNA therapeutics and then builds value from treated patients, dosing, and net price logic rather than broader RNA spending proxies.
Benchmark comparison
| Source | Market Size | Gaps in Research Methodology |
|---|---|---|
| Mordor Intelligence | USD 5.66 B (2026) | |
| Industry Research Publisher A | USD 5.40 B (2024) | Uses an earlier base year and mixes a wider technology and application lens, which can pull in adjacent RNA categories and smooth out near term launch and access effects. |
| Advisory Firm B | USD 5.20 B (2024) | Relies more on headline market totals and aggressive uptake in the first years after approvals, and the pricing approach is less explicit on netting for discounts and reimbursement friction. |
Overall, the spread is mainly explained by scope tightness, base year choice, and how pricing progression is treated as access expands. By tying the market to eligible patients, therapy duration, and realistic price corridors, the estimate stays traceable to clear drivers that can be rechecked as new approvals and labels come through.
Key Questions Answered in the Report
How fast is the Antisense & RNAi Therapeutics market projected to grow through 2031?
The market is forecast to expand from USD 5.66 billion in 2026 to USD 13.08 billion in 2031, translating into an 18.22% CAGR.
Which region is set to record the highest growth?
Asia-Pacific leads with a 20.19% CAGR, propelled by regulatory reforms, manufacturing expansion, and rising patient access.
Which segment holds the largest Antisense & RNAi Therapeutics market share by molecule type?
SiRNA dominates with a 64.92% share in 2025, underpinned by mature hepatic delivery technology.
What drives the shift toward intrathecal administration?
Superior central nervous system penetration and sustained drug exposure are lifting intrathecal delivery, forecast to grow at 19.86% CAGR.
Why are cardiometabolic indications gaining momentum?
Platform maturation now supports larger chronic populations, and cardiometabolic programs are forecast to grow at 20.08% CAGR on validated lipid-management targets.
Which companies lead RNA therapy commercialization?
Alnylam and Ionis remain front-runners, but Novartis, Pfizer, and emerging specialists such as Arrowhead and Dyne are expanding rapidly through acquisitions and partnerships.