Anatomic Pathology Market Size and Share
Market Overview
| Study Period | 2020 - 2031 |
|---|---|
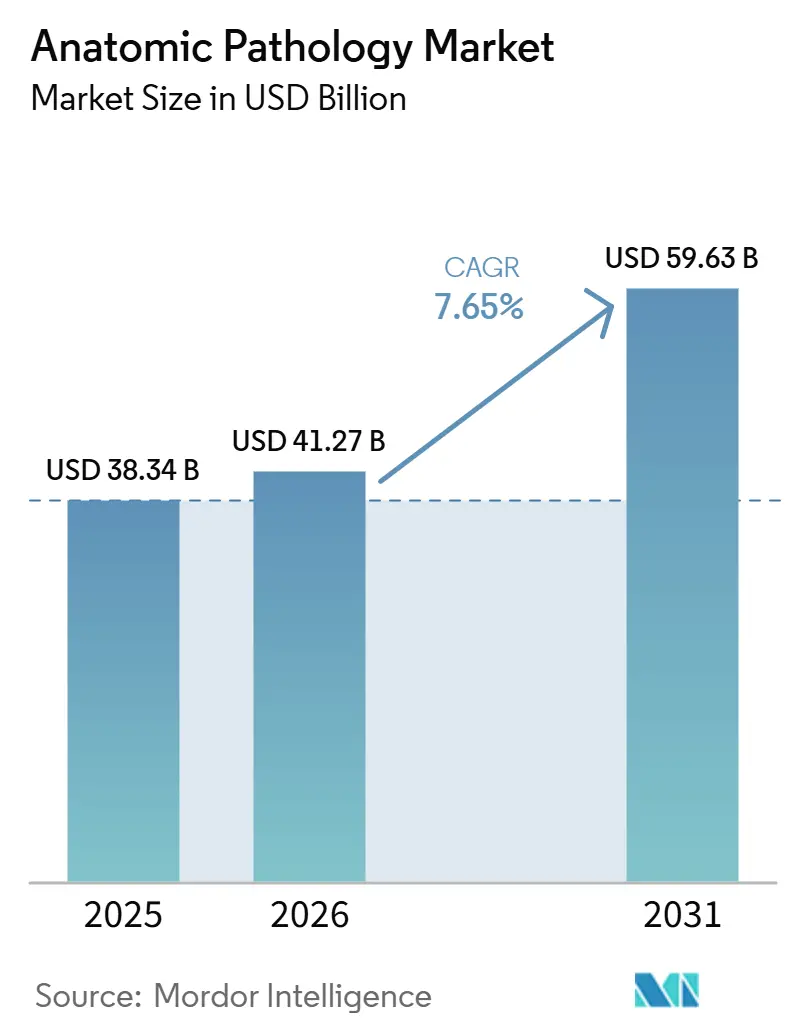
| Market Size (2026) | USD 41.27 Billion |
| Market Size (2031) | USD 59.63 Billion |
| Growth Rate (2026 - 2031) | 7.65% CAGR |
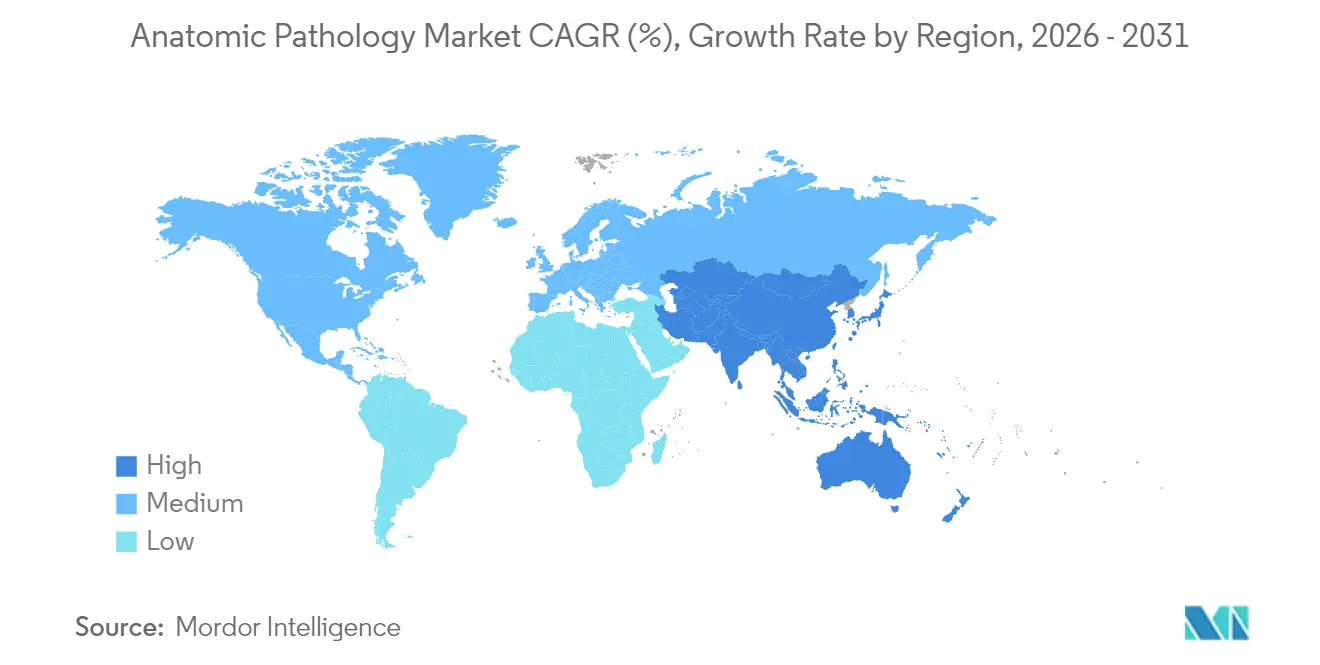
| Fastest Growing Market | Asia Pacific |
| Largest Market | North America |
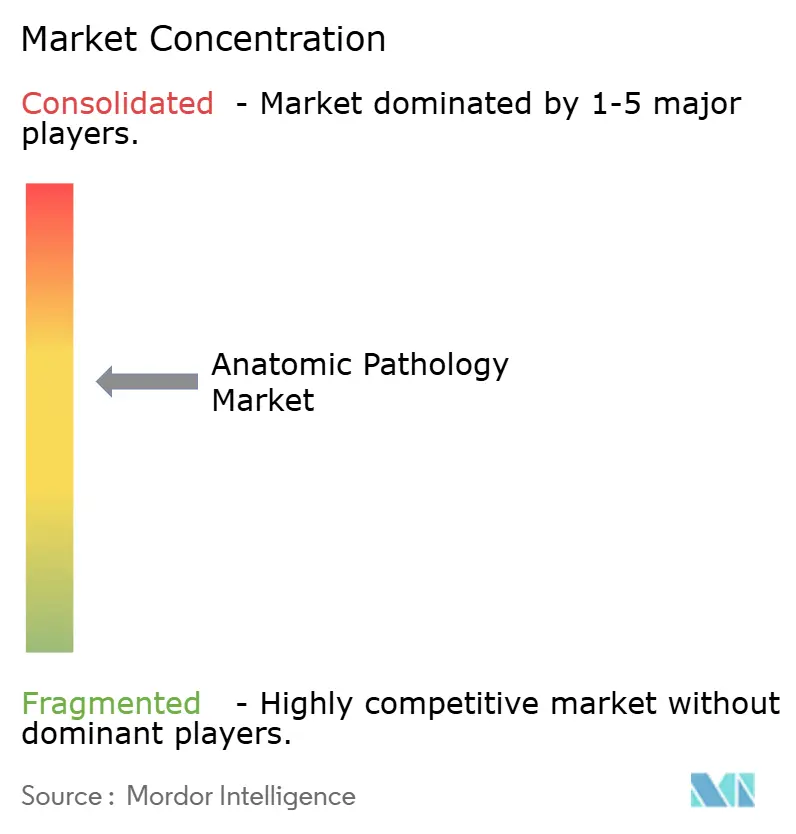
| Market Concentration | Medium |
Major Players *Disclaimer: Major Players sorted in no particular order Image © Mordor Intelligence. Reuse requires attribution under CC BY 4.0. | |
Anatomic Pathology Market Analysis by Mordor Intelligence
The Anatomic Pathology Market size is expected to grow from USD 38.34 billion in 2025 to USD 41.27 billion in 2026 and is forecast to reach USD 59.63 billion by 2031 at 7.65% CAGR over 2026-2031.
Rising cancer incidence, continued technology upgrades, and wider precision medicine use sustain high test volumes and steady capital spending. Hospitals expand tissue-based diagnostics to support oncology programs while pharmaceutical companies embed companion diagnostics into late-stage trials, creating new revenue layers. Digital slide scanners, laboratory automation, and artificial intelligence cut turnaround time and partially offset staff shortages. Regulatory agencies strengthen quality expectations yet also accelerate clearances for digital pathology, encouraging faster adoption[1]World Health Organization, “Cancer burden rising,” who.int.
Key Report Takeaways
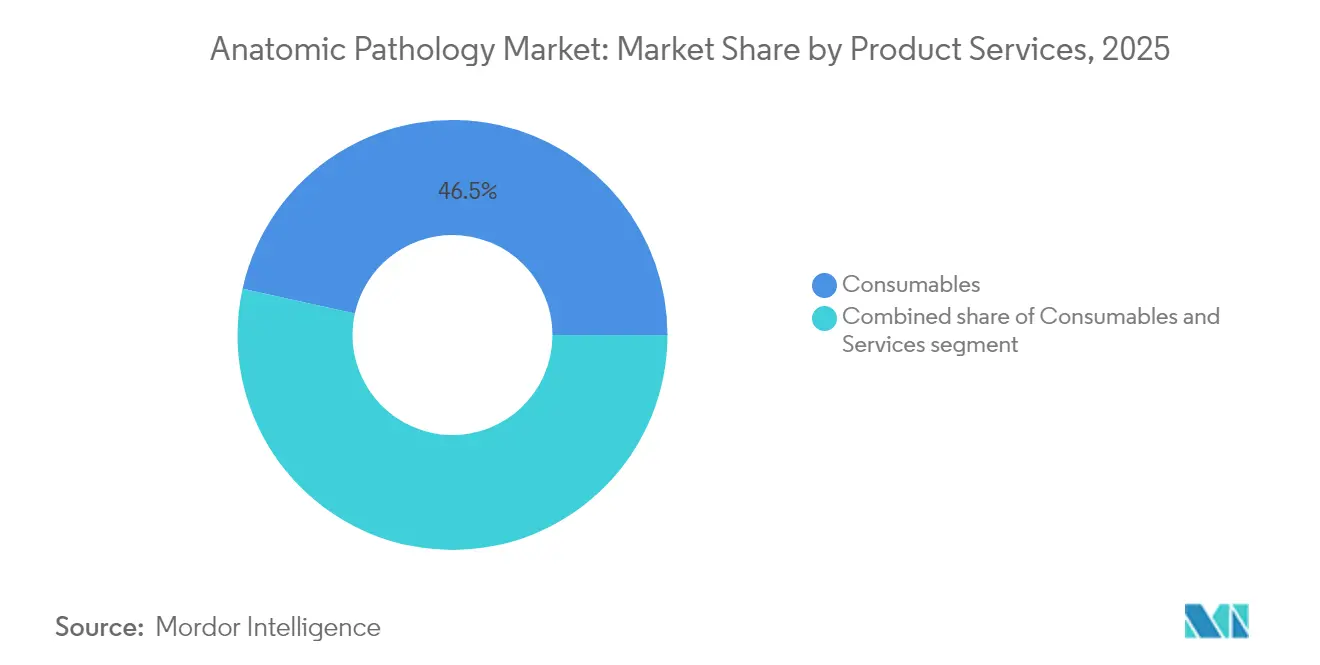
- By product category, consumables led with 46.54% revenue share in 2025; services are forecast to expand at a 10.25% CAGR to 2031.
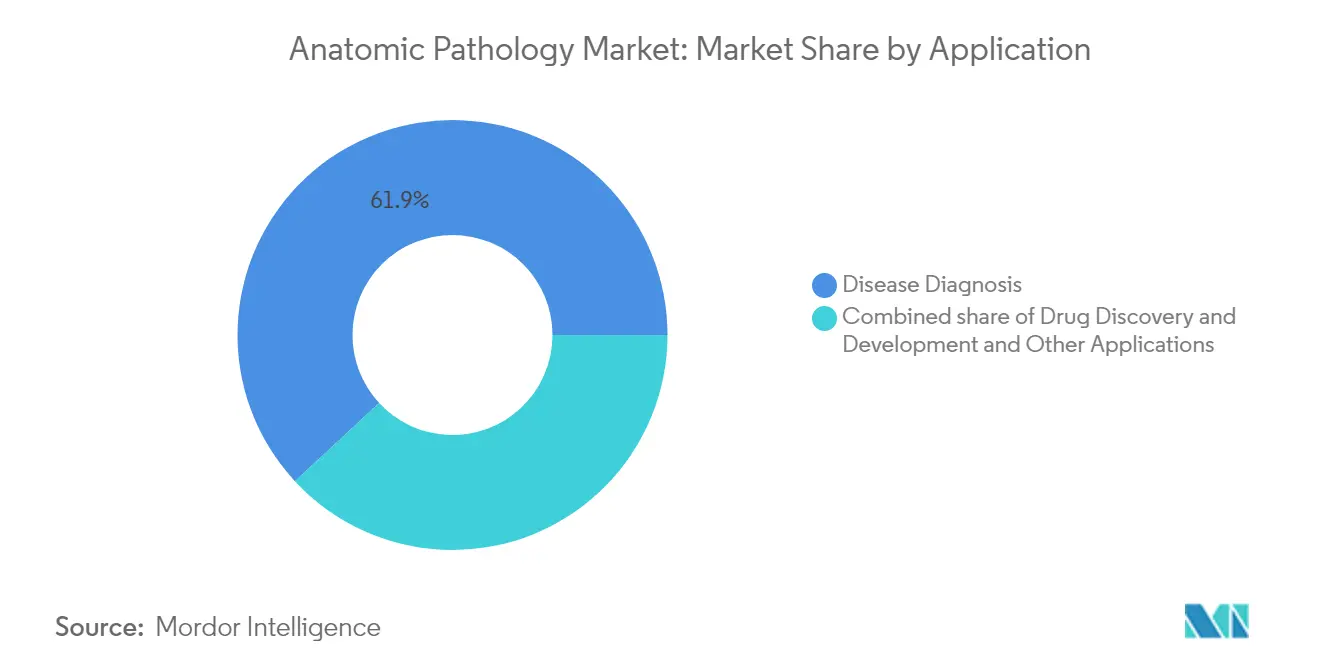
- By application, disease diagnosis accounted for 61.90% of the anatomic pathology market share in 2025 while drug discovery and development is advancing at an 11.55% CAGR through 2031.
- By end user, hospital settings held 42.83% of demand in 2025 and diagnostic laboratories record the highest projected CAGR at 11.12% to 2031.
- By geography, North America captured 41.12% revenue share in 2025; Asia-Pacific is the fastest growing region at a 9.31% CAGR through 2031.
Note: Market size and forecast figures in this report are generated using Mordor Intelligence’s proprietary estimation framework, updated with the latest available data and insights as of 2026.
Global Anatomic Pathology Market Trends and Insights
Driver Impact Analysis*
| Driver | % Impact on CAGR Forecast | Geographic Relevance | Impact Timeline |
|---|---|---|---|
| Rising burden of cancer and chronic diseases | +2.1% | Global; highest in North America & Europe | Long term (≥ 4 years) |
| Growing adoption of precision and personalized medicine | +1.8% | North America & Europe leading; Asia-Pacific accelerating | Medium term (2-4 years) |
| Continuous technological advancements in pathology instruments and automation | +1.5% | Global; concentrated in developed markets | Medium term (2-4 years) |
| Increasing integration of digital pathology and artificial intelligence | +1.3% | North America & Europe core; spill-over to Asia-Pacific | Short term (≤ 2 years) |
| Expansion of molecular and spatial omics in routine histopathology | +0.9% | North America & Europe; selective Asia-Pacific adoption | Long term (≥ 4 years) |
| Emergence of telepathology networks in resource-limited settings | +0.6% | Asia-Pacific, Middle East & Africa, Latin America | Medium term (2-4 years) |
| Source: Mordor Intelligence | |||
Rising Burden of Cancer and Chronic Diseases
Global cancer cases reached 20 million in 2022, with lung cancer alone contributing 2.5 million diagnoses. The American Cancer Society forecasts more than 2 million new US diagnoses and 618,000 deaths in 2025, keeping specimen volumes on an upward curve[2]American Cancer Society, “Cancer Facts & Figures 2025,” cancer.org. Aging populations in developed economies and lifestyle shifts in emerging regions add parallel growth, while screening programs highlight the economic payoff of early detection. These trends drive sustained demand across histology, cytology, and molecular sub-specialties, cementing the anatomic pathology market as an indispensable pillar of oncology care.
Growing Adoption of Precision and Personalized Medicine
Companion diagnostics now sit at the core of many oncology drug launches. In April 2025, Roche received breakthrough device designation for its AI-enabled TROP2 test that guides treatment of non-small-cell lung cancer and unites immunohistochemistry with digital algorithms. The Human Proteome Project confirms identification of 93% of predicted human proteins, broadening the biomarker pool for future assays. Liquid biopsy platforms, including circulating DNA fragmentomics, add non-invasive options with detection limits below 0.32 copies/µL for HPV-driven cancers. Laboratories therefore invest in multiplex staining, next-generation sequencing, and image analysis software to secure this medicine-first revenue stream.
Continuous Technological Advancements in Pathology Instruments and Automation
Vacancy rates hover at 10.5% in US anatomic pathology departments while technologist shortages span 20,000-25,000 roles, pushing laboratories to automate slide preparation, staining, and coverslipping. Cytogenetics labs report lower variability and higher throughput once automated harvesters and FISH systems are installed. Thermo Fisher Scientific deepened its automation portfolio by agreeing to acquire Solventum’s purification and filtration unit for USD 4.1 billion in February 2025, expecting USD 125 million operating income by year five.
Increasing Integration of Digital Pathology and Artificial Intelligence
The FDA cleared multiple whole-slide imaging systems in 2024-2025, including Epredia’s digital platform and Roche’s high-volume scanner, clearing regulatory clouds for primary diagnosis. AI tools such as Ibex Prostate Detect achieved 99.6% positive predictive value and flagged 13% of cancers missed by manual review. Foundational models like UNI use millions of annotated images to refine classification, supporting broader pathology tasks beyond oncology. Adoption remains at 5-10% but could approach 90% once reimbursement and remote workflows converge to cover workforce gaps.
Restraints Impact Analysis*
| Restraints Impact Analysis | (~) % Impact on CAGR Forecast | Geographic Relevance | Impact Timeline |
|---|---|---|---|
| Stringent regulatory and accreditation requirements | -1.2% | Global; most restrictive in North America & Europe | Medium term (2-4 years) |
| Shortage of skilled pathologists and histotechnologists | -0.9% | Global; acute in North America & Europe | Long term (≥ 4 years) |
| High capital and operating costs of advanced systems | -0.7% | Asia-Pacific & other emerging markets | Short term (≤ 2 years) |
| Lack of standardized data formats and interoperability | -0.4% | Global; affecting digital pathology adoption | Medium term (2-4 years) |
| Source: Mordor Intelligence | |||
Stringent Regulatory and Accreditation Requirements
The FDA final rule on laboratory-developed tests, effective July 2024, ends decades of enforcement discretion and forces thousands of assays into the medical-device pathway with design control, adverse event reporting, and premarket review obligations[3]Federal Register, “Laboratory Developed Tests: Final Rule,” federalregister.gov. Quality System Regulation revisions harmonize with ISO 13485, requiring broad documentation updates and audits. In Europe, digital pathology guidance from professional societies demands standardized validation and sustainability, adding compliance expense while improving cross-border consistency. US payers simultaneously narrow networks and reduce reimbursement, compounding pressure on smaller labs.
Shortage of Skilled Pathologists and Histotechnologists
Globally there are 14 pathologists per million people, but Africa counts fewer than 3 per million, highlighting stark regional gaps. US vacancy rates rest at 10.5% with a similar 10% retirement expectation, while California projects clinical laboratory scientist vacancies rising toward 19%. Broader healthcare attrition could remove 47% of laboratory staff by 2025, affecting the 14 billion tests that shape two-thirds of medical decisions. Limited exposure during medical education further constrains pipelines, prompting calls for curriculum reform.
*Our forecasts treat driver/restraint impacts as directional, not additive. The impact forecasts reflect baseline growth, mix effects, and variable interactions.
Segment Analysis
By Product & Services: Consumables Drive Recurring Revenue Models
Consumables held 46.54% revenue in 2025 because every tissue block requires reagents, stains, and slides. Rising test complexity boosts premium antibody and molecular kit demand, supporting steady incremental growth. Services post the fastest 10.25% CAGR to 2031 as outsourcing gains traction and specialized molecular assays exceed in-house bandwidth. Instruments move in step with lab expansions, with digital scanners and automated stainers mitigating staff gaps and lifting standardization. Quest Diagnostics notes that upfront digital readouts prevent diagnostic delay and improve inter-pathologist collaboration, highlighting efficiency gains.
The anatomic pathology market size for consumables is projected to reach USD 27.59 billion in 2031, equal to 46.27% of total value. In contrast, services are anticipated to account for 34.20% of the anatomic pathology market size at the end of the forecast horizon due to sustained double-digit growth. Consumable suppliers therefore pursue reagent-lease models, guaranteeing recurring revenue while easing customer capital strain.


By Application: Disease Diagnosis Dominance Amid Drug Development Acceleration
Disease diagnosis accounted for 61.90% of 2025 revenue because every surgical or biopsy specimen needs confirmation before treatment. Cancer remains the largest driver as guidelines urge molecular stratification for targeted therapy. Drug discovery and development is set to expand at an 11.55% CAGR as pharmaceutical pipelines depend on tissue biomarker validation and histopathology-driven safety studies.
The segment commanded 49.60% share of the anatomic pathology market size for immunohistochemistry kits in 2025, reflecting oncology’s testing intensity. Drug development activities will likely raise their share by 2031 as spatial omics and multiplex imaging migrate from research to regulated use. Laboratories therefore realign capital toward high-plex instruments and digital storage to comply with protocol requirements.
By End User: Hospital Infrastructure Meets Laboratory Specialization
Hospitals generated 42.83% of 2025 demand due to embedded pathology units that support inpatient surgery and oncology boards. Yet diagnostic laboratories outpace other settings with an 11.12% CAGR through 2031, aided by scale, automation, and cross-regional logistics. Reference labs secure large vaccine or companion diagnostic contracts, while academic centers lead translational research and rare disease expertise.
Hospital budgets increasingly favour outsourcing of molecular testing when case volume does not justify platform ownership. Diagnostic labs thus extend courier networks and remote sign-out portals, giving clinicians next-day answers and maintaining the anatomic pathology market share trend toward specialized providers. Workforce shortages accelerate this shift, especially in rural or tier-3 cities where lab technologist supply is thin.
Geography Analysis
North America commanded 41.12% revenue in 2025 owing to high cancer screening rates, established reimbursement, and early digital adoption. US healthcare spending surpasses USD 4 trillion, and pathology influences two-thirds of clinical decisions, solidifying service demand. Workforce programs from the American Society for Clinical Pathology focus on scholarship funding and reimbursement advocacy, though vacancies remain in double digits.
Asia-Pacific delivers the fastest 9.31% CAGR through 2031. China’s healthcare outlays reached 8.53 trillion yuan in 2022 and may pass 20 trillion yuan by 2030, boosting laboratory build-outs across provincial centers. Japan embeds AI imaging within routine pathology workflows to cut manual fatigue, and India’s diagnostic chains expand into tier-4 towns to capture preventive testing demand. Telepathology pilots link remote hospitals to central labs, improving access without duplicating infrastructure.
Europe shows steady uptake as digital slide standards and quality frameworks gain momentum under the European Society of Pathology. Only 3% of UK departments report full staffing, creating urgency for automated coverslippers and AI triage tools. Middle East & Africa and South America lag on large instrument investment, yet mobile slide scanners and cloud portals are spreading, enabling gradual participation in the anatomic pathology market.

Competitive Landscape
The sector is moderately consolidated. Roche, Danaher’s Leica Biosystems, and Thermo Fisher Scientific package instruments, reagents, and software into closed ecosystems that lock in consumable pull-through. Danaher posted USD 23.9 billion 2023 revenue with sizeable diagnostics exposure and is co-developing smart microscopy with Stanford for automated cell classification. Thermo Fisher’s USD 4.1 billion Solventum acquisition bolsters filtration and bio-production segments, while its USD 3.1 billion Olink deal broadens proteomics, creating synergy with tissue assays.
Emerging firms centre on cloud-native slide management and AI. Ibex Medical Analytics earned FDA clearance for prostate cancer algorithms that outperform manual review on small glandular foci. Microsoft’s GigaPath applies large-language techniques to gigapixel images, hinting at cross-discipline expansion. Investment flows into software over hardware, although integrated vendors quickly partner to fold algorithms into scanner ecosystems, as seen in Leica’s funding of Indica Labs for a combined Aperio-HALO AP solution.
Laboratories also consolidate. Quest Diagnostics and Sonic Healthcare add specialty hubs, aiming to dominate high-complexity testing while local hospital labs retain rapid histology. Automation suppliers use reagent bundling and managed services to protect margins in a price-sensitive climate.
Anatomic Pathology Industry Leaders
Thermo Fisher Scientific Inc.
Quest Diagnostics Incorporated
F. Hoffmann-La Roche Ltd.
Laboratory Corporation of America Holdings
Agilent Technologies, Inc.
- *Disclaimer: Major Players sorted in no particular order

Recent Industry Developments
- June 2025: Thermo Fisher Scientific disclosed plans to divest parts of its diagnostics unit for about USD 4 billion, signalling portfolio realignment.
- May 2025: Roche launched the Elecsys PRO-C3 test that delivers liver fibrosis status within 18 minutes, reducing the need for invasive biopsies.
- April 2025: Roche obtained FDA breakthrough device designation for the Ventana TROP2 RxDx Device, the first AI-driven companion diagnostic in lung cancer.
- March 2025: The FDA cleared Epredia’s digital pathology solution for primary diagnosis of surgical pathology slides.
- February 2025: Thermo Fisher Scientific agreed to acquire Solventum’s Purification & Filtration business for USD 4.1 billion, targeting USD 125 million adjusted operating income by year five.


Research Methodology Framework and Report Scope
Market Definitions and Key Coverage
Our study defines the anatomic pathology market as the worldwide revenue earned from instruments (microtomes, tissue processors, cryostats, automatic stainers, whole-slide scanners), consumables (reagents, antibodies, probes, kits), and professional services used to examine human tissues and cells for diagnosis, research, and drug development.
For clarity, we exclude veterinary pathology workflows and stand-alone clinical chemistry testing from our scope.
Segmentation Overview
- By Product & Services
- Instruments
- Consumables
- Services
- By Application
- Disease Diagnosis
- Cancer
- Infectious Diseases
- Other Conditions
- Drug Discovery & Development
- Pre-Clinical Toxicology
- Companion Diagnostics
- Biomarker Validation
- Other Applications
- Disease Diagnosis
- By End User
- Hospitals
- Diagnostic Laboratories
- Research Laboratories
- Other End Users
- Geography
- North America
- United States
- Canada
- Mexico
- Europe
- Germany
- United Kingdom
- France
- Italy
- Spain
- Rest of Europe
- Asia-Pacific
- China
- Japan
- India
- Australia
- South Korea
- Rest of Asia-Pacific
- Middle East & Africa
- GCC
- South Africa
- Rest of Middle East & Africa
- South America
- Brazil
- Argentina
- Rest of South America
- North America
Detailed Research Methodology and Data Validation
Primary Research
We speak with pathologists, lab managers, reagent distributors, and digital-scanner suppliers across North America, Europe, Asia-Pacific, and selected emerging markets. Their feedback refines typical slide throughput, reagent consumption patterns, and scanner price points, helping us confirm and, when needed, adjust assumptions drawn from secondary evidence.
Desk Research
We first map the laboratory and manufacturer universe through open sources such as the WHO-IARC cancer registry, SEER incidence files, Eurostat healthcare spending tables, and UN Comtrade codes for histology equipment. We then enrich those baselines with practice guidelines from the College of American Pathologists, peer-reviewed journals, and procurement notices captured on Volza. Company 10-Ks, hospital tenders visible in Dow Jones Factiva, and financial snapshots in D&B Hoovers let us cross-check unit shipments, price drifts, and new site openings. Our team layers these findings to establish prevalence trends, installed-base shifts, and trade flows that anchor the initial model. The sources listed are illustrative; many additional references supported validation.
Market-Sizing & Forecasting
We apply a top-down build that starts with cancer incidence, biopsy volumes, and autopsy rates, which are then converted into slide counts and spend per slide to size annual demand pools. Supplier roll-ups, channel checks, and sampled ASP × volume provide bottom-up sense checks that close gaps where trade data are limited. Key variables like biopsy growth, reagent price shifts, scanner penetration, reimbursement revisions, and digital adoption feed a multivariate regression that projects revenue through 2030. Where country data are sparse, ratios from demographically similar nations are imputed and subsequently confirmed during expert callbacks.
Data Validation & Update Cycle
We run anomaly checks, variance thresholds, and multi-level analyst reviews before sign-off. Models refresh each year, with interim updates when material events such as landmark FDA clearances occur. A final sweep just before publication ensures clients receive the latest view.
Why Mordor's Anatomic Pathology Baseline Commands Reliability
Published estimates differ because providers select varied product baskets, geographic splits, model cadences, and cancer-prevalence assumptions. Our disciplined scoping, yearly refresh, and dual-track validation give decision-makers a balanced midpoint they can rely on.
Key gap drivers seen in other studies include narrower product coverage that excludes scanner hardware, reliance on vendor revenue extrapolations without lab-throughput checks, and currency conversions that ignore inflation.
Benchmark comparison
| Market Size | Anonymized source | Primary gap driver |
|---|---|---|
| USD 38.34 B (2025) | Mordor Intelligence | - |
| USD 32.9 B (2024) | Global Consultancy A | Excludes scanners; uses 2023 trade data; biennial refresh |
| USD 35.5 B (2024) | Industry Analysis Firm B | Vendor revenue roll-up; limited emerging-market labs; static FX baseline |
These comparisons show how Mordor Intelligence fuses broad scope, annual updates, and transparent variables to deliver a dependable baseline that is traceable and repeatable for strategic planning.


Key Questions Answered in the Report
What is the current size of the anatomic pathology market?
The market stands at USD 41.27 billion in 2026 and is forecast to reach USD 59.63 billion by 2031.
Which product group holds the largest anatomic pathology market share?
Consumables lead with 46.54% revenue share in 2025 due to their recurring demand in every tissue-based test.
Why is Asia-Pacific the fastest growing region?
Growing healthcare expenditure, rising cancer incidence, and investment in digital laboratories are producing a 9.31% CAGR through 2031.
How are workforce shortages shaping technology adoption?
Vacancy rates above 10% are prompting laboratories to install automation, digital scanners, and AI to maintain throughput and diagnostic accuracy.
What role do companion diagnostics play in market growth?
Pharmaceutical reliance on biomarker-guided trials and targeted therapies is driving an 11.55% CAGR in the drug discovery and development segment.
Which recent FDA actions have accelerated digital pathology use?
Clearances for Epredia’s whole-slide system and Ibex Prostate Detect AI in 2025 provide regulatory confidence for primary digital diagnosis.
Page last updated on:


