Market Overview
| Study Period | 2020 - 2030 |
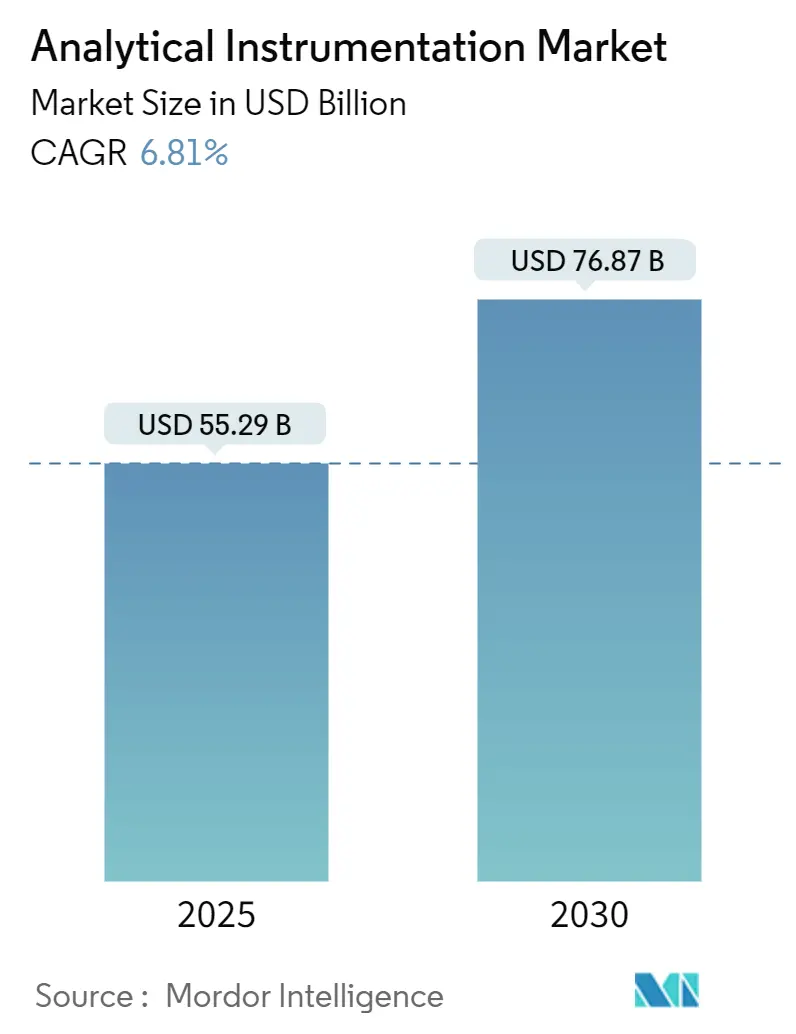
| Market Size (2025) | USD 55.29 Billion |
| Market Size (2030) | USD 76.87 Billion |
| Growth Rate (2025 - 2030) | 6.81% CAGR |
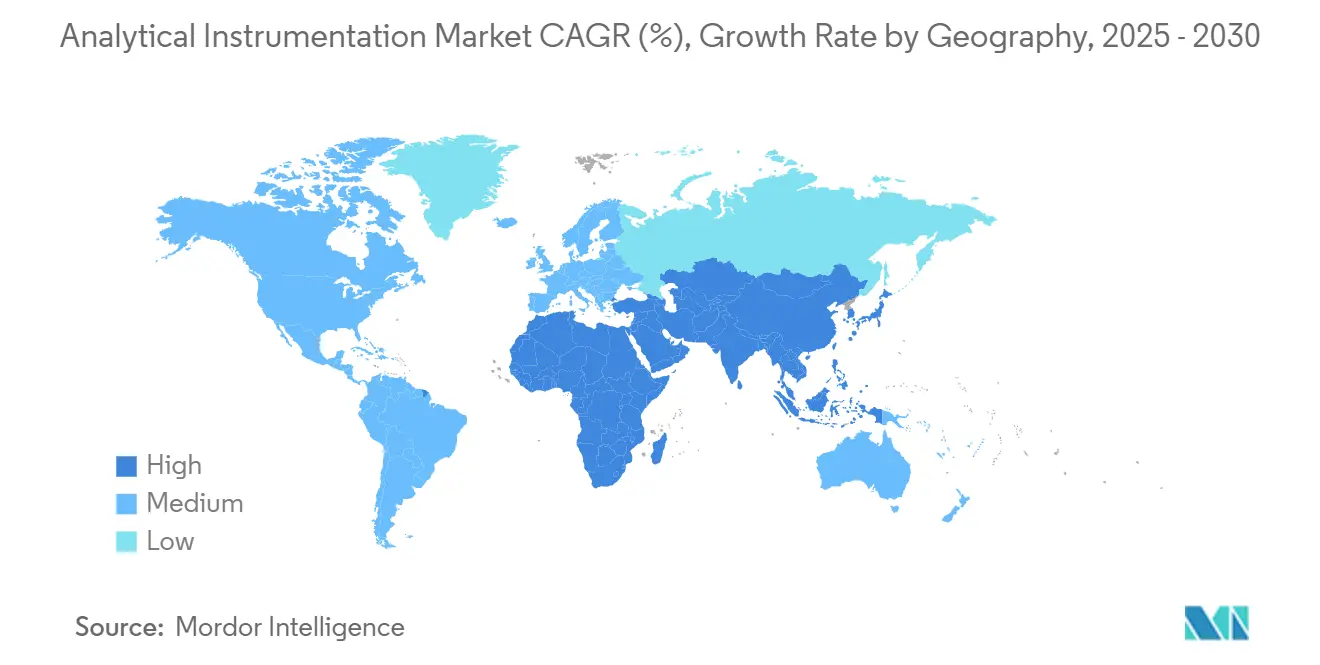
| Fastest Growing Market | Asia Pacific |
| Largest Market | North America |
| Market Concentration | Medium |
Major Players*Disclaimer: Major Players sorted in no particular order Image © Mordor Intelligence. Reuse requires attribution under CC BY 4.0. |
|
Analytical Instrumentation Market Analysis by Mordor Intelligence
The analytical instrumentation market is valued at USD 55.29 billion in 2025 and is projected to reach USD 76.87 billion by 2030, reflecting a 6.81% CAGR and signaling robust expansion in high-precision measurement tools. Increasing regulatory oversight in pharmaceuticals and environmental monitoring, rapid semiconductor node shrinkage below 3 nm, and the convergence of artificial intelligence with laboratory hardware are boosting adoption across every major end-user group. Vendors are intensifying investments in real-time release testing solutions for continuous pharmaceutical manufacturing, ultra-trace spectrometry platforms for PFAS control, and multi-omics mass spectrometry to support biologics pipelines. Simultaneously, helium supply volatility is reshaping gas chromatography workflows, while persistent talent shortages in analytical chemistry elevate outsourcing costs and nudge buyers toward automation. Together, these forces are sustaining pricing power and fueling incremental upgrades in the analytical instrumentation market.
Key Report Takeaways
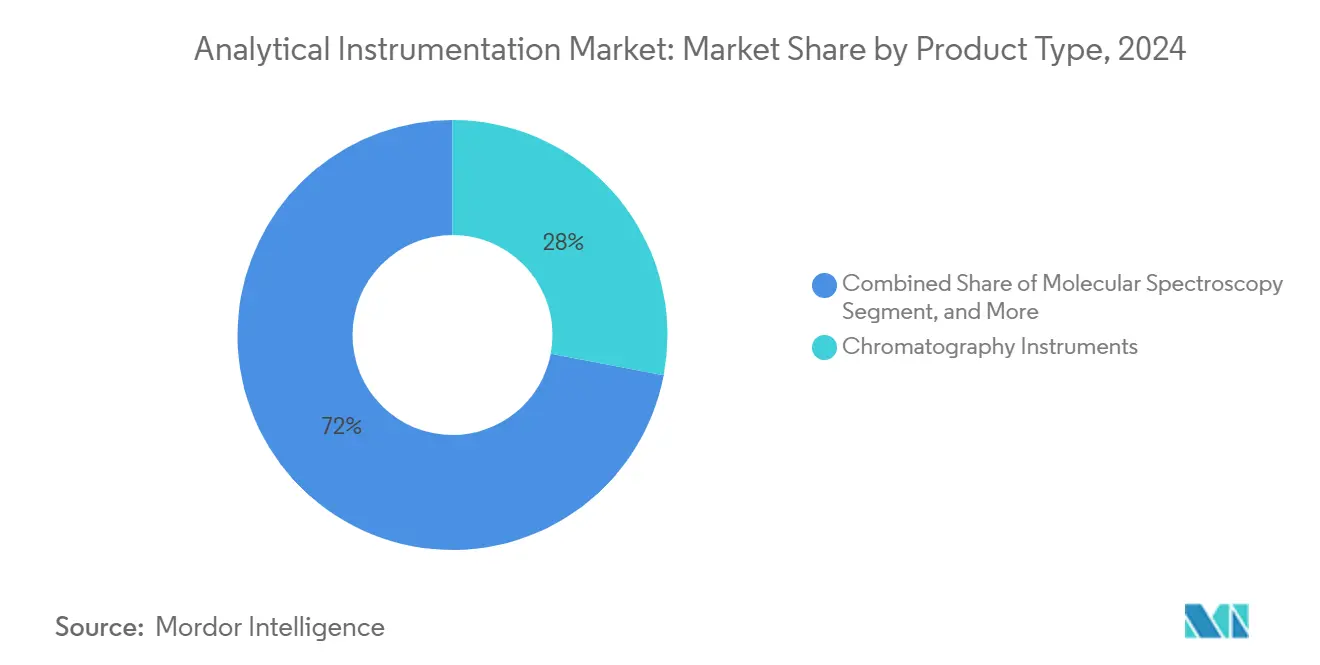
- By product category, chromatography instruments held 28% of analytical instrumentation market share in 2024, while mass spectrometry is projected to record the fastest 7.1% CAGR through 2030.
- By chromatography sub-segment, HPLC/UHPLC systems led with 56% revenue share in 2024; supercritical fluid chromatography is forecast to expand at a 7.3% CAGR to 2030.
- By mass spectrometry sub-segment, triple-quadrupole platforms captured 34.5% share in 2024, whereas Orbitrap & FT-MS systems are projected to advance at an 8.5% CAGR through 2030.
- By molecular spectroscopy sub-segment, UV-visible spectrometers accounted for 40.3% of the analytical instrumentation market size in 2024, and Raman spectrometers are growing at a 7.7% CAGR to 2030.
- By end-user industry, pharmaceuticals & biopharmaceuticals led with 34.1% revenue share in 2024; environmental testing laboratories are expected to expand at an 8.2% CAGR through 2030.
- By geography, North America generated 35% of analytical instrumentation market size in 2024, while Asia-Pacific is set to post the highest 7.6% CAGR between 2025 and 2030.
Global Analytical Instrumentation Market Trends and Insights
Drivers Impact Analysis
| Driver | (~) % Impact on CAGR Forecast | Geographic Relevance | Impact Timeline |
|---|---|---|---|
| Rising Adoption of Hyphenated Techniques for Biologics QA/QC | +1.0% | Global, with higher intensity in North America and Europe | Medium term (2-4 years) |
| Stringent Global Limits on PFAS & Micro-plastics Boosting Ultra-Trace Spectrometry | +0.8% | North America & EU, with growing influence in Asia Pacific | Long term (≥ 4 years) |
| Shift Toward Real-Time Release Testing (RTRT) in Pharma Production | +0.6% | Global, led by North America and Western Europe | Medium term (2-4 years) |
| Semiconductor Node Shrinkage < 3 nm Requiring Ultra-Sensitive Surface Analysis | +0.5% | Asia Pacific, North America | Short term (≤ 2 years) |
| Expansion of Renewable Aviation Fuel Programs Driving Feedstock Certification | +0.4% | North America, Europe, with emerging impact in Asia Pacific | Medium term (2-4 years) |
| In-Lab Analytics Surge for Battery Gigafactory Quality Assurance | +0.3% | Asia Pacific, North America, Europe | Medium term (2-4 years) |
Source: Mordor Intelligence
Rising Adoption of Hyphenated Techniques for Biologics QA/QC
Growing demand for complex biologics is encouraging manufacturers to replace single-dimension methods with hyphenated liquid chromatography–mass spectrometry platforms. Nearly 78% of biopharmaceutical plants now deploy at least one hyphenated workflow in quality operations, up from 2023 levels, enabling multi-attribute monitoring of critical quality attributes and trimming batch rejection rates by 15%.[1]American Pharmaceutical Review, “A Look at Pharmaceutical Analytical Testing,” americanpharmaceuticalreview.comEnhanced system integration allows real-time profiling of post-translational modifications, accelerating scale-up and release schedules. These gains are pushing capital budgets toward high-resolution LC-MS/MS and reinforcing supplier investments in automated data pipelines.
Stringent Global Limits on PFAS and Micro-plastics Boosting Ultra-Trace Spectrometry
Parts-per-trillion limits in the 2024 U.S. drinking-water rule and parallel European directives are forcing laboratories to add next-generation high-resolution mass spectrometers and Raman or FTIR microscopes capable of identifying particles down to 1 µm. Environmental labs increased capital outlays for such systems by 34% in 2024 alone, a trend likely to continue as ultrashort-chain PFAS detection becomes compulsory.[2]Shimadzu Corporation, “Researching Environmental Analytical Technologies to Address PFAS Challenges,” shimadzu.comMarket leaders now bundle automated sample preparation that extends run-time intervals and lowers detection thresholds, thereby strengthening recurring consumables revenue.
Shift Toward Real-Time Release Testing in Pharma Production
Supportive 2024 guidance from U.S. and EU regulators gave impetus to real-time release testing, which leverages in-line NIR and Raman spectroscopy to substitute endpoint testing. Early adopters report manufacturing cycle-time reductions of 30% to 40%, inventory compression, and improved process understanding. Instrument makers are integrating chemometric software that synchronizes with manufacturing execution systems, lowering the expertise barrier and broadening user bases beyond large multinational companies.
Semiconductor Node Shrinkage Less than 3 nm Requiring Ultra-Sensitive Surface Analysis
As transistor geometries move beneath 3 nm, single-atom contaminants can derail yield. Leading foundries call for a tenfold sensitivity gain versus 5 nm lines, prompting record orders for time-of-flight SIMS, high-resolution TEM, and advanced X-ray metrology.[3]SMC, “2025 TSMC North America Technology Symposium,” tspasemiconductor.substack.coSuppliers pair these instruments with predictive-maintenance dashboards that schedule lens-cleaning or source replacement based on machine-learning algorithms, protecting fabs from multi-million-dollar downtime events.
Restraints Impact Analysis
| Restraint | (~) % Impact on CAGR Forecast | Geographic Relevance | Impact Timeline |
|---|---|---|---|
| High Total Cost of Ownership of High-Resolution MS in Emerging Markets | -0.7% | Asia Pacific (excluding Japan, South Korea), Latin America, Africa | Medium term (2-4 years) |
| Shortage of Skilled Analytical Chemists Elevating Outsourcing Costs | -0.5% | Global, with acute impact in Asia Pacific and Middle East | Long term (≥ 4 years) |
| Helium Supply-Chain Volatility Impacting GC Operations | -0.3% | Global | Short term (≤ 2 years) |
| Lengthy Validation Cycles for Novel Analytical Methods in Regulated Sectors | -0.2% | Global, with higher impact in pharmaceuticals and food testing | Medium term (2-4 years) |
Source: Mordor Intelligence
High Total Cost of Ownership for High-Resolution MS
Pricing for flagship mass spectrometers ranges between USD 500,000 and USD 1.5 million, yet five-year operating expenses often exceed purchase price because of service contracts, infrastructure retrofits, and specialized consumables. Emerging-market labs face 30% to 45% higher TCO due to tariffs and limited local service capacity. These barriers delay adoption in water-quality and food-safety settings even as regulations tighten, prompting vendors to roll out streamlined “value-engineered” models and shared-service hubs.
Shortage of Skilled Analytical Chemists Elevating Outsourcing Costs
Demand for mass-spectrometry method developers and chromatographers outstrips supply by up to 20%. Median salaries climbed 12.3% in 2025, and contract-testing rates rose in tandem.[4]CGC International, “New Products Announced from MOBILion Systems, Agilent,” chromatographyonline.comAutomation handles routine injection queues, but complex sample prep, spectral interpretation, and compliance documentation remain human-intensive. Training partnerships and AI-driven annotation tools are easing pressure, though structural deficits are unlikely to resolve before 2030.
Segment Analysis
By Product Type: Mass Spectrometry Accelerates Precision Gains
Chromatography systems generated USD 15.48 billion in revenue and commanded 28% of analytical instrumentation market share in 2024. AI-enabled calibration routines now boost throughput by up to 70% while predictive algorithms flag maintenance needs, supporting sustained upgrades in both HPLC and gas chromatograph. In environmental labs, the need to profile PFAS has revived demand for advanced column chemistries and tandem detectors. Mass spectrometry, meanwhile, represents the fastest-expanding product family, slated for 7.1% CAGR through 2030 as ion-mobility innovations such as parallel accumulation with mobility-aligned fragmentation quintuple sample throughput and push sensitivity ceilings .
The analytical instrumentation market size for mass spectrometers is benefiting from cross-industry uptake-clinical proteomics, food authenticity, and battery materials all require deeper molecular insight. Triple-quadrupole and Q-TOF configurations account for the bulk of new installations owing to their balance between speed and resolution. Supplier roadmaps center on ultrahigh-field Orbitrap and timsTOF architectures that couple hardware advances with cloud-based deconvolution platforms, trimming data-processing times and freeing scarce analyst hours. Molecular spectroscopy remains a core revenue pillar for routine QA/QC, though Raman is gaining ground in pharmaceutical continuous manufacturing, where in-line probes verify blend uniformity in real time.
Note: Segment shares of all individual segments available upon report purchase
By Chromatography Instruments: HPLC Dominance Challenged by Green SFC Innovation
High-performance and ultra-high-performance liquid chromatography systems commanded 56% of this category, valued at USD 8.67 billion, as their reproducibility and matrix tolerance make them indispensable for potency, impurity, and stability testing. Artificial-intelligence plug-ins now automate gradient design, mobile-phase selection, and fault prediction, boosting sample throughput by up to 70% while reducing column waste. Microfluidic chip columns are entering proteomic workflows, delivering sub-minute separations that synchronize with fast-scanning mass spectrometers and support data-rich multi-omics studies.
Supercritical-fluid chromatography is projected to advance at 7.3% CAGR through 2030, the quickest cadence within liquid-phase separations. Its use of CO₂ and minimal co-solvent meets green-chemistry targets and lowers per-sample solvent cost, creating attractive payback in chiral drug screening and impurity isolation. Gas chromatography remains vital for volatile analyses, yet helium scarcity elevates operating expenses, accelerating migration to hydrogen carriers and micro-channel alternatives. Ion chromatography is back in focus as regulators tighten ionic-contaminant limits in drinking water and industrial effluent, prompting utilities to add automated inline suppressor systems that can handle 24/7 monitoring.
By Mass Spectrometry: Orbitrap Systems Revolutionizing High-Resolution Analysis
Mass spectrometry posted the fastest growth trajectory, heading for a 7.1% CAGR, as laboratories seek deeper molecular insight in clinical diagnostics, toxicology, and advanced materials. Triple-quadrupole instruments held 34.5% sub-segment value at USD 5.57 billion because they deliver rugged quantitation for regulated assays and are supported by extensive compound libraries. Hardware refinements such as orthogonal-spray ion sources cut matrix effects and extend maintenance intervals, aligning with clinical labs’ 24/7 uptime requirements.
Orbitrap and other Fourier-transform platforms are forecast to expand at 8.5% CAGR, spurred by ultra-high resolution essential for single-cell proteomics and complex mixture analysis. The 2025 Orbitrap Astral MS raises sensitivity 30% over predecessors and pairs with AI-driven peptide-matching algorithms that slash data-processing hours. The breakthrough Parallel Accumulation with Mobility-Aligned Fragmentation architecture achieves near-100% ion utilization, delivering fivefold higher throughput and reshaping cost-per-analysis economics. Quadrupole-time-of-flight systems gain traction in non-target-screening of food fraud and emerging contaminants, while MALDI-TOF retains microbiology dominance but now faces slower incremental growth as clinical coverage nears saturation.
By Molecular Spectroscopy: Raman Technology Gains Momentum in Process Analytics
Molecular spectroscopy remains a staple across laboratories, with UV-visible instruments accounting for 40.3% of sub-segment revenue or USD 4.46 billion. Their simplicity and low cost make them ideal for raw-material ID checks, dissolution profiling, and colorimetric assays. Product updates now include fiber-optic probes and Wi-Fi connectivity that enable remote monitoring on manufacturing lines, lowering sample-transfer risk and real-time deviation detection. Miniaturized UV-vis devices matching bench performance are migrating into field kits for ecological assessments and on-farm quality checks.
Raman spectroscopy is the fastest-advancing molecular method at 7.7% CAGR thanks to real-time release testing and non-invasive formulation analysis. Inline probes verify blend uniformity, polymorph distribution, and solvent-residual content without halting production. Thermo Fisher Scientific’s DXR3 SmartRaman demonstrated accurate preservative quantitation in vaccine vials, illustrating at-line control potential. Portable Raman units equipped with advanced chemometric models now screen micro-plastics on beaches and diagnose counterfeit drugs in low-resource settings. FT-IR and NIR retain steady growth in process analytics, while fluorescence spectroscopy builds niche strength in organic pollutant tracing within municipal water networks.

Note: Segment shares of all individual segments available upon report purchase
By End-User Industry: Environmental Testing Labs Surge Amid Regulatory Pressures
Pharmaceutical and biopharmaceutical facilities accounted for 34.1% of analytical instrumentation market size in 2024, translating to USD 18.85 billion, because strict quality-by-design frameworks and biologics complexity demand multi-attribute analytics. High-resolution mass spectrometry combined with automated peptide-mapping now condenses multiple assays into one run, cutting analytical costs by 30% and hastening batch disposition. Cloud-native laboratory information systems boost collaboration across global R&D centers and automate compliance reporting, reinforcing demand for software-hardware convergence.
Environmental testing laboratories are predicted to grow 8.2% CAGR, capturing new funding tied to PFAS reporting that begins July 2025 and expanding micro-plastic surveillance programmes. Investments prioritise LC-MS/MS, FT-IR microscopy, and Raman systems capable of sub-ppm and sub-µm detection, respectively. The analytical instrumentation market size dedicated to this user group is accelerating as national stimulus packages subsidise lab upgrades in water utilities and regional pollution-control boards. Semiconductor fabs form another fast-growing cohort; <3 nm nodes require atomic-level contamination control, leading to round-the-clock deployment of surface-analytical metrology inside Class 1 cleanrooms.
Geography Analysis
North America generated USD 19.35 billion in 2024, equivalent to 35% of the analytical instrumentation market. Demand is anchored in FDA-driven real-time release testing, EPA-mandated parts-per-trillion PFAS limits, and a USD 52 billion CHIPS Act outlay that funds new fabs, each specifying sub-nanometer metrology. Laboratories adopt hydrogen-ready gas chromatographs and low-dead-volume HPLC pumps to mitigate helium costs and solvent waste, illustrating an appetite for greener workflows.
Asia-Pacific is forecast to deliver a 7.6% CAGR, reflecting pharmaceutical manufacturing scale-ups in China and India, plus advanced logic and memory production in Taiwan and South Korea. Regional governments tighten water-quality and industrial-emission standards, encouraging state-owned labs to tender multi-year procurement contracts for ICP-MS, LC-MS/MS, and handheld Raman. The analytical instrumentation market size allocated to semiconductor QA/QC in Asia-Pacific is projected to outgrow every other vertical as foundries race for gate-all-around transistors and high-bandwidth memory.
Europe maintains a robust, regulation-driven posture. The European Green Deal funds nationwide PFAS monitoring, circular-economy research, and solvent-free chromatography pilots. Pharmaceutical hubs in Germany, Ireland, and Switzerland integrate continuous-manufacturing lines that embed PAT analytics. Meanwhile, South America and the Middle East and Africa record steady but smaller gains as refineries, agro-exporters, and mining firms modernize labs to meet international trade certifications. High TCO remains a hurdle, so distributors increasingly promote lease-to-own and pay-per-sample schemes that lower entry barriers for first-time buyers.
Competitive Landscape
Five global suppliers-Agilent Technologies, Thermo Fisher Scientific, Shimadzu Corporation, Danaher (through its Sciex and Beckman brands), and Bruker-control about 65% of revenue, giving the analytical instrumentation market a moderately concentrated structure. Mass spectrometry and UHPLC are the most consolidated niches because proprietary detector designs, compliance software, and service networks raise switching costs. Vendors now compete on integrated ecosystems that couple instruments with AI-powered data platforms. Agilent’s InfinityLab LC family automates solvent purging, column conditioning, and pump-seal diagnosis, trimming unscheduled downtime and improving retention-time precision.
The race to embed machine learning is intensifying. European Patent Office data show a 23% year-on-year rise in AI-enhanced workflow filings during 2024, reflecting vendor conviction that smart software will mitigate workforce shortages and expand the analytical instrumentation market into resource-constrained geographies. Niche specialists carve opportunity in ultra-trace environmental analysis, spatial biology, and single-cell metabolomics, prompting incumbents to pursue bolt-on acquisitions to protect growth runways. Thermo Fisher’s Orbitrap Astral launch raises the proteomics bar, while Bruker’s timsTOF Ultra 2 targets spatial biology with higher ion-mobility resolution.
Service business models are evolving. Subscription packages guarantee uptime via remote diagnostics and just-in-time spares; predictive-maintenance algorithms already reduce unplanned outages by 20%. Helium-recycling retrofits, on-site nitrogen generators for LC-MS, and solvent-recovery kits widen after-sale profit pools and embed sustainability credentials that resonate with ESG-driven buyers. Despite consolidation pressure, regional brands remain influential by tailoring products to local sample matrices, regulatory nuances, and language-specific software interfaces.
Analytical Instrumentation Industry Leaders
-
Agilent Technologies, Inc
-
Bruker Corporation
-
PerkinElmer Inc.
-
Thermo Fisher Scientific
-
Shimadzu Corporation
- *Disclaimer: Major Players sorted in no particular order

Need More Details on Market Players and Competitors?
Download PDF
Recent Industry Developments
- May 2025: Thermo Fisher Scientific introduced the Orbitrap Astral MS, achieving 30% higher proteomics sensitivity vs. prior models.
- April 2025: Agilent rolled out the 1290 Infinity II Bio Online LC System for real-time bioprocess monitoring
- March 2025: Shimadzu inaugurated a PFAS research lab with the Hangzhou Institute for Advanced Study to develop ultrashort-chain detection methods.
- February 2025: Waters acquired a high-resolution mass-spectrometry specialist, bolstering environmental analysis offerings.
- January 2025: Bruker unveiled timsTOF Ultra 2 and neofleX™ MALDI imaging for spatial omics.
Global Analytical Instrumentation Market Report Scope
Analytical instruments encompass a wide range of instrumentation whose principal purpose is to qualitatively and quantitatively analyze samples, the chemical makeup of a sample, and the quantity of each component within a sample. The market is defined by the revenue generated from the sale of different types of analytical instrumentations offered by various market players for several applications across end-user industries worldwide.
The analytical instrumentation market is segmented by product type (chromatography, molecular analysis spectroscopy, elemental analysis spectroscopy, mass spectroscopy, and analytical microscopes, other product types), end-user industry (life sciences, chemical and petrochemical, oil and gas, material sciences, food testing, and water and wastewater, other end-user industries), and geography (North America, Europe, Asia-Pacific, and rest of the world). The market sizes and forecasts are provided in value (USD ) for all the above segments.
| By Product Type | Chromatography Instruments | Gas Chromatography (GC) Systems | ||
| High-/Ultra-High-Performance Liquid Chromatography (HPLC/UHPLC) | ||||
| Ion Chromatography (IC) Systems | ||||
| Supercritical Fluid Chromatography (SFC) Systems | ||||
| Molecular Spectroscopy | UV-Visible Spectrometers | |||
| Fourier Transform Infrared (FT-IR) Spectrometers | ||||
| Near-Infrared (NIR) Spectrometers | ||||
| Raman Spectrometers | ||||
| Fluorescence Spectrometers | ||||
| Elemental Spectroscopy | Atomic Absorption Spectrometers (AAS) | |||
| ICP-Optical Emission Spectrometers (ICP-OES) | ||||
| ICP-Mass Spectrometers (ICP-MS) | ||||
| X-Ray Fluorescence (XRF) Spectrometers | ||||
| Mass Spectrometry | Single Quadrupole MS Systems | |||
| Triple Quadrupole MS Systems | ||||
| Quadrupole-Time-of-Flight (Q-TOF) MS Systems | ||||
| Orbitrap and FT-MS Systems | ||||
| MALDI-TOF MS Systems | ||||
| Analytical Microscopes and Imaging Systems | Scanning Electron Microscopes (SEM) | |||
| Transmission Electron Microscopes (TEM) | ||||
| Atomic Force Microscopes (AFM) | ||||
| Confocal and Optical Microscopes | ||||
| Surface, Thermal and Particle Characterisation Instruments | X-Ray Diffraction (XRD) Systems | |||
| Thermal Analysis Instruments (DSC, TGA, etc.) | ||||
| Particle Size and Zeta Potential Analysers | ||||
| Consumables and Accessories | ||||
| Data Management Software and Services | ||||
| By End-User Industry | Pharmaceuticals and Biopharmaceuticals | Drug Discovery and Development | ||
| Manufacturing QA/QC | ||||
| Clinical and Diagnostics Laboratories | ||||
| Environmental Testing Laboratories | ||||
| Food and Beverage Testing | ||||
| Chemical and Petrochemical | ||||
| Oil and Gas (Upstream, Midstream, Downstream) | ||||
| Materials Science and Metallurgy | ||||
| Semiconductor and Electronics | ||||
| Academic and Government Research Institutes | ||||
| Forensic and Security | ||||
| Water and Wastewater Utilities | ||||
| By Geography | North America | United States | ||
| Canada | ||||
| Mexico | ||||
| Europe | Germany | |||
| United Kingdom | ||||
| France | ||||
| Italy | ||||
| Spain | ||||
| Nordics | ||||
| Rest of Europe | ||||
| Asia-Pacific | China | |||
| Japan | ||||
| South Korea | ||||
| India | ||||
| South East Asia | ||||
| Australia | ||||
| Rest of Asia-Pacific | ||||
| South America | Brazil | |||
| Rest of South America | ||||
| Middle East and Africa | Middle East | United Arab Emirates | ||
| Saudi Arabia | ||||
| Rest of Middle East | ||||
| Africa | South Africa | |||
| Rest of Africa | ||||
By Product Type
| Chromatography Instruments | Gas Chromatography (GC) Systems |
| High-/Ultra-High-Performance Liquid Chromatography (HPLC/UHPLC) | |
| Ion Chromatography (IC) Systems | |
| Supercritical Fluid Chromatography (SFC) Systems | |
| Molecular Spectroscopy | UV-Visible Spectrometers |
| Fourier Transform Infrared (FT-IR) Spectrometers | |
| Near-Infrared (NIR) Spectrometers | |
| Raman Spectrometers | |
| Fluorescence Spectrometers | |
| Elemental Spectroscopy | Atomic Absorption Spectrometers (AAS) |
| ICP-Optical Emission Spectrometers (ICP-OES) | |
| ICP-Mass Spectrometers (ICP-MS) | |
| X-Ray Fluorescence (XRF) Spectrometers | |
| Mass Spectrometry | Single Quadrupole MS Systems |
| Triple Quadrupole MS Systems | |
| Quadrupole-Time-of-Flight (Q-TOF) MS Systems | |
| Orbitrap and FT-MS Systems | |
| MALDI-TOF MS Systems | |
| Analytical Microscopes and Imaging Systems | Scanning Electron Microscopes (SEM) |
| Transmission Electron Microscopes (TEM) | |
| Atomic Force Microscopes (AFM) | |
| Confocal and Optical Microscopes | |
| Surface, Thermal and Particle Characterisation Instruments | X-Ray Diffraction (XRD) Systems |
| Thermal Analysis Instruments (DSC, TGA, etc.) | |
| Particle Size and Zeta Potential Analysers | |
| Consumables and Accessories | |
| Data Management Software and Services |
By End-User Industry
| Pharmaceuticals and Biopharmaceuticals | Drug Discovery and Development |
| Manufacturing QA/QC | |
| Clinical and Diagnostics Laboratories | |
| Environmental Testing Laboratories | |
| Food and Beverage Testing | |
| Chemical and Petrochemical | |
| Oil and Gas (Upstream, Midstream, Downstream) | |
| Materials Science and Metallurgy | |
| Semiconductor and Electronics | |
| Academic and Government Research Institutes | |
| Forensic and Security | |
| Water and Wastewater Utilities |
By Geography
| North America | United States | ||
| Canada | |||
| Mexico | |||
| Europe | Germany | ||
| United Kingdom | |||
| France | |||
| Italy | |||
| Spain | |||
| Nordics | |||
| Rest of Europe | |||
| Asia-Pacific | China | ||
| Japan | |||
| South Korea | |||
| India | |||
| South East Asia | |||
| Australia | |||
| Rest of Asia-Pacific | |||
| South America | Brazil | ||
| Rest of South America | |||
| Middle East and Africa | Middle East | United Arab Emirates | |
| Saudi Arabia | |||
| Rest of Middle East | |||
| Africa | South Africa | ||
| Rest of Africa | |||
Need A Different Region or Segment?
Customize Now
Key Questions Answered in the Report
What is the current size of the analytical instrumentation market?
The market stands at USD 55.29 billion in 2025 and is projected to reach USD 76.87 billion by 2030, growing at a 6.81% CAGR.
Which product type is expanding fastest?
Mass spectrometry leads with an expected 7.1% CAGR through 2030, driven by orbitrap and ion-mobility breakthroughs that deliver higher resolution and throughput.
Why are environmental laboratories investing in new instruments?
Parts-per-trillion PFAS limits and mandatory micro-plastics reporting require ultra-trace detection, prompting labs to purchase high-resolution LC-MS/MS, FT-IR microscopy, and Raman systems.
How is semiconductor miniaturization affecting demand?
Sub-3 nm process nodes need atomic-level contamination control, stimulating orders for time-of-flight SIMS, high-resolution TEM, and advanced X-ray metrology, especially in Asia-Pacific and North America.
What challenges could constrain market growth?
High total cost of ownership for high-resolution instruments in emerging regions and a global shortage of skilled analytical chemists elevate outsourcing costs and lengthen method-development timelines.
Which region will grow fastest through 2030?
Asia Pacific is set to record a 7.6% CAGR as pharmaceutical capacity expands and advanced semiconductor fabs increase instrumentation requirements.

